County Health Profiles
To better understand what influences the health of Tennesseans, we must consider people’s lives in a larger context. The Sycamore Institute’s County Health Profiles provide a snapshot of health outcomes and the drivers of population health in all 95 Tennessee counties.
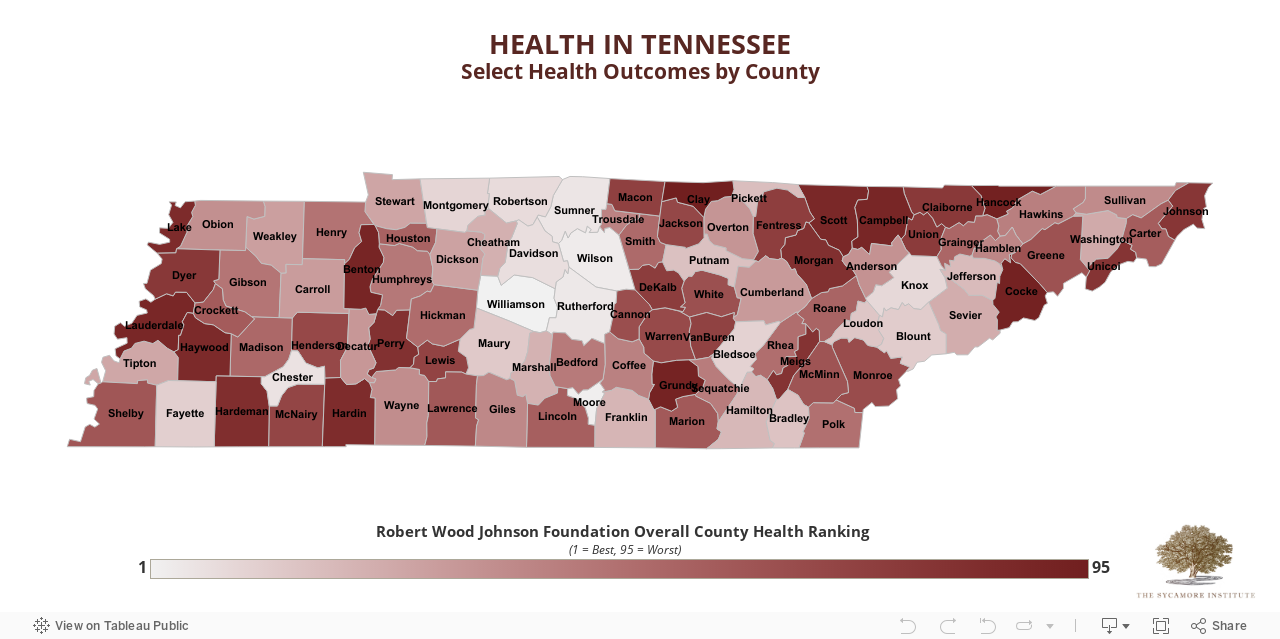
Use the map to explore how different measures of health vary across the state. Below the map, download each county’s full profile to learn more about the factors that drive these outcomes and how each county compares to the others, the state as a whole, and the nation.
County Health Profile PDFs
See the Methods Appendix for more information about the methods, measures, and data sources used to compile these profiles.
About Each Measure
Click to Open/Close
Quick Facts
2019 Population: total estimated population on July 1, 2019
Data Source: U.S. Census Bureau’s Annual Estimates of the Resident Population
Years of Data: 2019
Age <18: percent of total 2019 mid-year population estimate under the age of 18
Data Source: U.S. Census Bureau’s Annual Estimates of the Resident Population
Years of Data: 2019
Age 65+: percent of total 2019 mid-year population estimate ages 65 and older
Data Source: U.S. Census Bureau’s Annual Estimates of the Resident Population
Years of Data: 2019
Race/Ethnicity: percent of total 2019 mid-year population estimate represented by the three largest race/ethnicity groups in each county.
Data Source: U.S. Census Bureau’s Annual Estimates of the Resident Population
Years of Data: 2019
Percent Rural: percent of population living in a rural area
Data Source: U.S. Census Bureau’s 2010 Census
Years of Data: 2010
Notes: Based on the Census Bureau’s definition, rural includes all populations not within Urbanized Areas of 50,000 people or more or Urbanized Clusters of at least 2,500 people and less than 50,000 people.
County Health Outcomes
Overall Health Ranking: overall health outcomes ranking
Data Source: Robert Wood Johnson Foundation (RWJF) County Health Rankings
Years of Data: 2020
Fair/Poor Health: percent of adults who rate their health as “fair” or “poor” (age-adjusted rate)
Data Source: U.S. Center for Disease Control and Prevention’s (CDC) Behavioral Risk Factor Surveillance System (BRFSS) via the 2020 RWJF County Health Rankings
Years of Data: 2017
Adult Diabetes: percent of adults ages 20+ who have ever been diagnosed with diabetes (age-adjusted rate)
Data Sources: CDC’s U.S. Diabetes Surveillance System
Years of Data: 2017
Notes: The state rate is the median value of all 95 counties in Tennessee. The national rate is the median value across all U.S. counties.
Poor Mental Health Days: average number of days in the past 30 days adults reported “not good” mental health (age-adjusted)
Data Source: CDC’s BRFSS via the RWJF’s 2020 County Health Rankings
Years of Data: 2017
Obese Adults: percent of adults ages 20+ that report a body mass index (BMI) of 30 or more (age-adjusted rate)
Data Sources: CDC’s U.S. Diabetes Surveillance System
Years of Data: 2017
Notes: The state rate is the median value of all 95 counties in Tennessee. The national rate is the median value across all U.S. counties.
Overweight/Obese Students: Percent of public school students that are overweight or obese
Data Source: Tennessee Coordinated School Health Program via the Kids Count Data Center
Years of Data: 2018
Note: Comparable national rates are not available for the age-range represented by the county- and state- level data used here.
Low Birth Weight Babies: percent of live births in which the baby weighed less than 2,500 grams (or 5 pounds, 8 ounces)
Data Source: Tennessee Department of Health via the Kids Count Data Center
Years of Data: 2018
Social & Economic Environment
Poverty Rate: percent of the population living in households with incomes below the poverty level
Data Source: U.S. Census Bureau’s American Community Survey
Years of Data: 2014-2018 5-year estimates
Educational Attainment (Associates Degree or More): percent of population ages 25+ with at least an associate’s degree
Data Source: U.S. Census Bureau’s American Community Survey
Years of Data: 2014-2018 5-year estimates
Unemployment Rate: percent of population that does not have a job, are available for work, and have actively looked for a work in the prior 4 weeks (annual rate)
Data Source: U.S. Bureau of Labor Statistics’ Local Area Unemployment
Years of Data: 2019
Median Household Income: median income of all households
Data Source: U.S. Census Bureau’s American Community Survey
Years of Data: 2014-2018 5-year estimates
Crime Rate: number of crimes committed per 1,000 population
Data Source: Tennessee Bureau of Investigation’s TIBRS Online Reports System
Years of Data: 2019
Note: National rates are not available for 2019.
Health Behaviors
Drug Overdose Deaths: total drug overdose deaths per 100,000 population
Data Source: CDC WONDER Database
Years of Data: 2014-2018 5-year average
Adult Smokers: percent of adults who currently smoke
Data Sources: CDC’s BRFSS via RWJF’s 2020 County Health Rankings
Years of Data: 2017
Physically Inactive Adults: percent of adults age 20+ reporting no leisure-time physical activity (age-adjusted rate)
Data Sources: CDC’s U.S. Diabetes Surveillance System
Years of Data: 2017
Notes: The state rate is the median value of all 95 counties in Tennessee. The national rate is the median value across all U.S. counties.
Excessive Drinking: percent of adults reporting binge or heavy drinking
Data Source: CDC’S BRFSS via RWJF’s 2020 County Health Rankings
Years of Data: 2017
Notes: Binge drinking is defined as >4 drinks for women or >5 drinks for men on a single occasion in the past 30 days. Heavy drinking is defined as an average of >1 drink for women or >2 drinks for men per day.
Clinical Care
Uninsured Rate, Age <65: percent of population under 65 without health insurance
Data Source: U.S. Census Bureau’s Small Area Health Insurance Estimates
Years of Data: 2018
Notes: The U.S. Census Bureau combines American Community Survey, administrative records data, and 2010 Census data to produce single-year, county-level uninsured rates.
Pregnant Women Receiving Adequate Prenatal Care: percent of live births in a given calendar year where the mother received adequate prenatal care
Data Source: Tennessee Department of Health via the Kids Count Data Center
Years of Data: 2018
Note: The adequacy of care is based on the Kessner index, which was developed by the Institute of Medicine in 1973 to assess prenatal care. Comparable national data are unavailable for this measure.
Mental Health Providers: number of mental health providers per 100,000 population
Data Source: U.S. Centers for Medicare and Medicaid Services (CMS) via RWJF’s 2020 County Health Rankings
Years of Data: 2019
Notes: Mental health providers include psychiatrists, psychologists, licensed clinical social workers, counselors, marriage and family therapists, mental health providers who treat alcohol and other drug abuse, and advanced practice nurses specializing in mental health care. The reported data were converted from the underlying data, which provided the ratio of the county population to mental health providers
Physical Environment
Air Quality: average annual ambient concentration of particulate matter measured in micrograms per cubic meter
Data Source: CDC’s National Environmental Public Health Tracking Network
Years of Data: 2014
Notes: The Tennessee data represent the 95-county average. The national number represents the average across all U.S. counties. For context, the national air quality standard recommends a concentration of 12.0 micrograms per cubic meter or less. Tennessee does not have air quality monitors in all 95 counties. As a result, the data reported for 79 counties are CDC’s modeled estimates.
Percent with Severe Housing Problems: percent of occupied housing units with 1 or more of the following severe housing problems: is severely cost-burdened (i.e. spend 50% or more of monthly income on housing costs), housing lacks complete kitchen, housing lacks complete plumbing, and/or is severely overcrowded (i.e. more than 1.5 persons per room)
Data Source: U.S. Housing and Urban Development’s (HUD) Comprehensive Housing Affordability Strategy data
Years of Data: 2013-2017 5-year estimates
Our Latest Health Analysis

Youth Mental Health in Tennessee: Eight Opportunities for Additional Action
Tennessee has made investments in a mix of promising, innovative, and evidence-based mental health services and programs for children. We identified policy options in eight areas worth exploring to further strengthen Tennessee’s support of positive mental health among youth.

National Report Ranks Tennessee 36th in Child Well-Being, Spotlights Learning Loss and Chronic Absenteeism
Tennessee ranks 36th in overall child well-being, according to the 2024 KIDS COUNT® Data Book, a 50-state report analyzing recent data on how kids across the country are faring.

2022 Income, Poverty, Health Insurance Coverage, and Education in Tennessee’s 95 Counties
Tennessee’s 95 counties continued to experience large differences in income levels, poverty rates, educational attainment, and health insurance status in 2018-2022.


