Key Takeaways
- Tennessee counties with higher child poverty rates tend to have lower standardized test scores and higher rates of abuse, neglect, and food-insecurity among youth.
- About 23% of low-income 3rd graders met or exceeded expectations on state reading tests in 2017-2019. In some counties, those kids scored as much as 30 points lower than their higher-income peers.
- A child’s reading skills by the end of 3rd grade influence their odds of success in school and beyond — which means these gaps are important for understanding lifelong success.
- Of the factors we explored, three helped explain differences in low-income 3rd graders’ test scores across counties: other students’ scores, socioeconomic comingling, and concentration of low-income students.
- Our findings raise many important questions that warrant more exploration about the role of communities in supporting achievement and economic mobility for low-income Tennessee children.
- Finding ways to encourage relationship-building across class lines and focused attention on areas of high poverty concentration could help promote better outcomes for all children.
Background
When families don’t have the resources to meet basic needs, children’s health, education, and well-being suffer. (1) In a prior report, we provided a picture of the children, families, and communities in Tennessee with the highest rates of child poverty — one measure of economic-well-being.
Here, we examine the connections between economic disadvantage and educational outcomes. By focusing on gaps in 3rd grade reading achievement, we explore the effects of community-level programs, policies, norms, and assets in Tennessee.
Child Poverty and Outcomes Across Tennessee
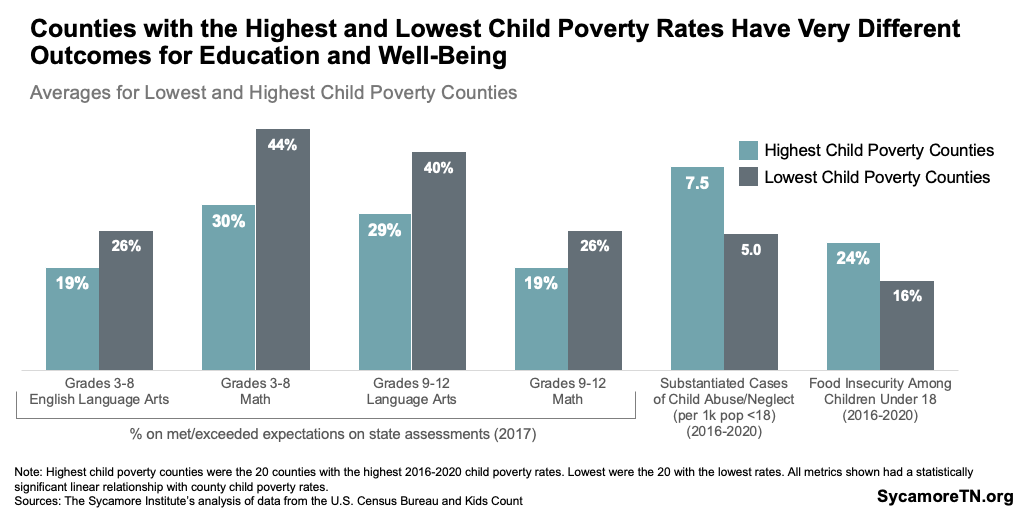
Tennessee counties with higher child poverty rates tend to have lower standardized test scores and higher rates of abuse, neglect, and food-insecure youth.[1] We explored several county-level measures to understand how youth outcomes differ between counties with high and low rates of child poverty.[2] Test scores, rates of abuse, neglect, and youth food insecurity all had meaningful and statistically significant relationships with county child poverty rates (Figure 1). Overall, these trends show that counties with high child poverty rates may face multiple challenges that impact child well-being. See the Methods Appendix of the prior report for more information about each measure and the full statistical results of our analyses.
Figure 1
Academic Achievement of Low-Income Students
State data also show persistent gaps in academic performance between students who are economically disadvantaged and those who are not.[3] In 2022, for example, only about 20% of economically disadvantaged 3rd graders in Tennessee had met or exceeded expectations for English language arts (ELA), according to the state’s TNReady test — compared with 43% of their peers who were not economically disadvantaged. Similar disparities have persisted over time across grade level and subject matter (Figure 2). (4)
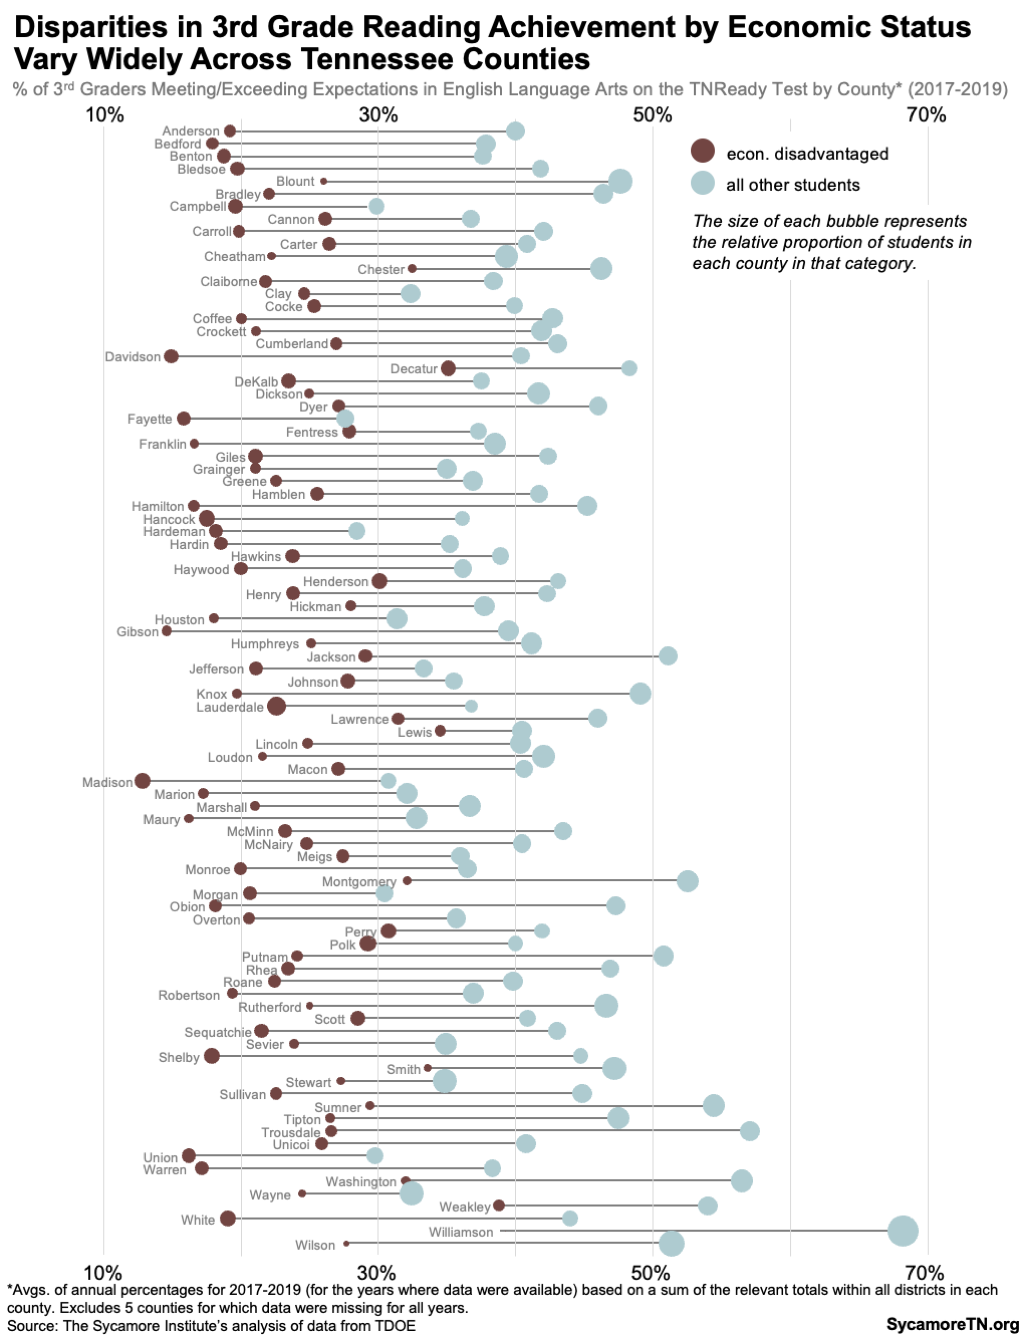
Gaps in test achievement also exist at the county level, but some counties have smaller disparities and higher achievement among economically disadvantaged students. Focusing on ELA, about 23% of economically disadvantaged 3rd graders across the state had met or exceeded expectations each year between 2017-2019, on average. This ranged from a low of 13% in Madison County to a high of 39% in Williamson County (Figure 3). The difference in achievement levels among economically disadvantaged students and their peers was as small as six percentage points in Lewis County (35% vs. 41%) to as big as 30 points in Trousdale County (27% vs. 57%) (Figure 4). (5)
Figure 2
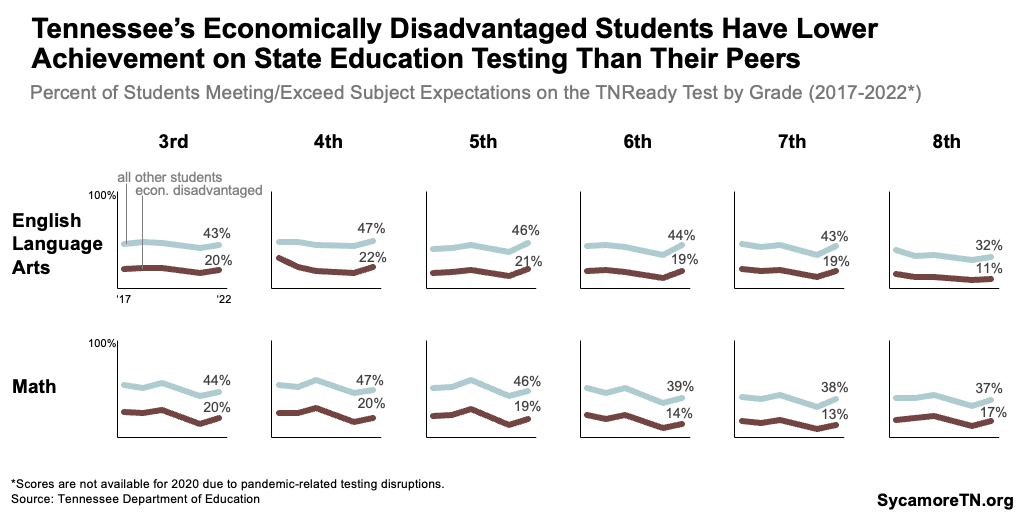
Figure 3
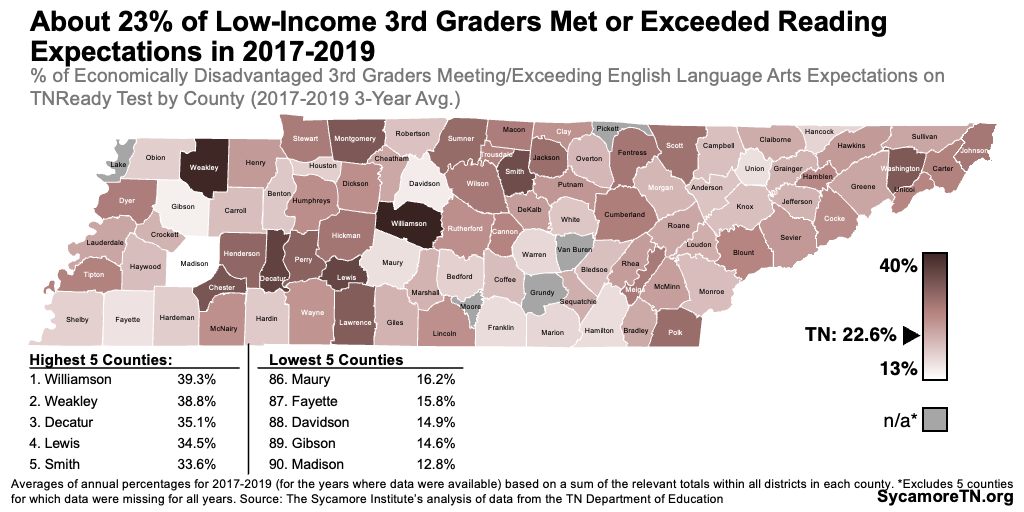
Figure 4
Why Academic Achievement Matters
A child’s reading skills by the end of 3rd grade impact their odds of success in school and beyond — which means these gaps are important for understanding lifelong success. (6) Efforts to promote success among low-income children often look to their 3rd grade reading scores as a way to boost their chances of having more resources (economic mobility) and better life outcomes by raising the likelihood of graduation and college attendance rates. (7)(8)
Explaining County Variation in Achievement for Low-Income Students
We explored multiple community assets and characteristics to better understand why some counties have higher test scores and smaller achievement gaps for low-income students. Prior research suggests that household characteristics may play the largest role in a child’s educational achievement but that community-level characteristics also shape outcomes. (9) (10) (11) These include things like school funding, access to supports in and outside the school system, concentrated poverty, adult educational attainment, and classroom size. (6) (12) (13) (14) We analyzed these and other characteristics (Table 1) in an attempt to explain the range of outcomes shown in Figure 4.
What We Found
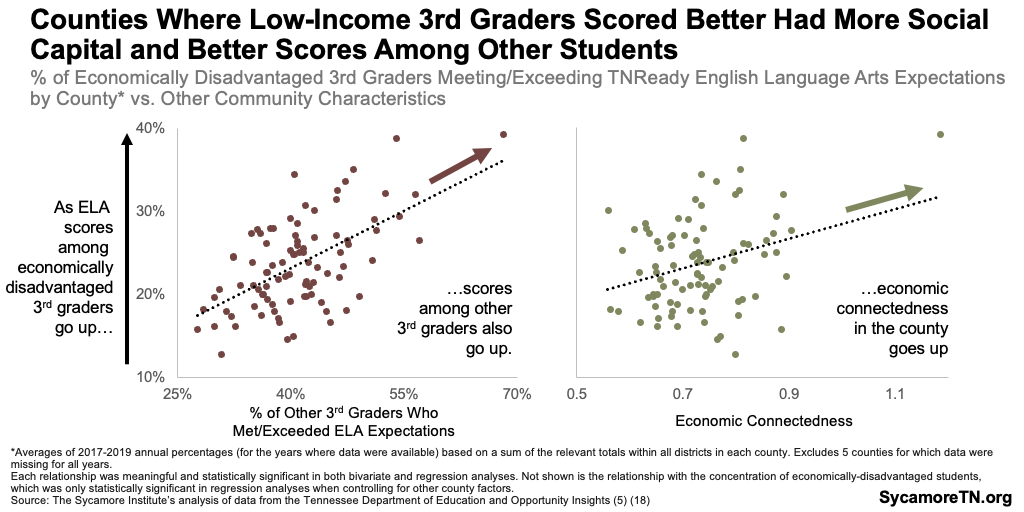
Of the factors we explored, three helped explain differences in low-income 3rd graders’ test scores: other students’ scores, socioeconomic comingling and concentration of low-income students. Counties with higher ELA test scores for economically disadvantaged 3rd graders tended to have lower concentrations of low-income students, better scores among other students, and more social connection across economic lines (Figure 5). These relationships were both meaningful and statistically significant in regression analyses (see Tables A5-A6 in the Appendix). Of the three, the most important in understanding county differences was scores among non-economically disadvantaged students. Many of the other factors explored in Table 1 were correlated with better test scores among non-economically disadvantaged 3rd graders but not economically disadvantaged ones (see Table A3 in the Appendix).
Prior research supports the idea that more social connection across economic lines may foster better outcomes and more social and economic mobility among low-income children. (15) (16) (17) Economic connectedness — or socioeconomic comingling — is one type of social capital, which describes the value people gain from connections and resources available in their community and personal network. Here, economic connectedness includes friendships between individuals of high- and low-socioeconomic status — as measured by social media interactions. (15) Similar to our findings, the original research found that economic connectedness was more important than other measures in predicting economic mobility (i.e. how many low- and middle-income children would move to the top 20th income percentile in adulthood). (15) (16)
We also found economic connectedness to be strongly and significantly correlated with lower poverty rates and higher median household income and adult education levels. However, these economic indicators did not predict better test scores among economically disadvantaged students (see Table A5 in the Appendix).
See the Appendix for more information about each measure and the full statistical results of our analyses.
Table 1
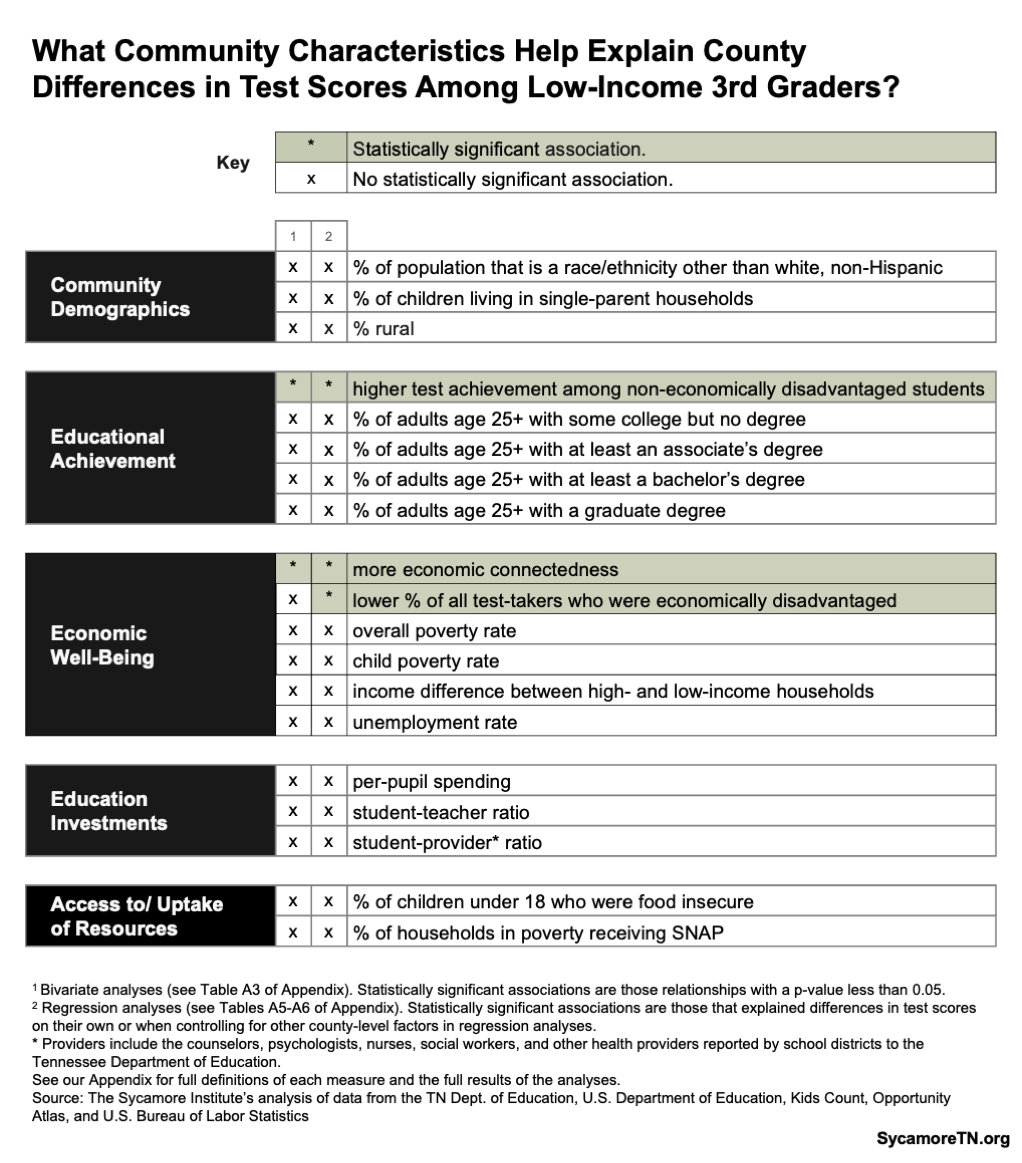
Figure 5
Limitations
Our findings raise many important questions that warrant more study about the role of communities in supporting economic mobility among low-income children in Tennessee. For example, existing research shows that community-level factors influence test performance and economic outcomes for low-income students. (9) (10) (6) (11) We attempted to explore some of these relationships in Tennessee, but our county-level analyses did not account for other factors on the school or district level that may affect the learning environment and student performance — such as school-level resources (e.g. funding, support staff), years of teacher experience, and teacher diversity, among others. These and other potential drivers deserve more thorough analysis in the future.
Why It Matters
Research like this seeks to better understand how new and existing policy and community levers could help achieve better outcomes for low-income children. Our state and federal governments already fund dozens of programs aimed at helping kids and their families not only survive but thrive. For example:
- TennCare — As of February 2023, TennCare — Tennessee’s state-operated Medicaid program — provides health coverage to over 900,000 children in low-income households.(16) In FY 2020, TennCare spent over $3 billion on child enrollees — which were jointly covered by state and federal dollars. (17) The governor’s FY 2024 budget also proposes providing eligible children with 12 months of continuous coverage regardless of changes in income or family size. TennCare seeks to improve lives towards a “vision of a healthier Tennessee.” (18)
- SNAP — As of September 2022, Tennessee’s Supplemental Nutrition Assistance Program (SNAP) provided grocery stipends to over 800,000 low-income children and their parents.(19) These benefits are administered by the state but federally-funded and totaled over $3 billion in federal fiscal year (FY) 2021. (20)
- Earned-Income Tax Credit — In 2021, over 600,000 low- and moderate-income working families with children were credited $1.5 billion.(21) The EITC reduces eligible families’ federal income tax burden and is fully refundable for households that do not owe taxes.
- Head Start — In federal FY 2021, the U.S. government spent over $182 million to provide Head Start early learning services to about 16,500 low-income children in Tennessee.(22) Head Start is federally-funded and -administered.
- Child Care Assistance — Tennessee spent about $195 million in federal funds to provide childcare assistance to over 22,000 low-income children each month, on average, in federal FY 2020.(23) (24)
- WIC — In federal FY 2022, Tennessee received $134 million in federal funding to support nearly 114,000 low-income mothers and infants under the Special Supplemental Nutrition Program for Women, Infants, and Children (WIC).(25) (26) WIC is aimed at “improving the health of pregnant women, new mothers, and their infants.” (27)
- Families First — As of September 2022, the Families First program aided nearly 30,000 low-income children and their parents. (28) In federal FY 2020, Tennessee spent about $74 million in federal funds and $90 million in state money on these activities.(29) Families First is Tennessee’s Temporary Assistance for Needy Families (TANF) program, which provides temporary cash assistance, transportation, child care assistance, job training, and employment activities meant to develop self-sufficiency among participants. (30)
Money spent through these programs lifts people out of poverty, but the ability of each program to produce better outcomes is not always clear. The U.S. Census Bureau’s supplemental poverty measure accounts for 17 different federal benefits (e.g. SNAP, WIC, Social Security) and certain household expenses not counted in the official poverty measure. Between 2019 and 2021, about 12.2% of all Tennesseans had incomes under the official poverty measure. After considering the value of these benefits, Tennessee’s supplemental poverty measure rate fell to 9.1%. In other words, these programs lifted about 214,000 Tennesseans out of poverty during that period. (3)
Considerations and Parting Words
Although our findings leave much to be studied, they support the idea of exploring and monitoring two key levers to improve outcomes for low-income children.
- Finding ways to encourage relationship-building across class lines may help promote better outcomes for low-income children. Existing research on the topic has had mixed results.(35) Observational studies similar to this report have found strong associations between social capital and student test performance, but interventions to increase social capital among students have found limited evidence of impact on student test performance. (36) Nevertheless, fostering connections between high- and low-socioeconomic status individuals may generate opportunities, resources, and knowledge that help economically disadvantaged students succeed. Ideas to explore include more student collaboration in schools, mentor and networking opportunities among individuals with diverse backgrounds, and ways to foster more economically integrated communities. (37)
- Focused attention on places with higher concentrations of low-income students could produce better outcomes for all local students. Given the role that concentrated poverty appears to play in test performance — both for students who are economically disadvantaged and those who are not — policies focused on these areas might benefit all student groups in counties with high proportions of economically disadvantaged students. For example, Tennessee’s new school funding formula allocates additional money for economically disadvantaged students and counties with concentrated poverty. (34)
[1] We caution readers We caution readers not to mistake correlation with cause-and-effect. Correlation means that two factors move in the same or opposite directions at the same time. Causality means that changes in one factor led to changes in another. Establishing cause-and-effect requires more sophisticated research design — like statistical controls, experimental designs with random assignments or matching techniques, or longitudinal designs. Sometimes two data points may be correlated, but there is another factor at play.
[2] Highest child poverty counties were the 20 counties with the highest 2016-2020 child poverty rates. Lowest were the 20 with the lowest rates.
[3] Economically disadvantaged students are defined as those eligible to receive free or reduced-price school meals, as well as students who are migrants, experiencing homelessness, or in the foster care system. (34)
*This paper was updated on April 13, 2023 to add supplementary references and greater clarity to the discussion of our findings.
**This paper was updated on April 17, 2023 to correct a mistake in the key in Figure 1.
References
Click to Open/Close
- Duncan, Greg and Hoynes, Hilary. Reducing Child Poverty Can Promote Children’s Development and Productivity in Adulthood. Society for Research in Child Development, October 2, 2021. https://www.srcd.org/research/reducing-child-poverty-can-promote-childrens-development-and-productivity-adulthood
- Tennessee Commission on Children and Youth. Definitions and Sources. TCCY Kids Count Data Book. Accessed on October 19, 2022 from https://www.tn.gov/content/dam/tn/tccy/documents/kc/kc-soc16/Definition-Sources.pdf
- U.S. Census Bureau. Explore Census Data. 2022. https://data.census.gov/cedsci/
- Tennessee Department of Education. State-Level Assessment Files for 2017-2022. Accessed from https://www.tn.gov/education/data/data-downloads.html
- —. District-Level Assessment Files for 2017-2019. Accessed from https://www.tn.gov/education/data/data-downloads.html
- Fiester, Leila. Early Warning! Why Reading by the End of Third Grade Matters. Baltimore : Annie E. Casey Foundation, 2010. https://ed.psu.edu/sites/default/files/inline-files/Anne%20E%20Casey%202010%20Early%20Warning%20Special_Report_Executive_Summary.pdf
- Lesnick, Joy, Goerge, Robert and Smithgall, Cheryl. Third Grade Reading Level Predictive of Later Life Outcomes. Chapin Hall at the University of Chicago. 2010. https://www.chapinhall.org/research/third-grade-reading-level-predictive-of-later-life-outcomes/
- Sparks, Sarah. Study: Third Grade Reading Predicts Later High School Graduation. EdWeek. April 2011. https://www.edweek.org/teaching-learning/study-third-grade-reading-predicts-later-high-school-graduation/2011/04
- National Center for Education Statistics. Characteristics of Children’s Families. IES: NCES Annual Reports. May 2022. https://nces.ed.gov/programs/coe/indicator/cce/family-characteristics#suggested-citation
- Monserud, Maria A and Elder, Glen H. Household Structure and Children’s Educational Attainment: A Perspective on Coresidence with Grandparents. Journal of Marriage and Family, 2011, Vol. 73. PMC3887549. https://www.jstor.org/stable/41329643
- National Center for Education Statistics. The Condition of Education Spotlight: Risk Factors and Academic Outcomes in Kindergarten through Third Grade. U.S. Department of Education, National Center for Education Statistics, 2017. https://nces.ed.gov/blogs/nces/post/risk-factors-and-academic-outcomes-in-kindergarten-through-third-grade
- Holloway, John. Research Link – How the Community Influences Achievement. The Association for Supervision and Curriculum Development (ACSD). May 1, 2004. https://www.ascd.org/el/articles/-how-the-community-influences-achievement
- Mickelson, Roslyn Arlin. Is There Systematic Meaningful Evidence of School Poverty Thresholds? The National Coalition on School Diversity. September 2018. https://files.eric.ed.gov/fulltext/ED603709.pdf
- Darling-Hammond, Linda. Investing for Student Success: Lessons from State School Finance Reforms. Learning Policy Institute, 2019. https://learningpolicyinstitute.org/product/investing-student-success-school-finance-reforms-report
- Chetty, Raj, et al. Social Capital I: Measurement and Associations with Economic Mobility. Nature, 2022, Vol. 608. https://doi.org/10.1038/s41586-022-04996-4
- Chetty, Raj, et al. Social Capital II: Determinants of Economic Connectedness. Nature, 2022, Vol. 608. https://doi.org/10.1038/s41586-022-04997-3
- Acar, Erkan. Effects of Social Capital on Academic Success: A Narrative Synthesis. Education Research and Reviews, 2011, Vol. 6. ISSN 1990-3839. https://academicjournals.org/journal/ERR/article-full-text-pdf/8BD71B95320
- Tennessee Department of Education. Data Downloads & Requests. Accessed on October 1, 2022 from https://www.tn.gov/education/data/data-downloads.html
- Opportunity Insights. Data Library. Opportunity Insights. 2022. Accessed on July 1, 2022 from https://opportunityinsights.org/data/
- TennCare. Enrollment Data: February 2023. https://www.tn.gov/tenncare/information-statistics/enrollment-data.html
- Medicaid and CHIP Payment and Access Commission (MACPAC). EXHIBIT 21. Medicaid Spending by State, Eligibility Group, and Dually Eligible Status.December 2022. https://www.macpac.gov/publication/medicaid-benefit-spending-by-state-eligibility-group-and-dually-eligible-status/
- TennCare. This is TennCare. https://www.tn.gov/tenncare/this-is-tenncare.html
- Tennessee Department of Human Services. SNAP – Statistical Information: Jan 2023. https://www.tn.gov/humanservices/for-families/supplemental-nutrition-assistance-program-snap/snap-statistical-information.html
- U.S. Department of Agriculture, Food & Nutrition Service. State Level Annual Data. https://www.fns.usda.gov/pd/supplemental-nutrition-assistance-program-snap
- U.S. Internal Revenue Service. Statistics for Tax Returns with the Earned Income Tax Credit (EITC) – 2020 Tax Returns Processed in 2021 by State with EITC Claims. https://www.eitc.irs.gov/eitc-central/statistics-for-tax-returns-with-eitc/statistics-for-tax-returns-with-the-earned-income
- U.S. Department of Health & Human Services, Administration for Children & Families. Head Start Program Facts: Fiscal Year 2021. https://eclkc.ohs.acf.hhs.gov/about-us/article/head-start-program-facts-fiscal-year-2021
- U.S. Department of Health & Human Services, Office of Child Care. FFY 2020 CCDF data tables [Preliminary estimates].Table 1 Average Monthly Adjusted Number of Families and Children Served. Child Care Technical Assistance Network. https://childcareta.acf.hhs.gov/data
- U.S. Department of Health & Human Services, Administration for Children & Famlies. FY 2020 CCDF State Expenditure Data (direct service expenditures only). https://www.acf.hhs.gov/occ/data/fy-2020-ccdf-state-expenditure-data
- U.S. Department of Agriculture, Food & Nutrition Services. WIC – Monthly Data – State Level Participation by Category and Program Costs. https://www.fns.usda.gov/pd/wic-program
- U.S. Department of Agriculture, Food & Nutrition Service. WIC Program Grant Levels by Fiscal Year: FY 2022. https://www.fns.usda.gov/wic/wic-program-grant-levels-fy
- —. About WIC: WIC’s Mission. [Online] https://www.fns.usda.gov/wic/about-wic-wics-mission
- Tennessee Department of Human Services. Families First – Statistical Information: Sep 2022. https://www.tn.gov/humanservices/for-families/families-first-tanf.html
- U.S. Department of Health & Human Services, Administration for Children & Family. TANF Financial Data – FY 2020. https://www.acf.hhs.gov/ofa/data/tanf-financial-data-fy-2020
- Tennessee Department of Human Services. Families First. https://www.tn.gov/humanservices/for-families/families-first-tanf.html
- Sun, Yongmin. The Contextual Effects of Community Social Capital on Academic Performance. Social Science Research, 2002, Vol. 28. https://doi.org/10.1006/ssre.1999.0661
- Gamoran, Adam, et al. Social Capital and Student Achievement: An Intervention-Based Test of Theory. Sociology of Education, 2021, Vol. 94. https://doi.org/10.1177/00380407211040261
- Reeves, Richard V and Deng, Beyond. Who You Know: Relationships, Networks and Social Capital in Boosting Educational Opportunity for Young Americans. The Brookings Institution. May 26, 2022. https://www.brookings.edu/research/who-you-know-relationships-networks-and-social-capital-in-boosting-educational-opportunity-for-young-americans/
- Tennessee Department of Education. Rules of The Tennessee Department of Education. https://www.tn.gov/content/dam/tn/education/legal/TISA_Rules_Final_Draft-6-6-2022.pdf
- University of Wisconsin Population Health Institute. 2022 Measures. County Health Rankings & Roadmaps: Building a Culture of Health, County by County. 2022. https://www.countyhealthrankings.org/explore-health-rankings/county-health-rankings-measures