Key Takeaways
- Tennessee saw continued rising incomes while poverty rates held steady in 2022.
- Median household incomes trended upward over the last decade for black, white, and Hispanic Tennesseans, but differences in their purchasing power also grew.
- Racial and ethnic differences in the poverty rate varied over the last decade but ultimately shrank.
The U.S. Census Bureau released new data in September 2023 on income, poverty, education, and health insurance coverage in 2022. These metrics paint a picture of the social and economic circumstances across America. Here’s what stands out from the 2022 income and poverty estimates in Tennessee.[1]
Income and Poverty in Tennessee
Tennessee saw continued increases in income in 2022 while poverty rates held steady. Median household income in the state reached $65,200 last year, meaning half of households had less income and half had more (Figure 1). (1) After adjusting for inflation, however, the differences in 2021 and 2022 income estimates were not statistically significant due to the margins of error (Figure 2). (2) (1) Meanwhile, official poverty rates held relatively steady at 13.3% among all Tennesseans — compared to 13.6% in 2021 — and 17.6% among children — compared to 18.1% the prior year (Figure 3). (1) These trends unfolded as earnings grew at every level of education over the last decade — especially among Tennesseans with the least education. See Table A1 in the Appendix for the 2021–2022 data.
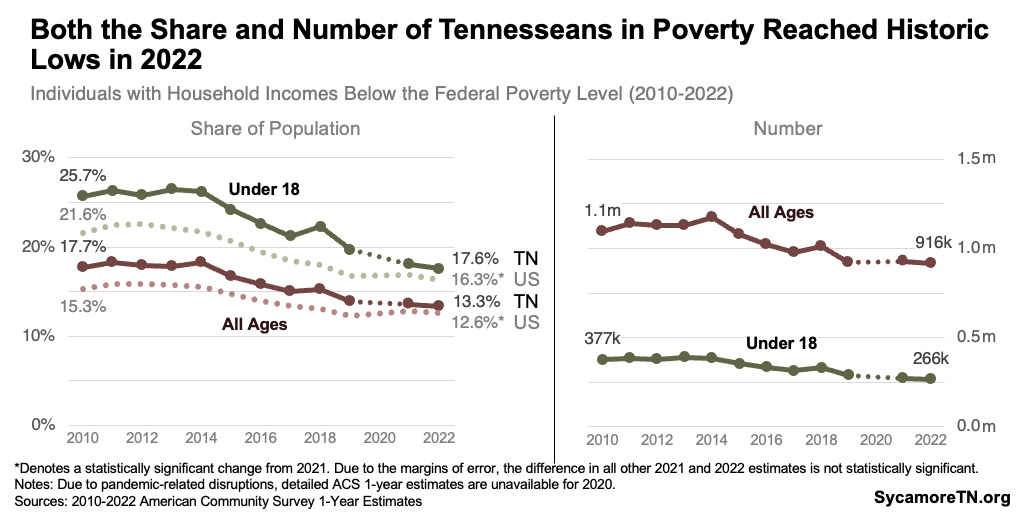
Tennessee has higher poverty rates and lower income levels than the U.S., but those gaps narrowed over the last decade. In 2010, the official poverty rate was 2.4 percentage points higher in Tennessee than nationwide, and the child poverty rate was 4.1 points higher. By 2022, those gaps had narrowed to 0.7 and 1.3 points, respectively (Figure 4). Meanwhile, our median household income remained about $10,000 lower than the national amounts throughout 2010-2022, after adjusting for inflation.
Figure 1
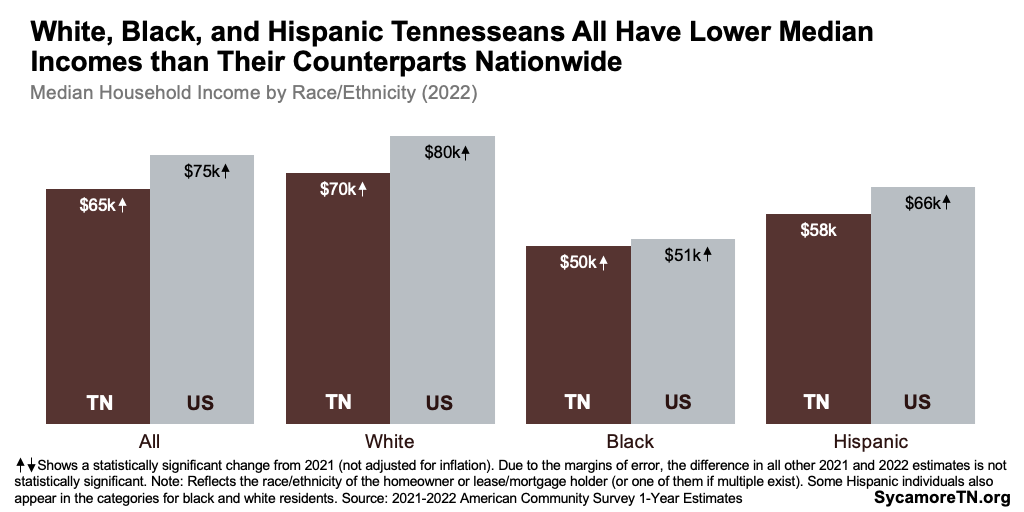
Figure 2
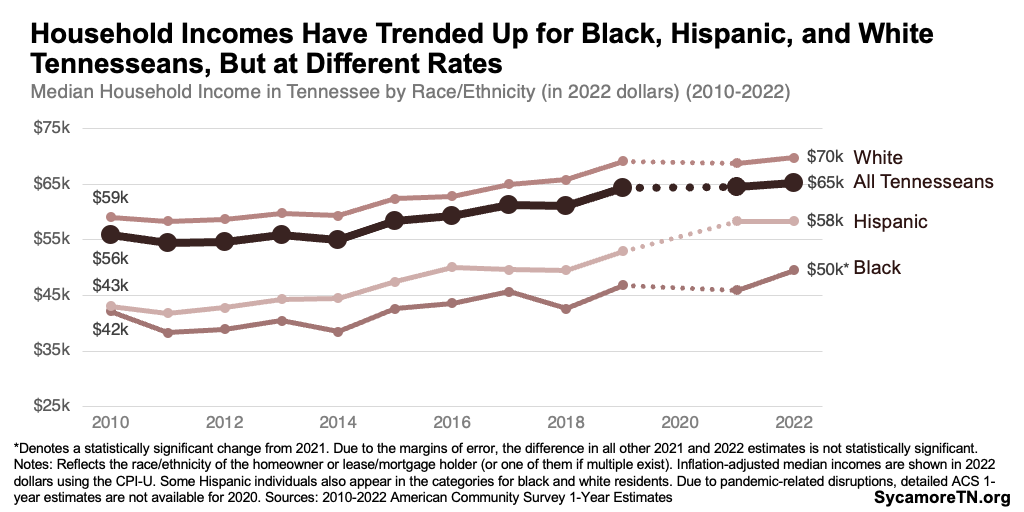
Figure 3
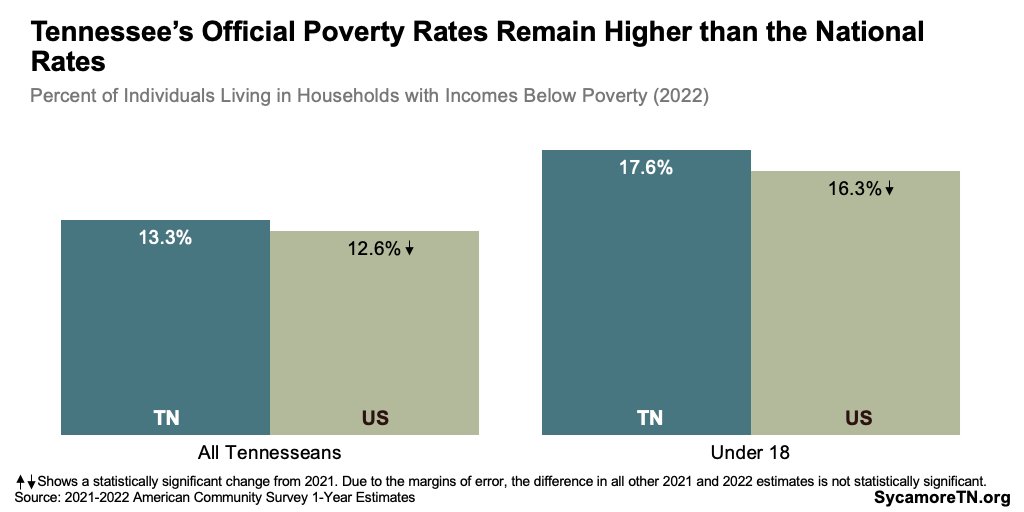
Figure 4
Demographic Variation
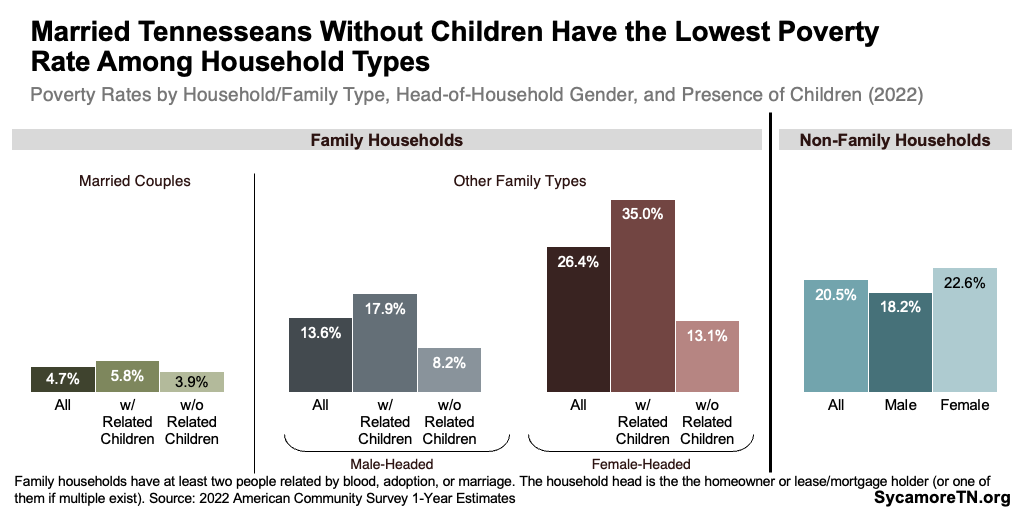
Tennessee’s poverty rate and median income vary across race, ethnicity, education level, employment, and household type. In 2022, black Tennesseans, adults without a high school diploma, and unemployed adults had the highest poverty rates, while white residents, college graduates, and full-time workers had the lowest (Figure 5). In terms of household type, poverty rates were lowest for married couples without children and highest for female-headed, non-married households with children. (Figure 6). (1)
Figure 5
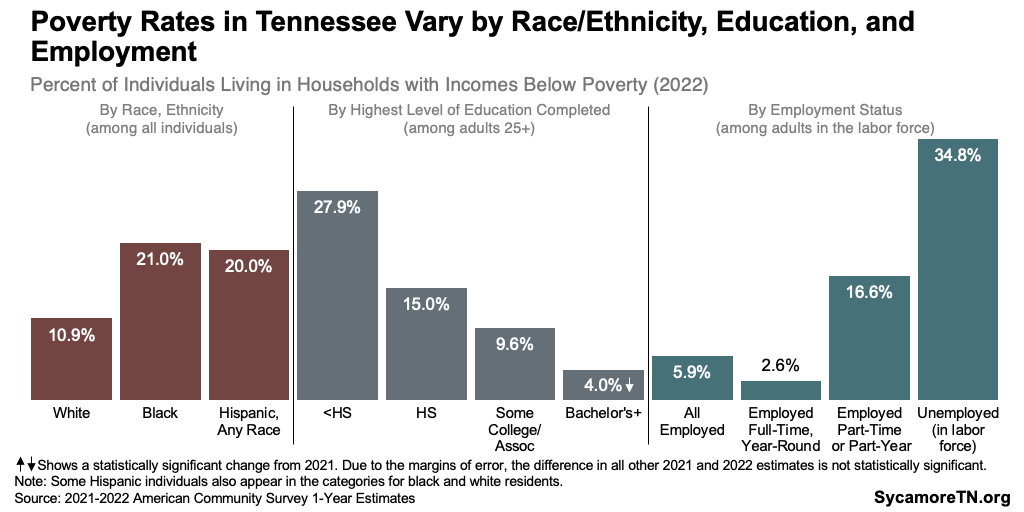
Figure 6
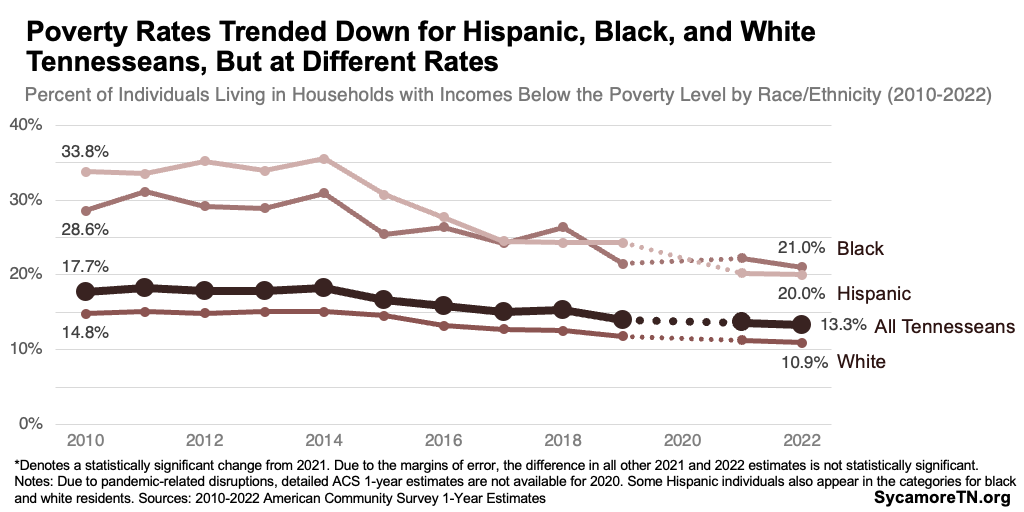
Racial and ethnic differences in the poverty rate varied over the last decade but ultimately shrank (Figure 7). (1) In 2010, the poverty rate among Hispanic Tennesseans was 19 percentage points higher than for whites and 5 points higher than that of black residents. By 2022, the rate among Hispanic Tennesseans was 9 points higher than for white Tennesseans and 1 point lower than that of black residents. Meanwhile, the gap between black and white Tennesseans shrank from 14 points to 10. The poverty rate for all three groups peaked in 2014. Since then, black Tennesseans experienced the largest drop in the number of people under poverty — 32% or about 105,000 people. White Tennesseans saw about a 26% drop (198,000) and Hispanics a 22% drop (25,000).
Median household incomes trended upward over the last decade for black, white, and Hispanic Tennesseans, but differences in their purchasing power also grew (Figure 2). (1) (2) Adjusted for inflation, Tennesseans’ median household income grew most quickly over the last decade among Hispanics (up 35%). Both white and black Tennesseans’ incomes were up by about 18%. In dollar terms, the difference between white and Hispanic incomes shrank by nearly $4,500, while the gap between white and black incomes grew by $3,400.
Figure 7
Geographic Variation
Income and poverty rates vary by geography in Tennessee. The Census Bureau’s September 2023 data release includes 2022 estimates for counties with populations above 65,000. Among the 21 Tennessee counties with available data (1):
- Median Household Income — Median household income ranged from over $129,000 in Williamson County to about $49,900 in Greene County (Figure 8). Ten counties experienced a statistically significant increase between 2021 and 2022 (not accounting for inflation). Due to the margins of error, the changes for the other 11 counties are not statistically significant.
- Poverty Rate — The official poverty rate varied from 3.8% in Williamson County to 22.5% in Putnam County (Figure 9). From 2021 to 2022, statistically significant changes occurred in Greene (up 9 points) and Putnam (up 10 points) Counties.
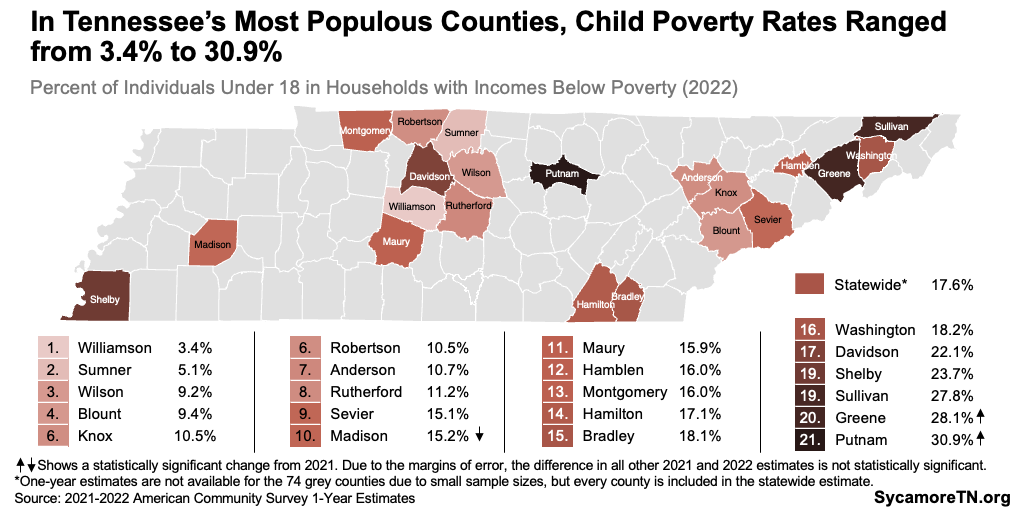
- Child Poverty — Meanwhile, the poverty rate among residents younger than 18 ranged from 3.4% in Williamson County to 30.9% in Putnam County (Figure 10). Statistically significant changes occurred in Greene (up 20 points), Madison (down 12 points), and Putnam (up 16 points) Counties.
See Table A1 in the Appendix for county-specific data for 2021-2022.
Figure 8
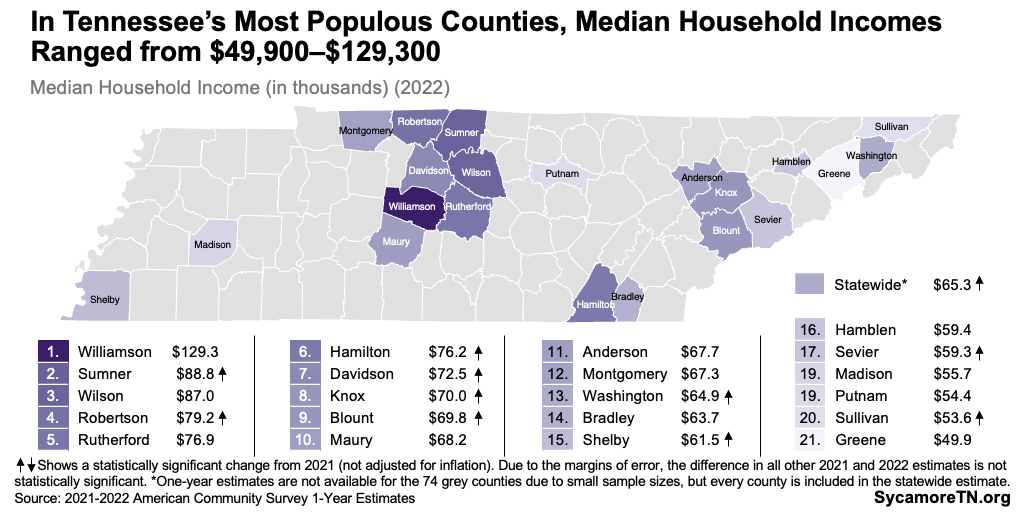
Figure 9
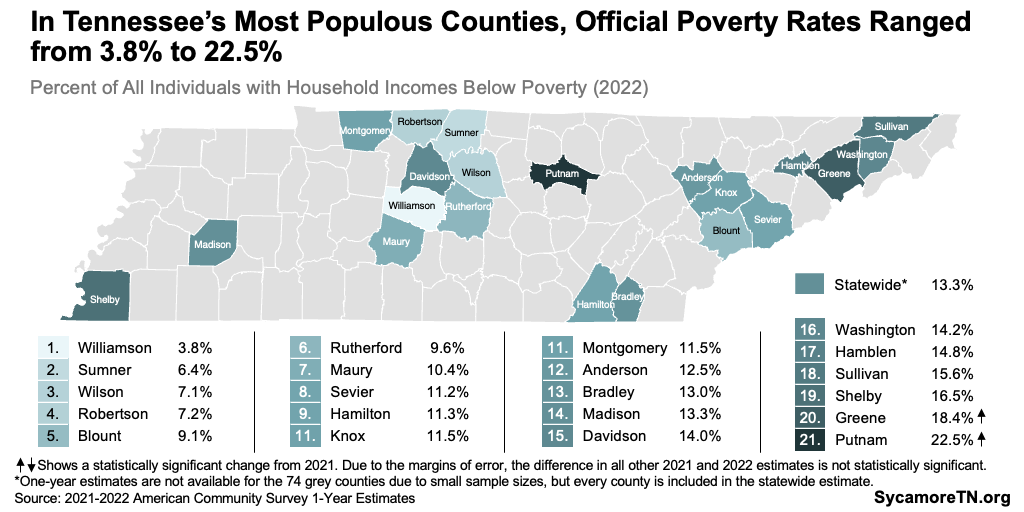
Figure 10
[1] Due to the margins of error, the difference in some 2021 and 2022 estimates is not statistically significant. The Census Bureau’s American Community Survey generates estimates based on a sample of the total population. The margin of error measures the likely range of the true value if every person were surveyed. When the error margins for two values overlap, the difference may simply be due to sampling or estimation issues. To learn more about the importance of samples, read our tips for interpreting statistics
References
Click to Open/Close
- U.S. Census Bureau. 2010-2022 American Community Survey 1-Year Estimates. [Online] September 2023. Available via http://data.census.gov.
- U.S. Bureau of Labor Statistics. Consumer Price Index: CPI-U. [Online] Accessed from https://www.bls.gov.