We measure poverty to gain insights into how many people do not have the economic resources to meet their basic needs. While the official poverty measure (OPM) is widely seen as outdated and imperfect, it remains more commonly used than existing alternatives. Other metrics, such as the supplemental poverty measure (SPM), usually include a broader set of economic resources but are not routinely reported in a way that allows for meaningful analysis at the state-level.
Key Takeaways
- Poverty rates estimate the share of people with economic resources below certain thresholds for meeting basic needs. The official poverty measure is widely seen as flawed but is the most often used.
- In Tennessee, the official poverty measure is above the national average while the supplemental poverty measure is below the national average. Both rates have trended downward in recent years.
- Poverty data offer standard metrics of how many people may find it hard to meet their needs across time periods, areas, and demographics. However, topline rates can obscure disparities among groups.
- The official poverty rate doesn’t count some resources that may help a family meet basic needs and doesn’t necessarily reflect those needs’ current costs or how they vary across and within states.
This is part of our series on the pros and cons of five common ways to measure prosperity and economic growth in Tennessee.
What is the Poverty Rate?
The most widely used poverty rate is the official poverty measure. It estimates the share of people with incomes below a defined amount — known as the poverty threshold. The U.S. Census Bureau has 48 different poverty thresholds based on family size and the age of family members. The OPM defines income as cash income only, such as wages, certain government benefits (e.g. Social Security, Temporary Assistance for Needy Families), child support, pensions and 401(k)s, and interest. (1)
The dollar value of the official poverty threshold was first developed in the 1960s based on the U.S. Department of Agriculture’s (USDA) estimates of the cost of an “economy food plan” and the share of income families spent on food. (2) If families’ resources were less than three times the cost of USDA’s estimate of the lowest-cost, minimally-adequate food budget, it was assumed their resources were inadequate to meet their basic needs. (3) The poverty threshold is updated annually for inflation (i.e. overall change in prices).
The supplemental poverty measure was first developed by the Census Bureau in 2011 to address some key concerns with the OPM (see Limitations of the Measures). It differs in a number of ways from the OPM (Table 1). (4) (5) For example, in addition to the sources of income outlined above, the SPM also counts non-cash benefits like the Supplemental Nutrition Assistance Program and tax benefits like the Earned Income Tax Credit.
Table 1
Alternatives for Measuring Poverty: Official v. Supplemental Poverty Measures
Alternatives for Measuring Poverty: Official v. Supplemental Poverty Measures
| What determines the poverty threshold? | Three times the cost of the USDA’s “economy food plan” in 1963, adjusted for inflation | Based on expenditure data for food, clothing, shelter, and utilities over the most recent 5 years |
| What counts as income? | Cash income before taxes | Cash income, the value of certain non-cash government benefits, and refundable tax credits minus taxes, medical spending, and work expenses |
| What is the measurement unit | Families | All individuals who live at the same address |
| What kinds of adjustments are accounted for? | Varies based on family size, the number of adults and children, and the age of the family head | Varies by household size, the number of adults and children, and differences in housing costs by geographic area and owner v. renter |
Poverty in Tennessee
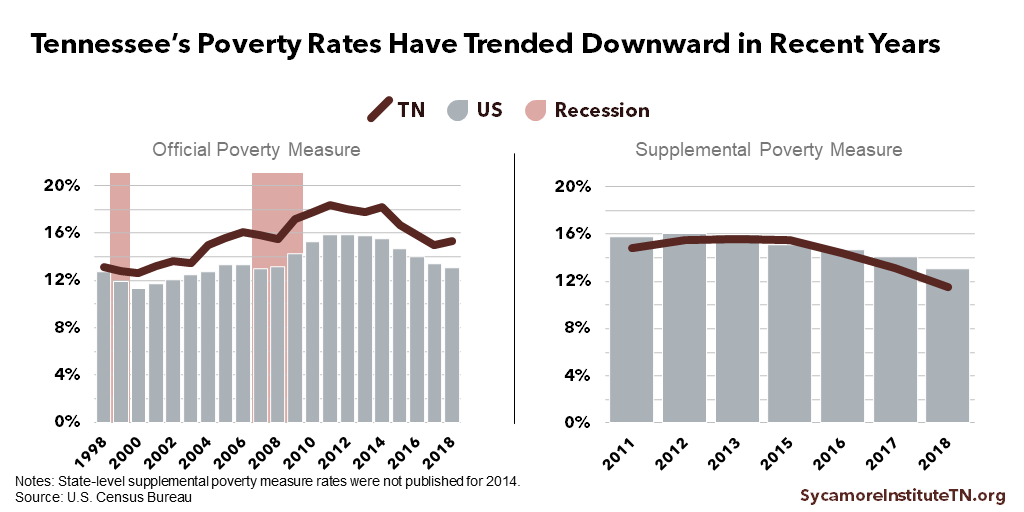
Tennessee’s OPM is above the national average while its SPM is below the national average, but both rates have trended downward in recent years (Figure 1).
- According to the official poverty measure, an estimated 15.3% of Tennesseans lived below the poverty level in 2018, higher than the national rate of 13.1% This current rate is lower than the historic high of 18.4% in 2014 but up slightly from 2017, when it was at a 13-year low. (7)
- According to the supplemental poverty measure, an estimated 11.5% of Tennesseans lived below poverty over the course of 2016-2018, lower than the national rate of 13.1%. That rate is the lowest since the Census began reporting the measure in 2011.(8)
The difference in Tennessee’s poverty rates under the two levels compared with the national rates likely reflects Tennesseans’ relatively higher reliance on government programs and the state’s relatively lower housing costs. (4)
Figure 1
Trade-Offs of Using Poverty to Measure Prosperity
Advantages of the Measures
There are several ways in which poverty rates are useful metrics for tracking and describing economic hardship. (9)
- While topline numbers obscure disparities among groups, the data underlying the OPM offer a standard way to measure and compare progress across time, areas, populations, and demographics. OPM data are reported on an annual basis and at different geographic (national, state, county) and demographic (age, sex, race/ethnicity, education) levels.
- Poverty rates provide insight into how many people may face issues meeting their basic needs and the effectiveness of anti-poverty programs and interventions. When the OPM was developed in the 1960s, there was very little official data on the ability of families’ to meet basic needs. While both metrics have weaknesses, they do appear to illuminate major trends with relative accuracy, such as improvements in the economic well-being of the elderly over the last century.
- The poverty rate provides a standardized tool to distribute federal dollars and determine eligibility for public assistance. For example:
- Poverty rates are often used to determine how federal dollars will be distributed to states and localities. Often times, states with higher poverty rates will receive more federal dollars for anti-poverty programs.
- A simplified version of the poverty thresholds are used to define and determine eligibility for hundreds of billions of dollars in government programs — including Medicaid (known as TennCare in Tennessee), the Supplemental Nutrition Assistance Program (SNAP, often called food stamps), Head Start, and the National School Lunch Program, among others.(10)
Limitations of the Measures
Every method of calculating poverty has limitations that affect its ability to comprehensively indicate the level of economic hardship in Tennessee (2) (9) (11) (12):
- The formula for calculating the OPM does not account for how the cost-of-living has changed since the 1960s or how it varies across the country.
- The underlying poverty thresholds were developed in the 1960s and have not been updated to reflect changes in household budgets. For example, families typically spend less today on food and more on other basic needs like child care and health care. As a result, some people and families may have incomes above the poverty threshold but are still unable to meet their basic needs.
- The poverty rate does not consider geographic differences in the cost of living across states or between urban and rural areas. Tennessee has the same poverty threshold as California, which has a much higher cost of living.
- Both measures exclude resources that may allow a family to meet basic needs. Because of this, some individuals and families may have incomes below the poverty line but are still able to meet their needs.
- The OPM only counts cash income and benefits but does not include non-cash forms of government assistance, like SNAP, Medicaid, and housing assistance. As a result, the OPM does not provide insights into the effectiveness of these types of public programs in reducing poverty.
- The SPM accounts for some, but not all, non-cash forms of government assistance. For example, the SPM does not include the value of Medicaid.
- Neither the OPM nor the SPM count other resources like assets (i.e. a home), savings, credit, ability to barter, or family support.
- While the SPM addresses many of the OPM’s weaknesses, it is not routinely reported in a way that allows for meaningful analysis. The Census annually reports overall state-level SPM estimates, but does not, for example, report state-level data across different demographic characteristics like age, sex, race/ethnicity, and education levels. This limits its usefulness for comparing progress over time across different populations and demographics.
References
Click to Open/Close
- U.S. Census Bureau. How the Census Bureau Measures Poverty. [Online] August 27, 2019. [Cited: November 1, 2019.] https://www.census.gov/topics/income-poverty/poverty/guidance/poverty-measures.html.
- National Academy of Sciences. Measuring Poverty: A New Approach. [Online] 1995. https://www.nap.edu/catalog/4759/measuring-poverty-a-new-approach.
- Fisher, Gordon M. The Development and History of the U.S. Poverty Thresholds – A Brief Overview. U.S. Department of Health and Human Services (HHS). [Online] January 1, 1997. https://aspe.hhs.gov/history-poverty-thresholds.
- Fox, Liana. The Supplemental Poverty Measure: 2018. U.S. Census Bureau. [Online] October 2019. https://www.census.gov/content/dam/Census/library/publications/2019/demo/p60-268.pdf.
- Bridges, Benjamin and Gesumaria, Robert V. The Supplemental Poverty Measure (SPM) and Children: How and Why the SPM and Official Poverty Estimates Differ. U.S. Social Security Administration. [Online] 2015. https://www.ssa.gov/policy/docs/ssb/v75n3/v75n3p55.html.
- U.S. Census Bureau. Small Area Income and Poverty Estimates (SAIPE). [Online] [Cited: November 1, 2019.] https://www.census.gov/data-tools/demo/saipe/#/?map_geoSelector=aa_c.
- —. Poverty Status in the Past 12 Months (S1701). American Community Survey 1-Year Estimates. [Online] September 2019. [Cited: October 25, 2019.] Accessed via http://www.data.census.gov.
- —. The Supplemental Poverty Measure. [Online] 2010-2019. [Cited: November 1, 2019.] Accessed from https://www.census.gov/topics/income-poverty/supplemental-poverty-measure/library/publications.html.
- Besharov, Douglas J. and Germanis, Peter. Reconsidering the Federal Poverty Measure. University of Maryland School of Public Policy, Welfare Reform Academy. [Online] June 14, 2004. http://www.welfareacademy.org/pubs/poverty/povmeasure.description.pdf.
- Office of the Assistant Secretary for Planning and Evaluation (ASPE). Frequently Asked Questions Related to the Poverty Guidelines and Poverty: What Programs Use the Poverty Guidelines? U.S. Department of Health and Human Services. [Online] [Cited: November 1, 2019.] https://aspe.hhs.gov/frequently-asked-questions-related-poverty-guidelines-and-poverty.
- Weidinger, Matt. The Government’s Official Poverty Data Miss an Increasing Share of Antipoverty Spending. American Enterprise Institute. [Online] September 2019. https://www.aei.org/wp-content/uploads/2019/09/The-Governments-Official-Poverty-Data.pdf.
- Matthews, Dylan. The Official Poverty Measure is Garbage. The Census Has Found a Better Way. Vox. [Online] September 12, 2017. https://www.vox.com/2015/9/16/9337041/supplemental-poverty-measure.