
The U.S. Census Bureau released new data in September on income, poverty, education, and health insurance coverage across the U.S. in 2018. Here are our top takeaways for Tennessee.
Key Takeaways
- Tennessee’s median household income continued to climb in 2018, but the state’s poverty rates increased after several years of decline.
- The recent upward trend in Tennesseans with post-secondary degrees slowed.
- Tennessee was one of nine states to see its uninsured rate grow in 2018 — the state’s second consecutive year of increases.
See the Regional Data section at the end to explore the data for 14 metropolitan and micropolitan statistical areas that include parts of Tennessee. County-level estimates for all of Tennessee will become available later this year.
Income and Poverty
Tennessee’s median household income continued to climb in 2018, but the state’s poverty rates increased after several years of decline. (1)
- Household Income: Tennessee’s median household income continued to increase — from about $51,000 in 2017 to more than $52,000 in 2018 (Figure 1). In other words, half of Tennessee households earned less than $52,375 in 2018, and half earned more.
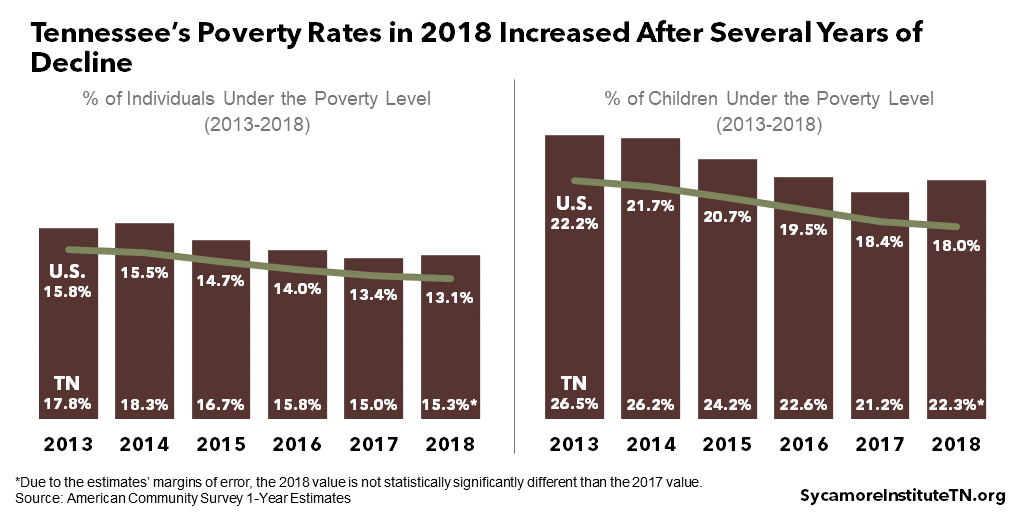
- Poverty: The proportion of people living under the federal poverty line increased from an estimated 15.0% in 2017 to 15.3% in 2018 (Figure 2).* In 2018, the poverty threshold for a family of three was about $20,000 per year. (2) While the official poverty measure is widely seen as imperfect, it also remains the most commonly used.
- Childhood Poverty: The proportion of Tennessee children living in families under the poverty line increased from an estimated 21.2% in 2017 to 22.3% in 2018 — the first increase since 2013 (Figure 2).*
Figure 1
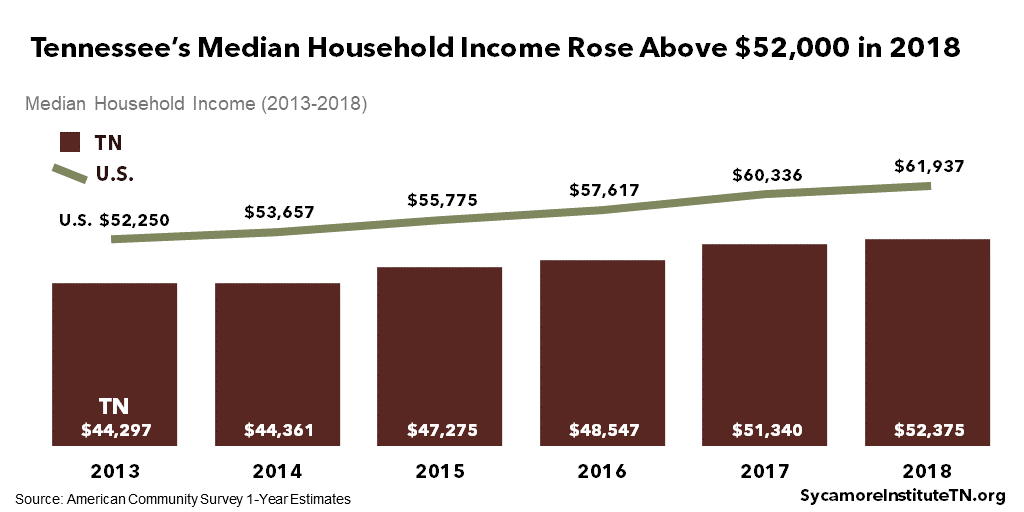
Figure 2
Education
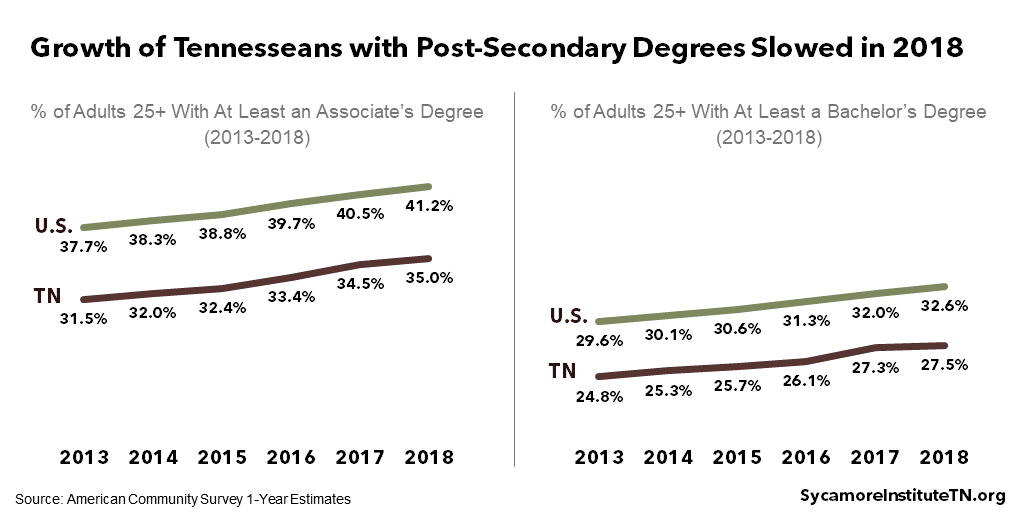
The recent upward trend in Tennesseans with post-secondary degrees slowed in 2018. (1)
- Associate’s Degree or More: The share of Tennesseans 25 and older with at least an associate’s degree grew from an estimated 34.5% in 2017 to 35.0% in 2018 (Figure 3).*
- Bachelor’s Degree or More: The share of Tennesseans 25 and older with at least a bachelor’s degree rose from an estimated 27.3% in 2017 to 27.5% in 2018 (Figure 3).*
Figure 3
Health Insurance Coverage
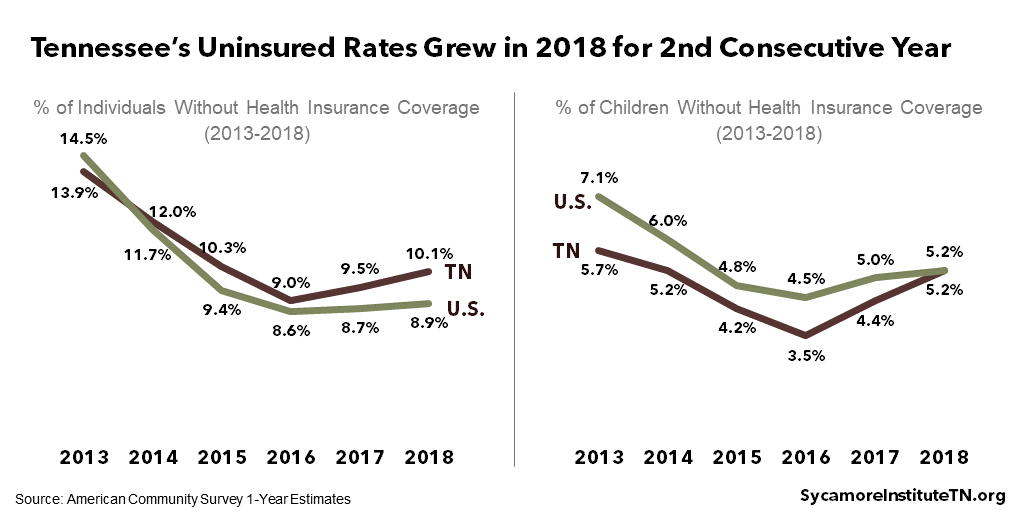
Tennessee was one of nine states to see its uninsured rate grow in 2018 — the state’s second consecutive year of increases. (3) (1)
- Overall Uninsured Rate: The share of Tennesseans without health insurance rose from an estimated 9.5% in 2017 to 10.1% in 2018 (Figure 4).
- Uninsured Tennessee Children: The percent of Tennessee children without health insurance increased from an estimated 4.4% in 2017 to 5.2% in 2018 (Figure 4).
- Uninsured <138% FPL: In 2018, there were an estimated 229,959 uninsured Tennesseans ages 18-65 with incomes under 138% of the federal poverty level.
Figure 4
* Due to the estimates’ margins of error, the 2018 value is not statistically significantly different than the 2017 value. The Census’ American Community Survey generates estimates based on a survey of a subset of people. The margin of error measures the range in which the true value likely occurs if every person were to be surveyed. When two values are within one another’s’ margins of error, it is possible the difference may be due to issues with sampling and estimating rather than true differences in the full population.
Regional Data
The U.S. Census Bureau’s September data release also includes 2018 estimates for select metropolitan and micropolitan statistical areas that include areas of Tennessee. These regions represent population centers and their surrounding areas, and they sometimes cross state lines (4) A map of Tennessee’s metro and micro areas can be viewed here. Later in the year, the Census will release county-level estimates using five years of data (2014-2018).
Explore Regional Data
Use the interactive tool below to explore the data by each of the 14 regions. The data are also available in Table 1.
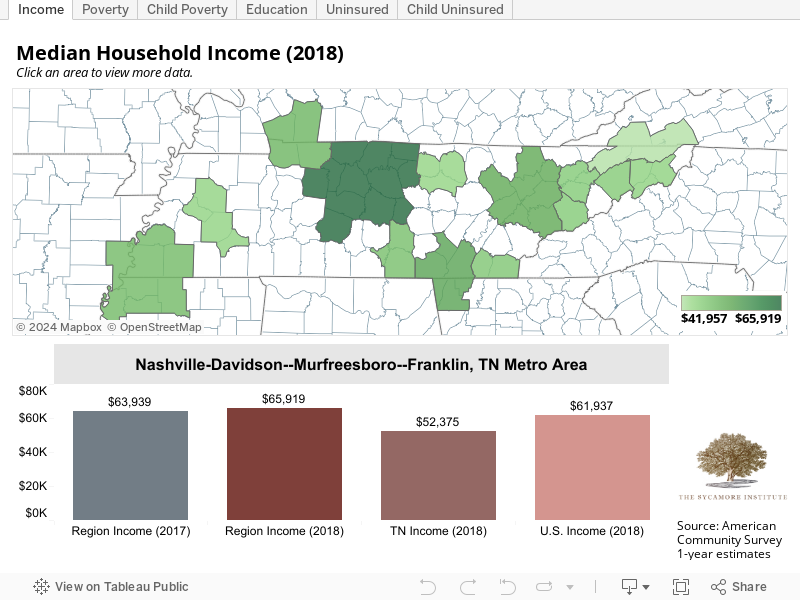
Table 1
Income, Poverty, Education, and Health Insurance Coverage in and Across Tennessee in 2018
Income, Poverty, Education, and Health Insurance Coverage in and Across Tennessee in 2018
| United States | $60,336 | $61,937 | 13.4% | 13.1% | 18.4% | 18.0% | 32.0% | 32.6% | 8.7% | 8.9% | 5.0% | 5.2% |
| Tennessee | $51,340 | $52,375 | 15.0% | 15.3%* | 21.2% | 22.3%* | 27.3% | 27.5%* | 9.5% | 10.1% | 4.4% | 5.2% |
| Chattanooga, TN-GA Metro Area | $50,250 | $54,732* | 12.5% | 12.7%* | 17.1% | 17.4%* | 27.2% | 26.6%* | 9.7% | 10.6%* | 6.4% | 3.9% |
| Clarksville, TN-KY Metro Area | $5,4667 | $51,280* | 14.9% | 13.5%* | 19.6% | 18.7%* | 24.5% | 27.7% | 8.3% | 7.0%* | 5.7% | 4.2%* |
| Cleveland, TN Metro Area | $46,822 | $48,101* | 17.9% | 15.1%* | 22.3% | 24.0%* | 20.5% | 18.9%* | 11.2% | 13.1%* | 3.4% | 6.7%* |
| Cookeville, TN Micro Area | $38,421 | $45,179 | 20.1% | 13.2% | 30.7% | 11.4% | 19.0% | 21.9% | 8.5% | 7.6%* | 1.5% | 6.3% |
| Greeneville, TN Micro Area | $37,920 | $47,383 | 19.0% | 13.6%* | 27.4% | 24.5%* | 14.2% | 17.9%* | 8.8% | 11.0%* | 1.3% | 7.7%* |
| Jackson, TN Metro Area | $43,570 | $45,610* | 17.8% | 18.5%* | 24.4% | 31.4%* | 23.4% | 22.8%* | 9.7% | 11.4%* | 4.8% | 7.1%* |
| Johnson City, TN Metro Area | $40,663 | $45,839 | 17.0% | 16.1%* | 21.9% | 21.5%* | 26.7% | 27.5%* | 10.0% | 8.6%* | 4.9% | 3.6%* |
| Kingsport-Bristol-Bristol, TN-VA Metro Area | $43,516 | $41,957* | 15.3% | 17.5%* | 24.0% | 29.1%* | 20.5% | 21.2%* | 7.7% | 9.9% | 2.8% | 3.1%* |
| Knoxville, TN Metro Area | $51,848 | $53,523* | 14.3% | 13.5%* | 19.7% | 15.7% | 28.8% | 28.7%* | 8.4% | 8.8%* | 2.7% | 3.0%* |
| Memphis, TN-MS-AR Metro Area | $50,984 | $50,338* | 17.1% | 18.8% | 27.1% | 29.3%* | 27.8% | 28.5%* | 9.8% | 12.0% | 4.1% | 6.3% |
| Morristown, TN Metro Area | $44,840 | $47,439* | 14.6% | 15.4%* | 23.5% | 23.0%* | 14.9% | 17.1%* | 9.8% | 10.2%* | 1.6% | 2.7%* |
| Nashville-Davidson--Murfreesboro--Franklin, TN Metro Area | $63,939 | $65,919 | 10.9% | 11.6%* | 15.1% | 16.5%* | 36.0% | 35.9%* | 9.5% | 9.7%* | 5.5% | 5.5%* |
| Sevierville, TN Micro Area | $49,963 | $47,411* | 11.8% | 14.7%* | 15.1% | 26.3% | 16.4% | 14.8%* | 16.2% | 16.0%* | 4.7% | 6.4%* |
| Tullahoma-Manchester, TN Micro Area | $48,256 | $49,370* | 15.1% | 16.8%* | 16.7% | 27.9% | 22.3% | 19.1%* | 8.5% | 8.3%* | 2.2% | 5.2% |
Child Poverty = the percent of children living under the federal poverty threshold
Bachelor’s or More = the percent of adults ages 25+ with at least a bachelor’s degree
Source: American Community Survey 1-Year Estimates (1)
* This post was updated on 10/14/2019 to correct the number of uninsured individuals 18-64 <138% FPL. The previous version reported uninsured individuals of all ages <138% FPL.
References
Click to Open/Close
- U.S. Census Bureau. American Community Survey 1-Year Estimates for 2013-2018. [Online] 2014-2019. [Cited: September 26, 2019.] Accessed from http://data.census.gov.
- —. Poverty Thresholds by Size of Family and Number of Children: 2018. [Online] August 28, 2019. [Cited: September 27, 2019.] https://www.census.gov/data/tables/time-series/demo/income-poverty/historical-poverty-thresholds.html.
- Berchick, Edward R., Barnett, Jessica C. and Upton, Rachel D. Health Insurance Coverage in the United States: 2018. U.S. Census Bureau. [Online] September 10, 2019. https://www.census.gov/content/dam/Census/library/publications/2019/demo/p60-267.pdf.
- U.S. Census Bureau. Geographic Terms and Concepts – Core Based Statistical Areas and Related Statistical Areas. [Online] https://www.census.gov/geo/reference/gtc/gtc_cbsa.html#mesa.


