Nutrition plays an important role in the health and well-being of Tennesseans. One of the primary government programs focused on nutrition is the Supplemental Nutrition Assistance Program (SNAP). This policy primer explains SNAP, its history and goals, historical funding levels for Tennessee and its role in the state budget, and research about its effectiveness.
What Is SNAP?
First rolled out in 1962, SNAP (formerly known as food stamps) is a federal program run by the U.S. Department of Agriculture (USDA). (1) SNAP is an entitlement program that aims to help low-income households have food security and a nutritious diet. (2) Because SNAP is an entitlement, all individuals that meet the income requirements are eligible to receive benefits. The USDA sets eligibility criteria, and states are responsible for determining individuals’ eligibility and issuing monthly benefits
In March 2017, the program served about 44 million people in the U.S. including over 1 million Tennesseans. (3) Households receive a monthly benefit allotment in the form of an electronic debit card, also known as an electronic benefit transfer (EBT). Recipients cannot use SNAP to buy alcohol, tobacco, vitamins, medicines, hot foods, foods that will be eaten in the store, or non-food items (i.e. soap, paper products, household supplies, and pet food). (4)
In addition to receiving a debit card to purchase food, SNAP participants also have access to a federal nutrition education program called SNAP-Ed. States have the option to provide additional nutrition education to SNAP recipients. (5) The Tennessee Department of Human Services contracts with the University of Tennessee Agricultural Extension Service and Tennessee State University Cooperative Extension to provide these educational resources in all 95 counties in Tennessee. These agencies provide classroom instruction, demonstrations, and publications about health-related diets, food preparation, cost-effective food shopping, and personal cleanliness. (6)
SNAP Funding
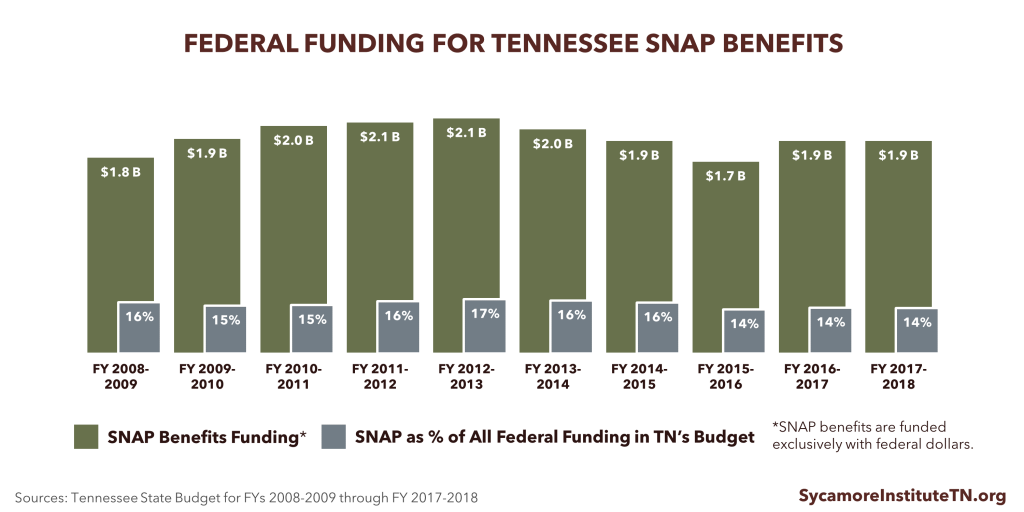
SNAP benefits are fully funded by the federal government, while the administrative costs are shared with states. Federal SNAP funds flow through and are accounted for in state budgets. Tennessee receives around $1.9 billion in federal funding per year for SNAP benefits, which amounts to about 14% of all federal revenues in the state budget (Figure 1).
President Trump’s federal budget proposal for federal FY 2018 proposes reforms to SNAP — including funding reductions and a new state match for SNAP benefits that would be phased in and vary by state. (6) The following examples illustrate the potential state budget implications of this proposal. If states were required to cover 10% of the cost of SNAP benefits, Tennessee would have to contribute $191 million in state revenues to maintain current funding levels. This would represent a 1% increase in overall state revenue spending based on state FY 2017-2018 estimates. A hypothetical 25% match would amount to $477 million, which would be a 3% increase in spending from state revenues.
Like many entitlement programs targeted at low-income individuals, SNAP is considered counter-cyclical meaning enrollment and program expenditures increase during economic downturns. Because of this trend, the American Recovery and Reinvestment Act of 2009 (ARRA) increased SNAP funding for states in the midst of the Great Recession — including a temporary 15% increase in SNAP benefits that ended in 2013. (7) Tennessee received over $470 million in additional funding for SNAP under the ARRA. (8)
Figure 1
Who Is Eligible for SNAP?
SNAP is an entitlement program, meaning anyone who meets the eligibility criteria will receive benefits. Eligibility criteria are set at the federal level. Households must meet resource and income tests to be eligible for SNAP.
- Income Limits – Most households have to meet 2 income tests — one that counts gross monthly income and another that counts net monthly income. A household’s qross monthly income must be at or below 130% of poverty (i.e. $2,633 for a family of 4), and their net monthly income must be at or below 100% of poverty (i.e. $2,025 for a family of 4). Gross income includes income from all sources (i.e. wages, cash assistance, Social Security, unemployment, and child support) before any deductions. Things like child support payments and a portion of earned income (i.e. work) are deducted to arrive at the household’s net income. (9)
- Resource Limits – The assets limit is $2,250 for most households. Assets include things like cash on hand, money in checking and savings accounts and stocks, and the value of property.(9)
- Special Rules –Special rules apply for elderly people (60 years of age or older) and people with disabilities. For example, a household with an elderly or disabled person does not have to pass the gross income test. (10)
- Work Requirements — Able-bodied individuals 16-59 years old must register for work, participate in employment & training programs, accept employment offers, and cannot quit a job. Able-bodied adults without dependents must work or participate in a work program for at least 20 hours per week to receive SNAP benefits for more than 3 months in a 3-year period. (10)
Undocumented immigrants, strikers, and felons convicted of certain drug-related offenses are not eligible for SNAP. College students are only eligible if they work at least 20 hours per week, care for dependents, enroll in work-study, or receive Families First (the Temporary Assistance for Needy Families program in Tennessee). States can modify some limited aspects of the program (e.g. how to count the value of vehicles).
How Much Do Households Receive?
A federal formula uses household size, family income, and a maximum potential allotment to calculate each eligible family’s SNAP benefit. The same formula applies in every state.
SNAP maximum allotments are based on the Thrifty Food Plan (TFP) the USDA’s market-based, national standard for a low-cost nutritious diet. The SNAP maximum allotments vary by household size but do not account for geographic variation in food prices across the 48 contiguous states. Households with more than 4 people are eligible for slightly less per person than households with 4 or fewer people (Table 1). (11)
Table 1. Maximum Monthly SNAP Allotment (Federal FY 2017) |
|
|---|---|
| People in Household | Maximum Monthly Allotment |
| 1 | $194 |
| 2 | $357 |
| 3 | $511 |
| 4 | $649 |
| 5 | $771 |
| 6 | $925 |
| 7 | $1,022 |
| 8 | $1,169 |
| Each additional person | $146 |
The SNAP benefit formula is based on need, with households closer to the poverty line receiving larger benefits. The SNAP formula expects households to spend about 30% of their net income on food. SNAP covers the difference between the 30% net income contribution and the TFP. (11) A family of 4 with a $700 net income would receive $439 a month, which equals the maximum benefit ($649) minus 30% of their net income ($210).
The Thrifty Food Plan
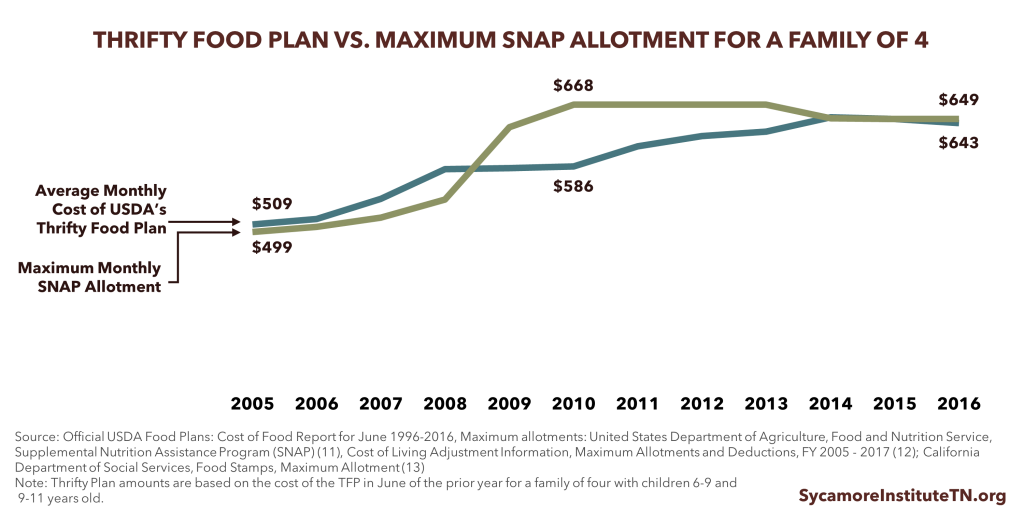
The TFP that underlies the SNAP benefit calculation assumes SNAP recipients will purchase unprocessed ingredients (e.g. vegetables, fruits, meat, etc.) and prepare the majority of their meals from scratch. (12) It does not account for individual, household, and environmental factors like local food prices, the ability to access fresh foods, the availability of time to shop for and prepare foods, and the costs of other needed goods and services (e.g. housing, transportation, and medical care). (2) (13)
Historically, the cost of TFP has exceeded the monthly maximum SNAP allotment (Figure 2). Due to this discrepancy, the Institute of Medicine and others have suggested modifying the TFP formula to account for the factors that influence a household’s ability to eat a nutritious, low-cost diet. (2) The TFP was most recently updated in 2006 and is adjusted annually for inflation.
Figure 2
 SNAP in Tennessee
The Tennessee Department of Human Services administers SNAP in Tennessee. In 2015, 405,730 Tennessee households (16%) received SNAP compared to 13% of households nationally (Figure 3). (14)
- 50% were households with children under the age of 18.
- 52% were households with incomes below the poverty level.
- 50% were households with 1 or more people with a disability.
- 76% of households had 1 or more people who worked in that past 12 months. (14)
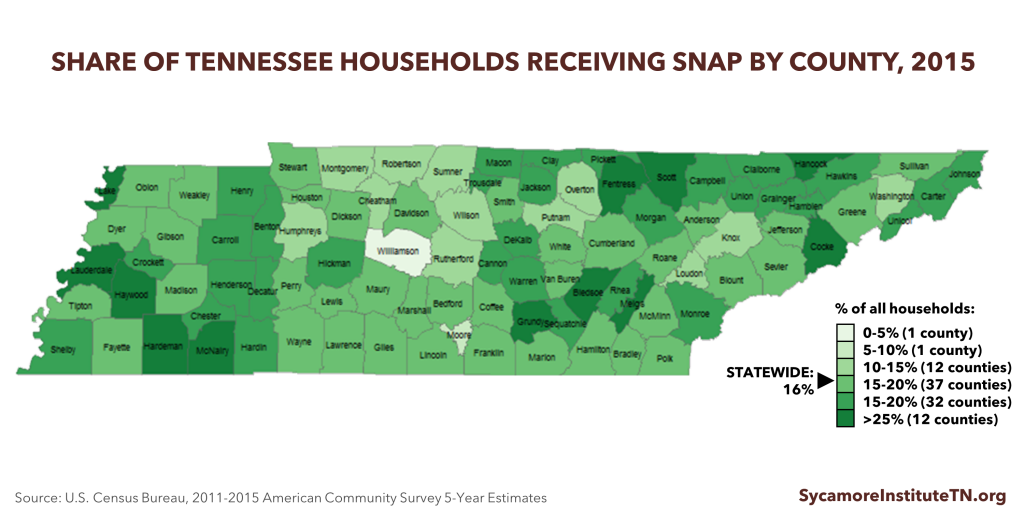
SNAP participation varies throughout the state, ranging from 4% of households in Williamson County to 37% of households in Lake County (Figure 4).
Figure 3
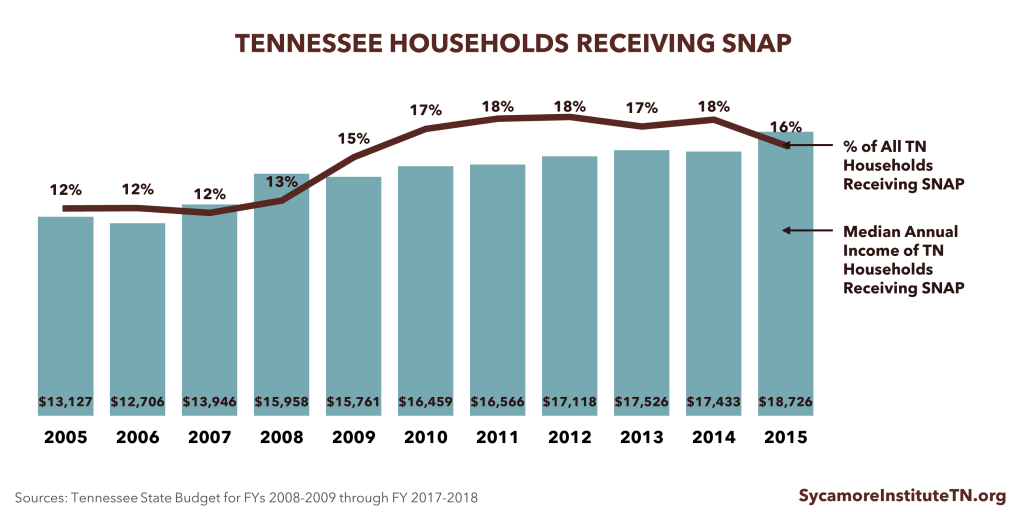
Figure 4
 In 2014, an estimated 94 -100% of all Tennesseans eligible for SNAP participated in the program. This is significantly higher than the U.S. participation rate of 82-84%. Participation rates among working poor people (defined as people with incomes below the poverty level who spend 27 weeks or more each year in the labor force) are lower. In 2014, about 71-86% of the working poor in Tennessee were eligible for and participated in SNAP. (3)
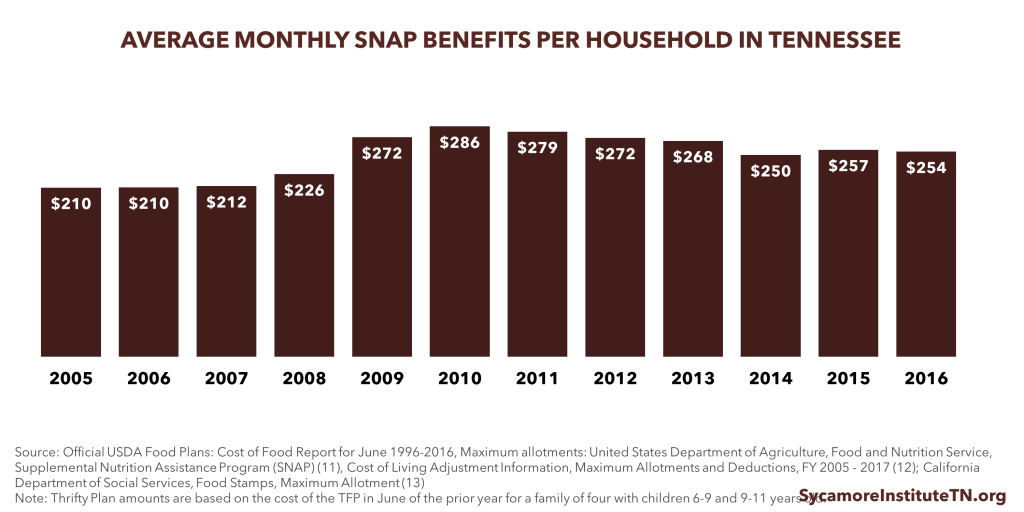
On average, Tennessee households participating in SNAP received $254 a month, which amounts to 39% of the maximum benefit amount (Figure 5).
Figure 5
 Does SNAP Work?
Congress created SNAP with the goal of helping low-income households experience food security and eat a nutritious diet. Evaluations of the program show that SNAP has been more effective at reducing food insecurity than at improving the nutritional intake of participants. Receiving SNAP benefits is also associated with improved child outcomes. (19) (20)
Food Insecurity
- On average, households receiving SNAP benefits are 20% less likely to be food insecure than households that are eligible for SNAP but don’t participate. (21) (22)
- Among people who receive SNAP, higher benefit amounts are associated with a decreased risk of food insecurity. (21)
- Households that participate in SNAP spend more on food than non-participant households with similar incomes. (23)
Nutrition
- While few low-income households meet dietary guidelines for promoting health, SNAP households consume more red meat, potatoes, and sugar-sweetened beverages and have a lower quality diet than low-income households not receiving SNAP. (26)
- Financial incentives (i.e. rebates and coupons) to purchase fruits and vegetables are associated with increased fruit and vegetable consumption among SNAP participants. (27) (28)
Child Outcomes
- The introduction of the Food Stamp Program in 1962 reduced the incidence of low birthweight babies by 1% among Whites and 1.5% among African-Americans. The impact was particularly strong in counties with higher poverty rates. (24)
- Children living in households with SNAP benefits are less likely to be diagnosed with anemia and failure to thrive than children living in low-income, non-participant households. (25)
- The initial county-by-county rollout of SNAP provided a natural experiment to assess the effects of exposure to SNAP as a child. Among SNAP-eligible households, access to SNAP in childhood was associated with reduced incidence of obesity, high blood pressure, and diabetes as an adult.
References
Click to Open/Close
[1] Hoynes, Hilary W, Schanzenbach, Diane Whitmore and Almond, Douglas. Long Run Impacts of Childhood Access to the Safety Net. The National Bureay of Economic Research (NBER) Working Paper No. 18535. [Online] 2012. http://www.nber.org/papers/w18535.pdf.
[2] Institute of Medicine. Supplemental Nutrition Assistance Program: Examining the Evidence to Define Benefit Adequacy. [Online] 2013. http://www.nationalacademies.org/hmd/~/media/Files/Report%20Files/2013/SNAP/SNAP_RB.pdf.
[3] U.S. Department of Agriculture. Supplemental Nutrition Assistance Program: Number of Persons Participating – March 2017. [Online] June 9, 2017. https://www.fns.usda.gov/pd/supplemental-nutrition-assistance-program-snap.
[4] Food and Nutrition Service, United States Department of Agriculture. Supplemental Nutrition Assistance Progam: Eligible Food Items. United States Department of Agriculture. [Online] 2017. https://www.fns.usda.gov/snap/eligible-food-items.
[5] United States Department of Agriculture. State SNAP-Ed Contacts. [Online] https://snaped.fns.usda.gov/state-contacts.
[6] U.S. Department of Agriculture. FY 2018 Budget Summary. [Online] May 2017, 22. https://www.usda.gov/sites/default/files/documents/USDA-Budget-Summary-2018.pdf .
[7] Bitler, Marianne. The Health and Nutrition Effects of SNAP: Selecetion Into the Program and a Review of the Literature on Its Effects. University of Kentucky Center of Poverty Research Discussion Paper Series. [Online] 2014. https://pdfs.semanticscholar.org/a814/5e9cb2f83b38c048c1d7a435eefa98e41cc5.pdf.
[8] State of Tennessee. 2008-2009 Through 2013-2014 U.S. Economic Recovery Act Tennessee Allocations for Selected Grant Programs (page 91). FY 2010-2011 Tennessee State Budget. [Online] http://www.tennessee.gov/assets/entities/finance/budget/attachments/10-11BudgetVol1.pdf .
[9] Food and Nutrition Service, United States Department of Agriculture. Supplemental Nutrition Assistance Program (SNAP). United States Department of Agriculture. [Online] April 24, 2017. https://www.fns.usda.gov/snap/eligibility.
[10] Tennessee Department of Human Services. SNAP Eligibility Information. [Online] https://www.tn.gov/humanservices/article/supplemental-nutition-assistance-program-snap-eligibility-information.
[11] Center on Budget and Policy Priorities. Policy Basics: Introduction to SNAP. [Online] March 24, 2016. http://www.cbpp.org/sites/default/files/atoms/files/policybasics-foodstamps.pdf.
[12] Rose, Donald. Food Stamps, the Thrifty Food Plan, and Meal Preparation: The Importance of the Time Dimension for US Nutrition Policy. Journal of Nutrition Education and Behavior. [Online] 2007. http://prc.tulane.edu/uploads/Food%20StampsThrifty%20Food%20PlanandMeal%20Preparation.pdf.
[13] Zillak, James. Modernizing SNAP Benefits. Brookings Institution, The Hamilton Project. [Online] May 2016. http://www.hamiltonproject.org/assets/files/ziliak_modernizing_snap_benefits.pdf.
[14] U.S. Census Bureau. 2015 American Community Survey 1-Year Estimates. [Online] factfinder.census.gov.
[15] Cunnyngham, Karen. Reaching Those in Need: Estimates of State Supplemental Nutrition Assistance Program Participation Rates in 2014. United States Department of Agriculture, Mathematica Policy Research. [Online] January 2017. https://fns-prod.azureedge.net/sites/default/files/ops/Reaching2014.pdf.
[16] United States Department of Agriculture. USDA Food PLans: Cost of Food Reports. [Online] https://www.cnpp.usda.gov/USDAFoodPlansCostofFood/reports?field_publication_type_tid=All&field_publication_date_value[value].
[17] —. SNAP Monthly State Participation and Benefeit Summary – Public Data, Fiscal Year 1996-2016. [Online] https://www.fns.usda.gov/pd/supplemental-nutrition-assistance-program-snap.
[18] California Department of Social Services. Food Stamp Tables – Maximum Allotment. [Online] http://www.cdss.ca.gov/shd/res/pdf/fsallot.pdf.
[19] Christensen, Garret, Bronchetti, Erin and Hoynes, Hilary. The Real Value of SNAP Benefits and Health Outcomes. University of California Berkely, Goldman School of Public Policy Working Paper. [Online] 2017. https://gspp.berkeley.edu/assets/uploads/research/pdf/Bronchetti-Christensen-Hoynes-01-31-17.pdf.
[20] Bartfield, Judith, et al. SNAP, Food Security, and Health. University of Wisconsion-Madison, Institute for Research on Poverty. [Online] https://www.irp.wisc.edu/publications/policybriefs/pdfs/PB8-SNAPFoodSecurityHealth.pdf.
[21] Bartfeld, Judith, et al. SNAP Matters: How Food Stamps Affect Health and Well Being. University of Wisconsin, Institute for Research on Poverty. [Online] December 2015. http://www.irp.wisc.edu/publications/media/webinars/2015/Dec2-2-2015-Webinar-SNAP.pdf.
[22] Ratcliffe, Caroline, McKernan, Signe-Mary and Zhang, Sisi. How Much Does the Supplemental Nutrition Assistance Program Reduce Food Insecurity. American Journal of Agriculturel Economics, 93(4). [Online] 2011. https://www.ncbi.nlm.nih.gov/pmc/articles/PMC4154696/.
[23] Landers, Patti S. The Food Stamp Program: History, Nutrition Education, and Impact. Journal of the American Dietetic Association. [Online] 2007. http://jandonline.org/article/S0002-8223(07)01619-7/pdf.
[24] Leung, Cindy W, et al. Dietary Intake and Dietary Quality of Low-Income Adults in the Supplemental Nutrition Assistance Program. American Journal of Clinical Nutrition. [Online] 2012. http://ajcn.nutrition.org/content/early/2012/10/02/ajcn.112.040014.full.pdf.
[25] Olsho, Lauren EW, et al. Financial incentives increase fruit and vegetable intake among Supplemental Nutrition Assistance Program participants: a randomized controlled trial of the USDA Healthy Incentives Pilot. The American Journal of Clinical Nutrition, 104(2). [Online] 2016. http://ajcn.nutrition.org/content/104/2/423.short.
[26] Young, Candace, et al. Improving Fruit and Vegetable Consumption Among Low-Income Customers at Farmers Markets: Philly Food Bucks, Philadelphia, Pennsylvania, 2011. Preventing Chronic Disease. [Online] 2013. https://www.ncbi.nlm.nih.gov/pmc/articles/PMC3804016/.
[27] Almond, Douglas, Hoynes, Hilary W and Schanzenbach, Diane Whitmore. Inside the War on POverty: the Impact of Food Stamps on Birth Outcomes. The Review of Economics and Statistics. [Online] May 2011. http://www.mitpressjournals.org/doi/pdf/10.1162/REST_a_00089.
[28] Mackey-Bilaver, Lucy and Chin, Meejung. Effects of WIC and Food Stamp Program. University of Chicago, USDA Economic Research Service, Food and Nutrition Assistance Research Program. [Online] December 2006. https://naldc.nal.usda.gov/download/33688/PDF.
[29] Tennessee Department of Human Services. SNAP Nutrition Information. [Online] http://www.tennessee.gov/humanservices/article/snap-nutrition-information1.