
Statistics and data points can provide valuable information about the world around us, but they’re also easily misunderstood and misused. This brief explains five simple concepts to help you make sense of statistics and sort out good information from bad.
Key Takeaways
- Rates are often more informative than raw numbers. Rates give context and allow for better comparisons, but using the right denominator can make a big difference.
- For statistics based on samples of a larger group, both the size of those samples and who/what they include is crucial.
- The existence of a relationship between two things does not mean one caused the other.
- Compelling stories can be a useful starting point for deeper study, but they don’t necessarily reflect wider trends.
1. Pay attention to the denominator.
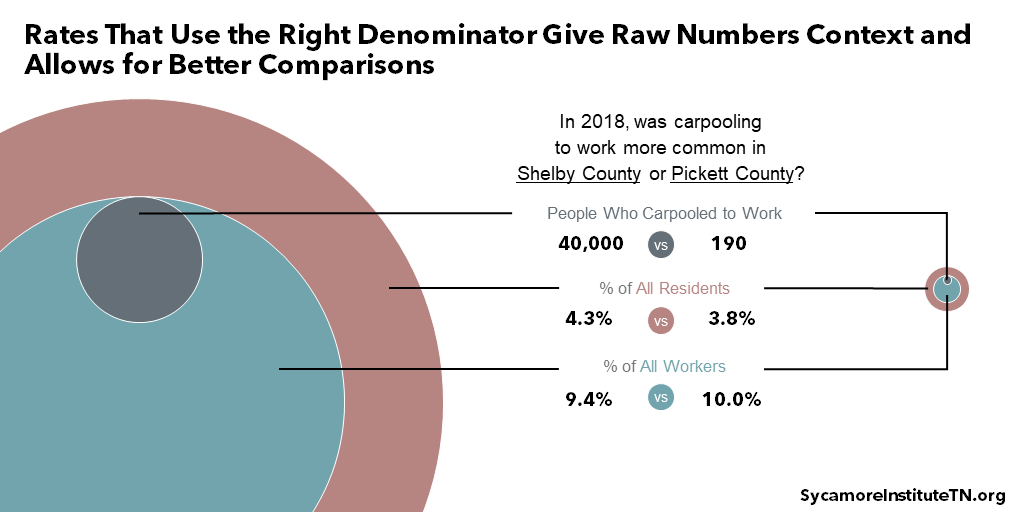
Rates are often more informative than raw numbers because they give context and allow for better comparisons. For example, the Census Bureau estimates that about 40,000 people in Shelby County and 190 in Pickett County carpool to work. (1) Shelby and Pickett are the most and least populous counties in Tennessee, though, so in this case raw numbers tell us more about the size of their populations than about carpooling. If we divide those numbers by each county’s total population, we see that 4.3% of all Shelby County residents carpool to work versus 3.8% in Pickett County. (1)
The denominator can make a big difference. For example, there’s one problem with the rates shown above: our denominator includes everyone living in the county, even children and adults who aren’t working. In this example, it’s more meaningful to focus only on people with jobs. When we do that and divide the number of people who carpool to work by the number of employed people in each county, we learn that carpooling to work is actually slightly more common in Pickett County, where 10.0% of all workers do it versus 9.4% in Shelby County (Figure 1). (1)
Figure 1
2. Sample size and composition matter.
For statistics based on samples of a larger group, both their size and who/what they include is crucial. Researchers often study a subset of a population because it would be too expensive, or sometimes even impossible, to collect information from the entire population. If a sample is too small or doesn’t accurately reflect the population in some key way, any statistic or conclusion based on it will likely be incorrect.
The 1936 U.S. presidential election offers a good example. In the runup to the election, Literary Digest Magazine conducted the largest presidential poll in history. (2) Based on a sample of over two million Americans, it predicted that Alf Landon would win a landslide victory. As it turned out, Franklin D. Roosevelt won with 62% of the vote. The problem? People who responded to the poll were wealthier than average and not a good overall sample of American voters.
3. Treat causation with caution.
The existence of a relationship between two things does not mean one caused the other. It’s possible that a third factor or set of factors cause both. Ignoring other variables might make a relationship appear causal when it is really just a chance association.
Consider the relationship between shoe size and education. As children become adults, they generally achieve higher levels of education and also grow physically. Even though there’s a strong relationship between education and shoe size, earning a diploma does not cause our feet to grow. Education is simply associated with shoe size. The real culprit is aging.
4. Statistics are more informative than stories.
Compelling stories can be a useful and persuasive starting point for deeper study, but they don’t necessarily reflect wider trends. (3) High-quality statistical analysis uses data and samples to uncover relationships and show how things tend to happen. While anecdotes can give statistics a human face, they may also overstate relationships and highlight rare events that don’t reflect broader experiences or trends.
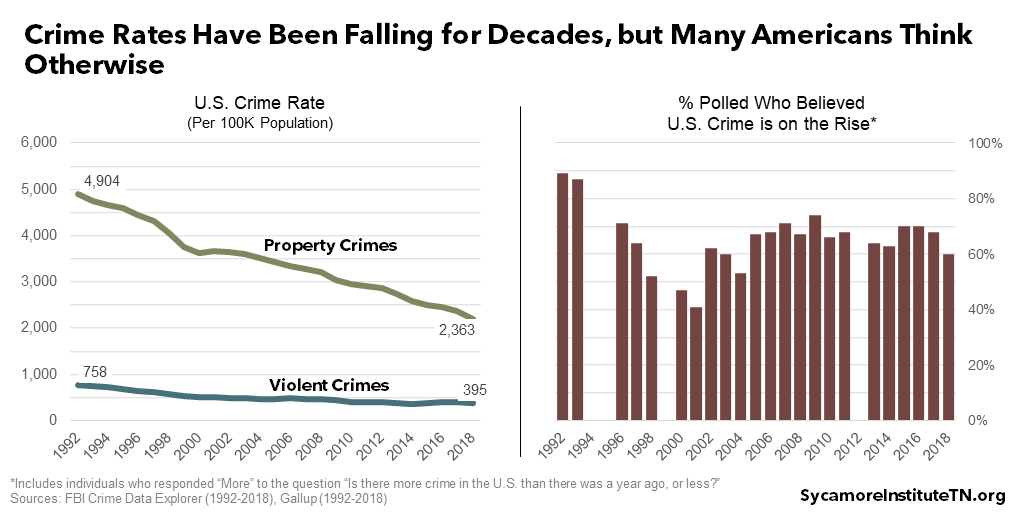
For example, polls often show most Americans think crime rates are rising even though they have fallen for decades (Figure 2). (4) (5) (6) (7) So, why the divide? Many researchers believe it comes down to news stories. (8) (9) The amount of media attention given to crime doesn’t necessarily follow trends in crime rates – which affects how people perceive those trends. (10) (8) (11) (12)
Figure 2
5. Check the source.
When you read or hear about statistics, data points, studies, or anything else involving numbers, find the original source. Sometimes media can oversimplify findings or even misconstrue an author’s conclusions. Is the original source reliable? Does it have biases that might influence how it looks at or talks about an issue? In a follow-up post, we’ll explore more questions to ask to as you look at research studies.
Other Considerations
Looking for even more tips? Here are some other important things to keep in mind:
- Read charts and graphics closely. Do the visualizations accurately reflect what’s in the text? Is every element labeled? Do the size, shape, and scope of the visual and axes fairly represent the facts?
- Percent ≠ percentage point. For example, if the interest rate on your loan goes from 4% to 6%, that growth of two percentage points reflects a 50% increase.
- Read more than the headline. It’s hard to pack all the relevant information into a short headline or tweet. For instance, we promised you five simple points…yet here we are offering more!
References
Click to Open/Close
- U.S. Census Bureau. American Community Survey 5-Year Estimates for 2014-2018. [Online] December 2019. [Cited: August 6, 2020.] Data obtained from https://data.census.gov/.
- Squire, Peverill. Why the 1936 Literary Digest Poll Failed. Public Opinion Quarterly. [Online] 52(1) 1988. https://academic.oup.com/poq/article-abstract/52/1/125/1878544?redirectedFrom=PDF.
- King, Gary, Verba, Sidney and Keohane, Robert. Designing Social Inquiry. Princeton University Press. [Online] 1994. https://press.princeton.edu/books/paperback/9780691034713/designing-social-inquiry.
- Gallup. Crime. [Online] [Cited: August 14, 2020.] https://news.gallup.com/poll/1603/crime.aspx.
- Federal Bureau of Investigation. Crime Data Explorer. [Online] [Cited: August 14, 2020.] https://crime-data-explorer.fr.cloud.gov/explorer/national/united-states/crime.
- Koerth, Maggie and Thomson-DeVeaux, Amelia. Many Americans Are Convinced Crime is Rising in the U.S. They’re Wrong. FiveThirtyEight. [Online] August 3, 2020. https://fivethirtyeight.com/features/many-americans-are-convinced-crime-is-rising-in-the-u-s-theyre-wrong/.
- Gramlich, John. 5 Facts About Crime in the U.S. Pew Research Center. [Online] October 17, 2019. https://www.pewresearch.org/fact-tank/2019/10/17/facts-about-crime-in-the-u-s/.
- Mann, Stephen. Crime and the Media in America. Oxford University Press Blog. [Online] April 5, 2018. https://blog.oup.com/2018/04/crime-news-media-america/.
- Beale, Sara Sun. The News Media’s Influence on Criminal Justice Policy: How Market-Driven News Promotes Punitiveness. William & Mary Law Review. [Online] 48(2) 2006. https://scholarship.law.wm.edu/cgi/viewcontent.cgi?article=1103&context=wmlr.
- TCR Staff. How Well Does the US Media Cover Criminal Justice. Center on Media, Crime, and Justice at John Jay College. [Online] February 19, 2019. https://thecrimereport.org/2019/02/15/how-well-does-the-us-media-cover-criminal-justice/.
- Callahan, Valerie J. Media Consumption, Perceptions of Crime Risk and Fear of Crime: Examining Race/Ethnic Differences. Sociological Perspectives. [Online] 55(1) 2012. https://www.jstor.org/stable/10.1525/sop.2012.55.1.93?seq=1.
- Lowry, Dennis T., Josephie Nio, Tarn Ching and Leitner, Dennis W. Setting the Public Fear Agenda: A Longitudinal Analysis of Network TV Crime Reporting, Public Perceptions of Crime, and FBI Crime Statistics. Journal of Communication. [Online] 53(1) 2003. https://academic.oup.com/joc/article-abstract/53/1/61/4102948.
Image credit: Shutterstock.com/Aon Khanisorn


