Key Takeaways
- In 2020, an estimated 278,000 Tennessee children below the age of 18 lived in households with incomes below the official poverty level. At 18.8%, the child poverty rate had reached a 10-year low.
- Some of the highest rates of poverty were found among:
- Black, Hispanic, and multiracial children and those identified as some other race,
- Children with one or more disabilities,
- Families led by single mothers,
- Primarily Spanish-speaking households,
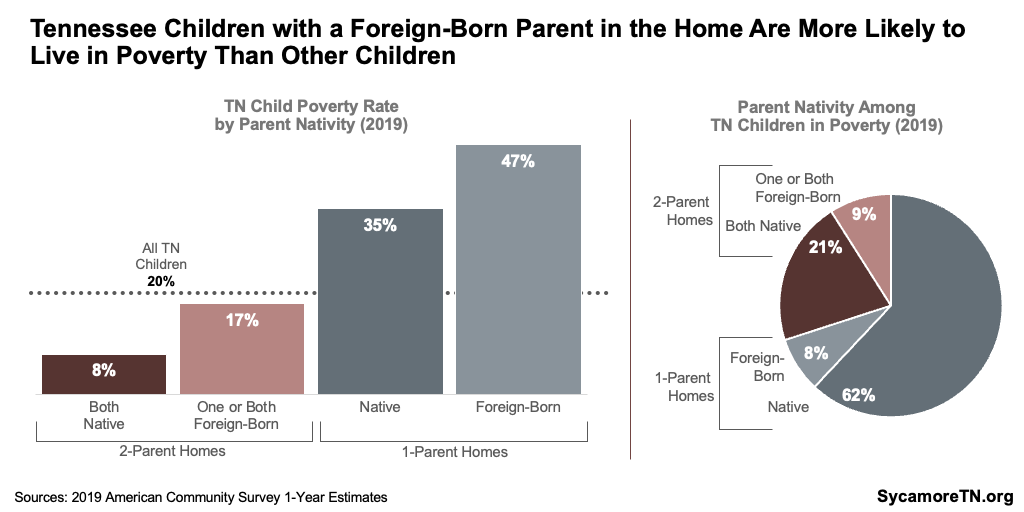
- Homes with at least one foreign-born parent.
- Counties’ child poverty rates ranged from 3% in Moore County to 48% in Hancock over the course of 2016-2020, and trends varied significantly by county and by time period.
- Counties with more children living in poverty tend to be more rural and have lower population growth, poorer health, less education, worse economic conditions, and fewer 2-parent households.
- We caution readers not to mistake correlation with cause-and-effect. Sometimes two data points may be correlated, but there is some other factor at play.
Note: The U.S. Census Bureau will release 2021 American Community Survey 1-year estimates on September 15, 2022. The analyses in this report were completed before these data were made available.
Overview
When families don’t have the resources to meet basic needs, children’s health, education, and well-being can suffer. (1) (2) Tennessee operates dozens of public programs aimed at helping low-income children and their families meet these needs and achieve better outcomes. This series seeks to answer key questions about child poverty in Tennessee – one measure of economic well-being – to help inform these approaches and investments.
This report provides a picture of the children, families, and communities in Tennessee with the highest rates of child poverty. Future work will examine the connections between child poverty and health, educational achievement, and well-being – as well as the programs, policies, and community norms and assets that successfully break those connections.
Who Faces Child Poverty in Tennessee?
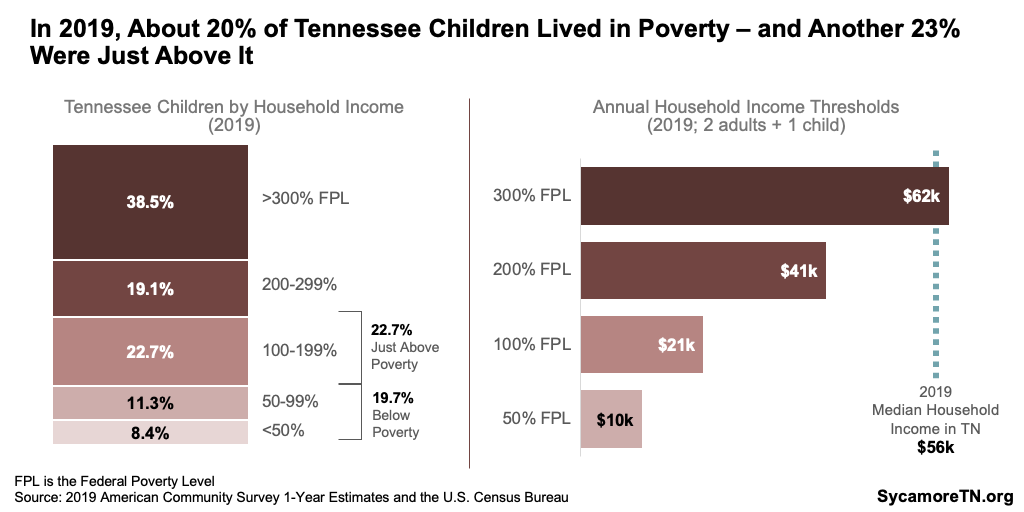
In 2020, an estimated 278,000 Tennessee children below the age of 18 lived in households with incomes below the official poverty level. At 18.8%, the child poverty rate had reached a 10-year low (Figure 1). Over the past decade, that number topped out in 2013 at about 390,000, or 27%. By 2020, both the number and percentage of Tennessee children in poverty had dropped by nearly 30%.‡ In 2019 – the most recent year for which detailed data are available – nearly 20% of children lived below the poverty level and another 23% lived in households just above it (Figure 2).
Figure 1
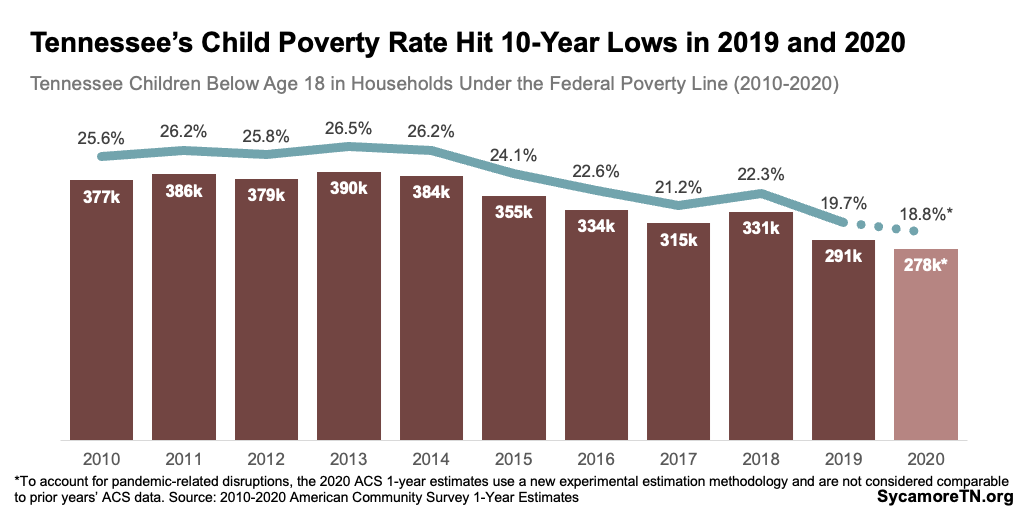
Figure 2
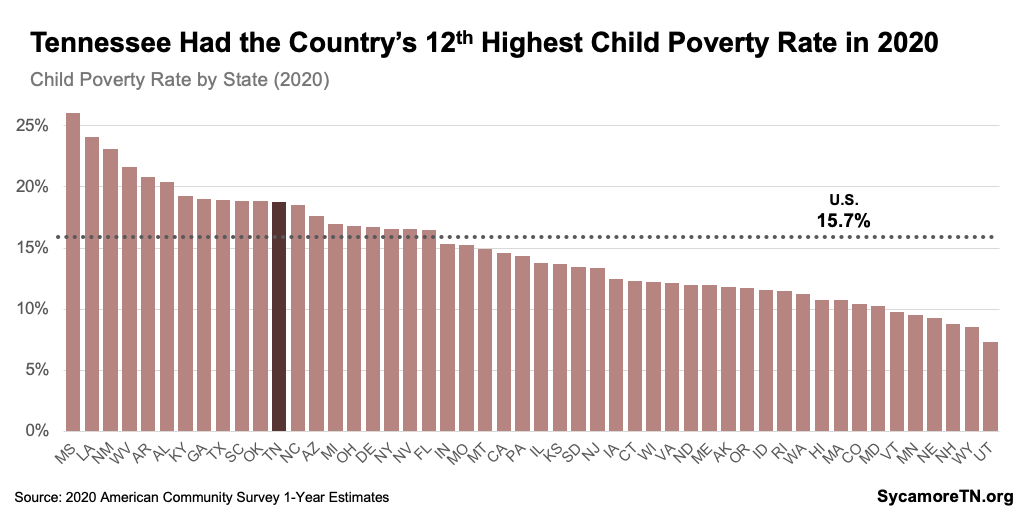
Tennessee’s 18.8% child poverty rate in 2020 was about 20% higher than the estimated 15.7% national rate (Figure 3). This put Tennessee at the 12th highest child poverty rate in the nation (Figure 4). Because the nation’s child poverty rate has improved at about the same rate as Tennessee’s, the gap between Tennessee and the U.S. has not changed considerably over the last decade.
Figure 3
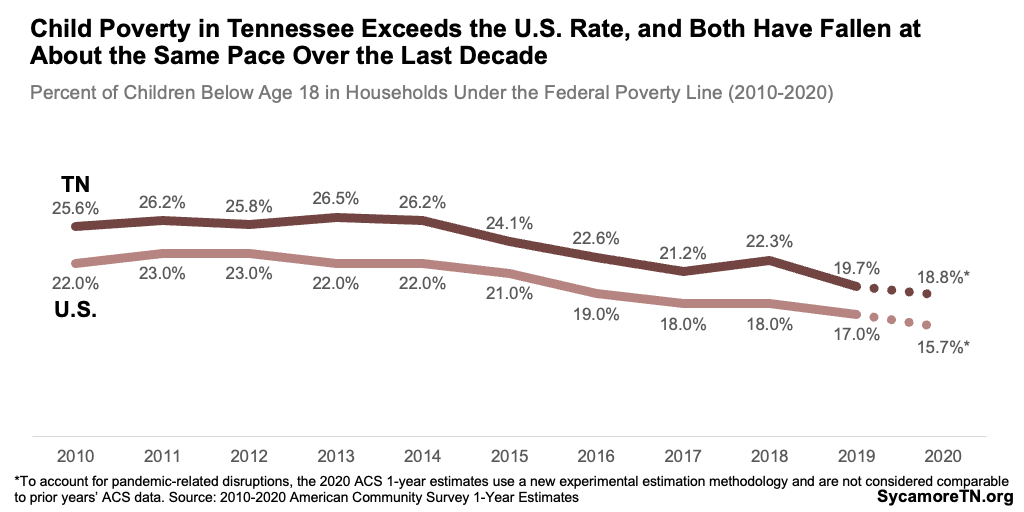
Figure 4
How Poverty Varies by Child Characteristics
The child poverty rate in Tennessee varies considerably for children with different demographic characteristics.
- Children with disabilities had higher poverty rates than those without (Figures 5).
- White and Asian children had significantly lower rates of poverty than all other racial and ethnic groups – including black Hispanic, and multiracial children and those identified as some other race (Figure 6).
- Since peaking around 2013, the rates for black and Hispanic children and children reporting some other race improved the most but still lag rates for white and Asian children (Figure 7).
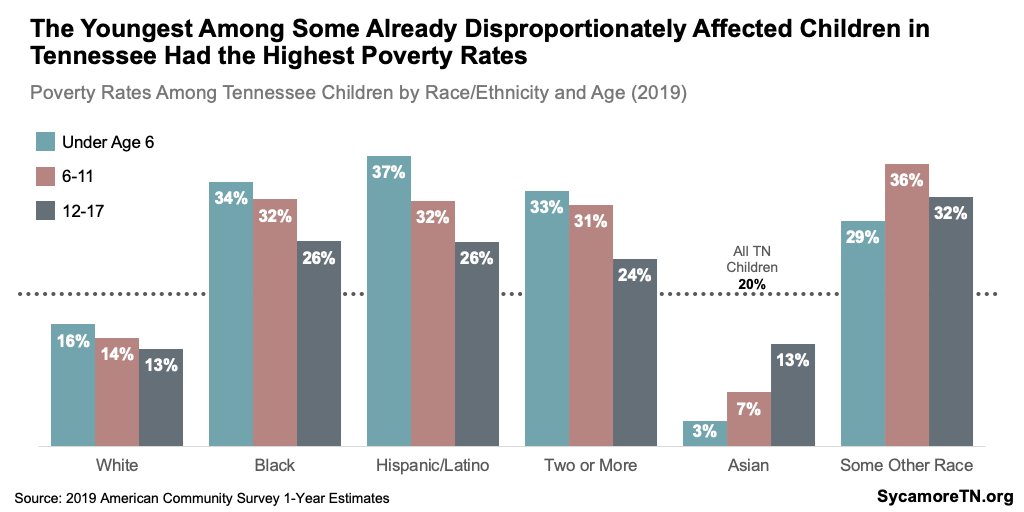
- Overall, the youngest children are the most likely to experience poverty, especially among some already disproportionately affected groups (Figures 5 and 8).
Figure 5
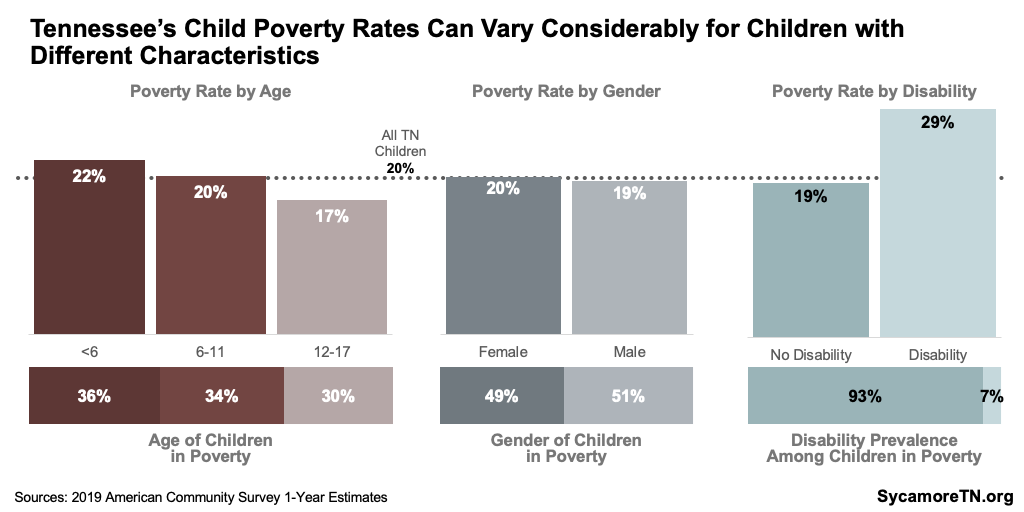
Figure 6
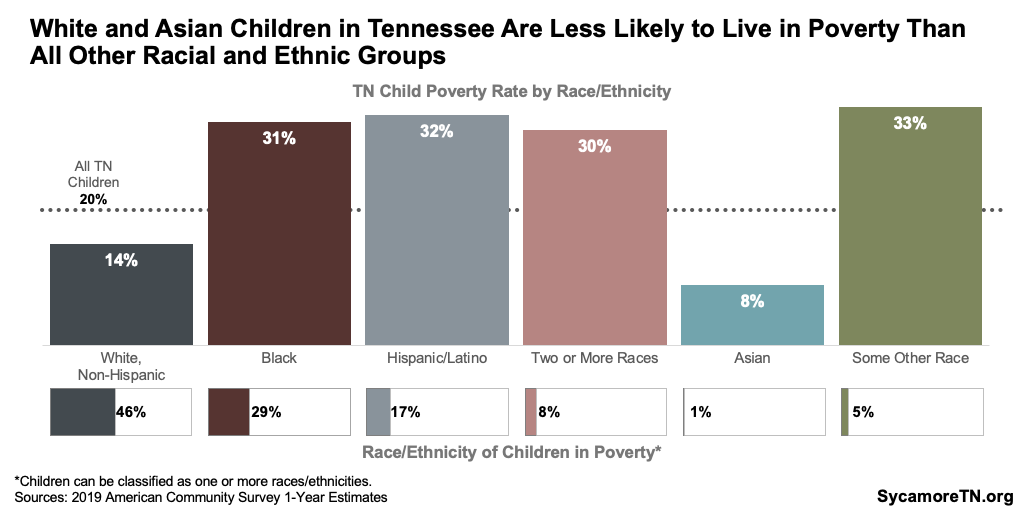
Figure 7
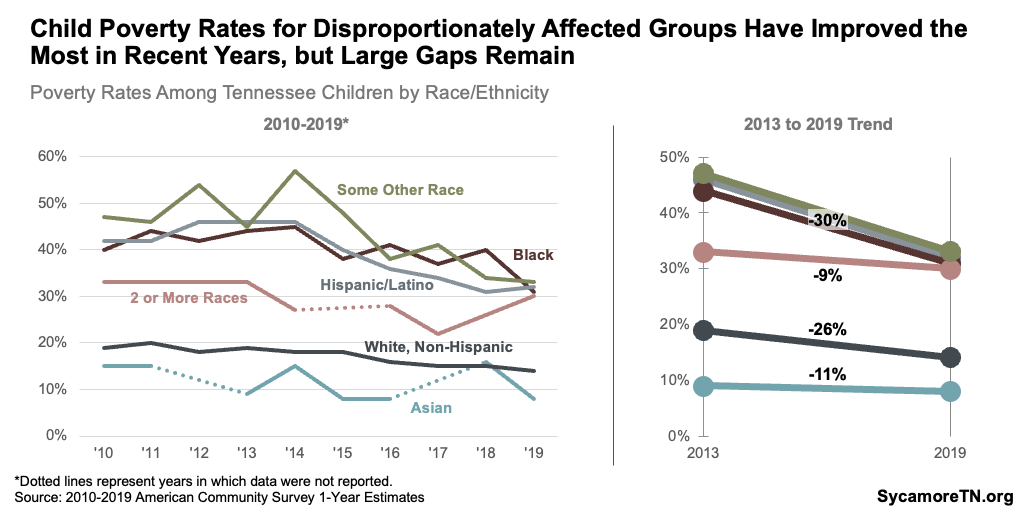
Figure 8
A Note about our Data
In this report, we use a combination of one-year estimates and five-year estimates created by the U.S. Census Bureau. One-year estimates can accurately capture metrics for larger geographical areas while five-year estimates are needed to create accurate estimates for smaller areas, including most Tennessee counties. Because of the difference in time period, one-year estimates and five-year estimates should not be compared, and neither should overlapping five-year estimates (e.g. 2015-2019 vs. 2016-2020). Due to complications in data collection during 2020 as a result of COVID-19, it is also not recommended to compare 2020 one-year estimates with other years. (16)
Poverty Among Households with Children
Families led by single mothers, primarily Spanish-speaking households, and homes with at least one foreign-born parent all have disproportionately high poverty rates.
- Family Structures – In 2019, nearly 60% of all families below the poverty level were single-mother households. About 37% of all single-mother-led families were in poverty in 2019 – compared with 21% of single-father-led families and 7% of married couple families (Figure 9).
- Family Size – Larger families are much more likely to have below-poverty incomes than smaller ones (Figure 10).
- Primary Language at Home – Nearly one-third of children in primarily Spanish-speaking households lived in poverty – compared with 18% of children in English-speaking homes. The former also made up 12% of all Tennessee children in poverty (Figure 11).
- Parent Nativity – Children who live with a foreign-born parent are more likely to experience poverty than those who don’t (Figure 12). For example, about half of children in a family with a single, foreign-born parent lived in poverty in 2019 and accounted for 8% of all children in poverty.
Figure 9
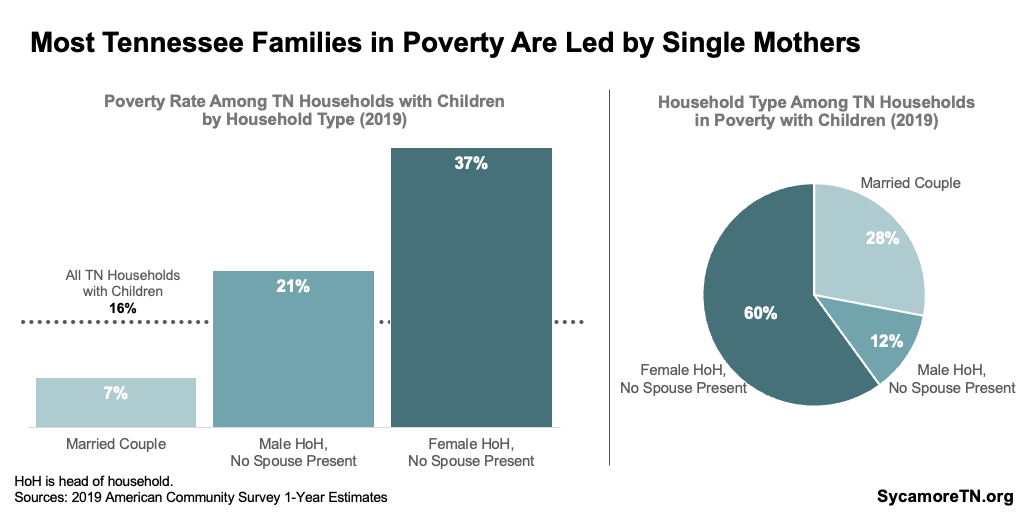
Figure 10
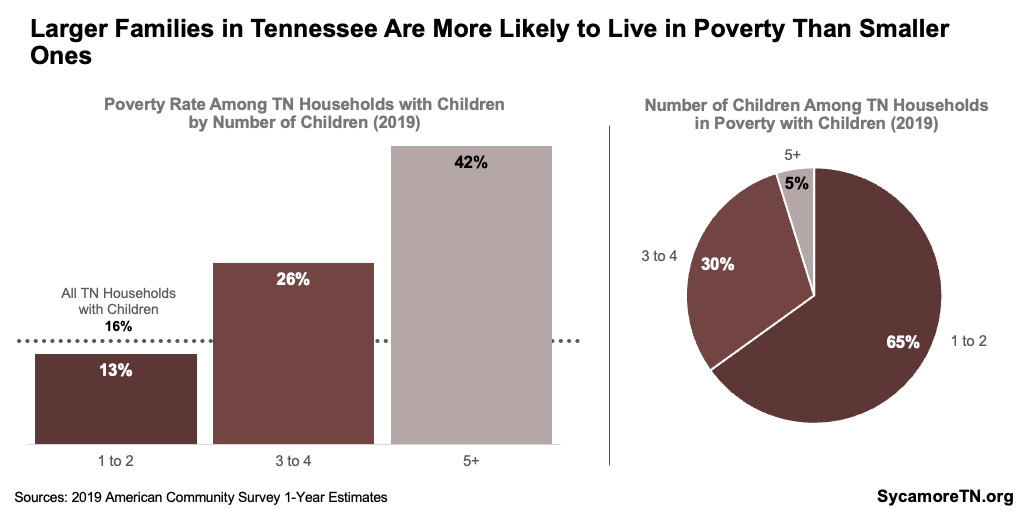
Figure 11
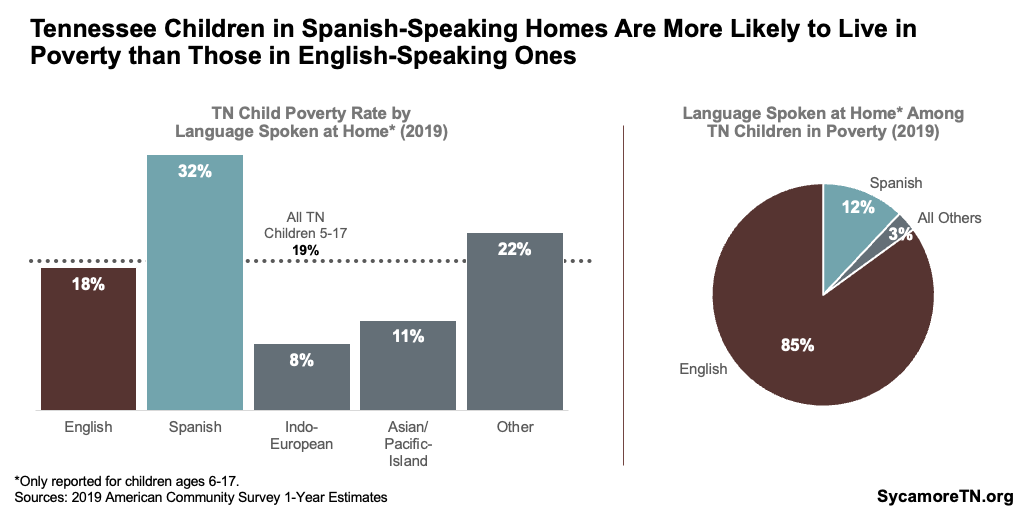
Figure 12
Where is Child Poverty Highest in Tennessee?
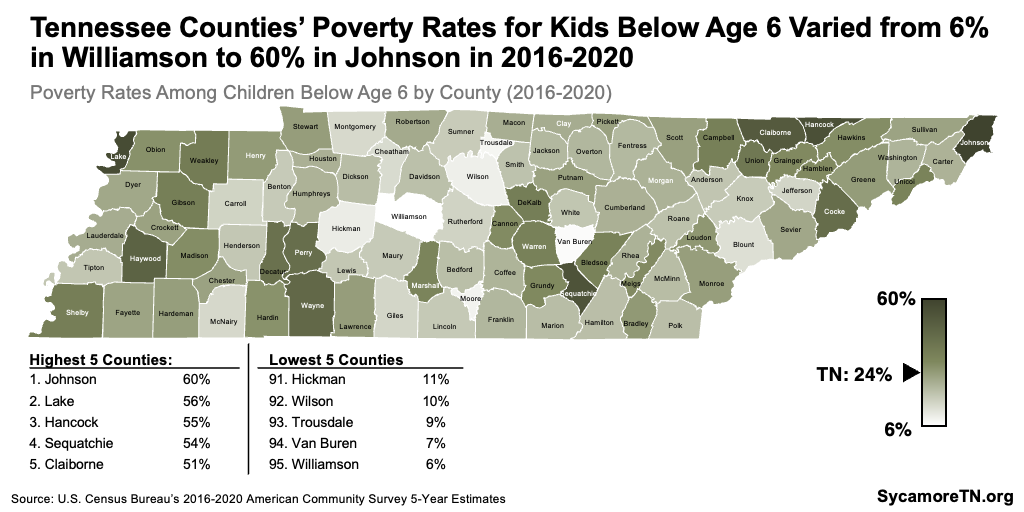
Counties’ child poverty rates ranged from 3% in Moore County to 48% in Hancock over the course of 2016-2020 (Figure 13). These county-level differences were even more pronounced for poverty rates among children under six years old – ranging from 6% in Williamson to 60% in Johnson (Figure 14). They were larger still when comparing zip codes in Tennessee (Interactive Map).
Figure 13
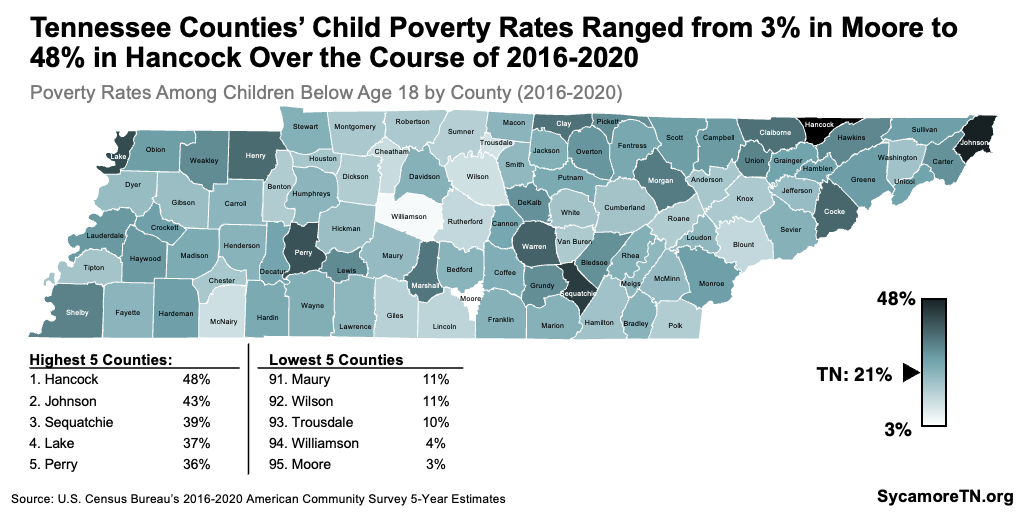
Figure 14
Interactive Map
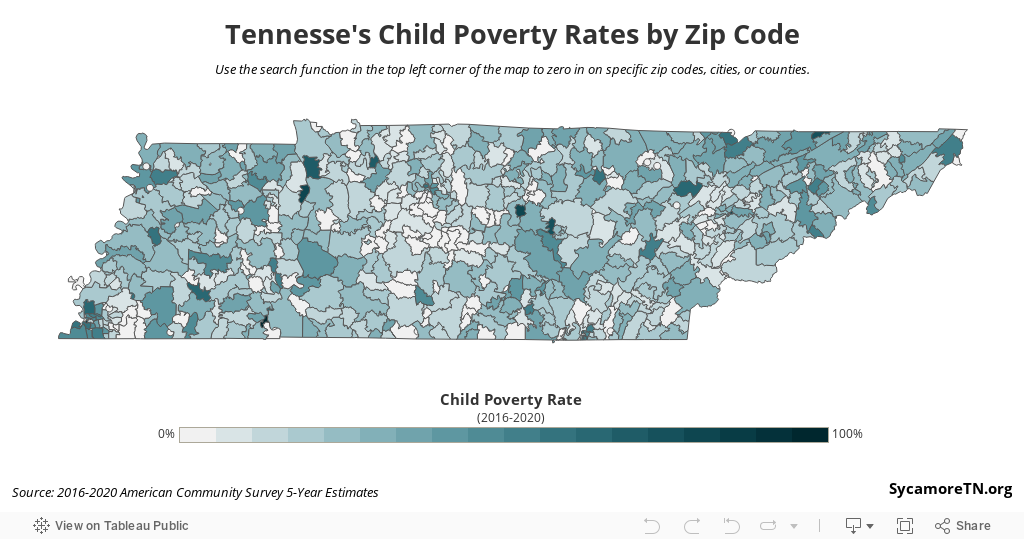
Figure 15
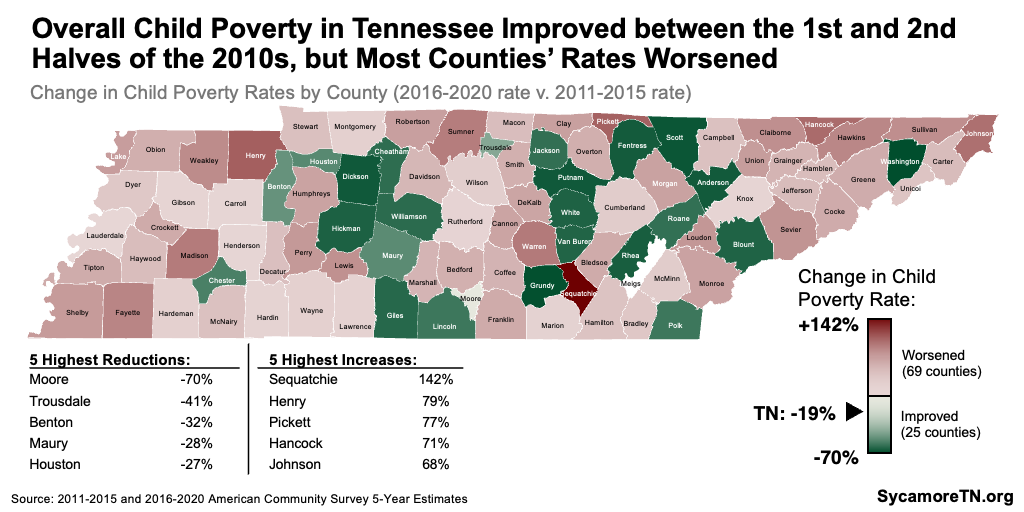
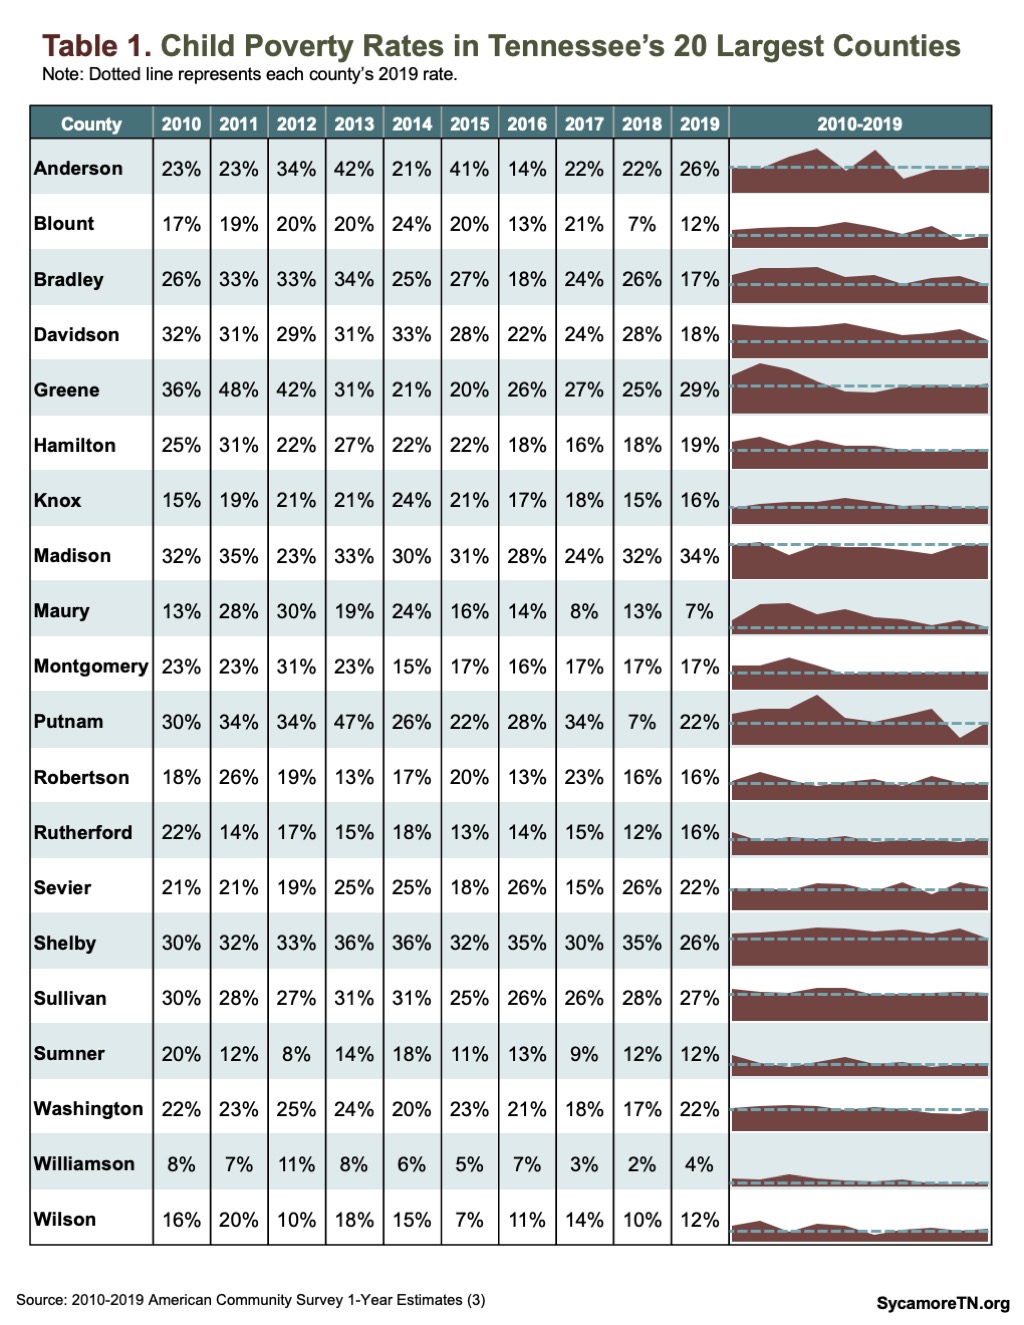
Across Tennessee, changes in child poverty have varied substantially by county and by time period. For example, the change from the first to the second half of the 2010s ranged from a 70% reduction in Moore County (from 11% to 3%) to more than doubling in Sequatchie (from 16% to 39%) (Figure 15). Meanwhile, Table 1 shows annual child poverty estimates for 2010-2019 for Tennessee’s 20 largest counties, which paints a more complex picture of county trends. For example, all 20 counties had 2019 child poverty rates below their peak rate of the decade, which occurred in most counties sometime between 2011-2014. However, the 2019 rate was the 10-year low for only four of the counties.
Characteristics of High and Low Poverty Counties
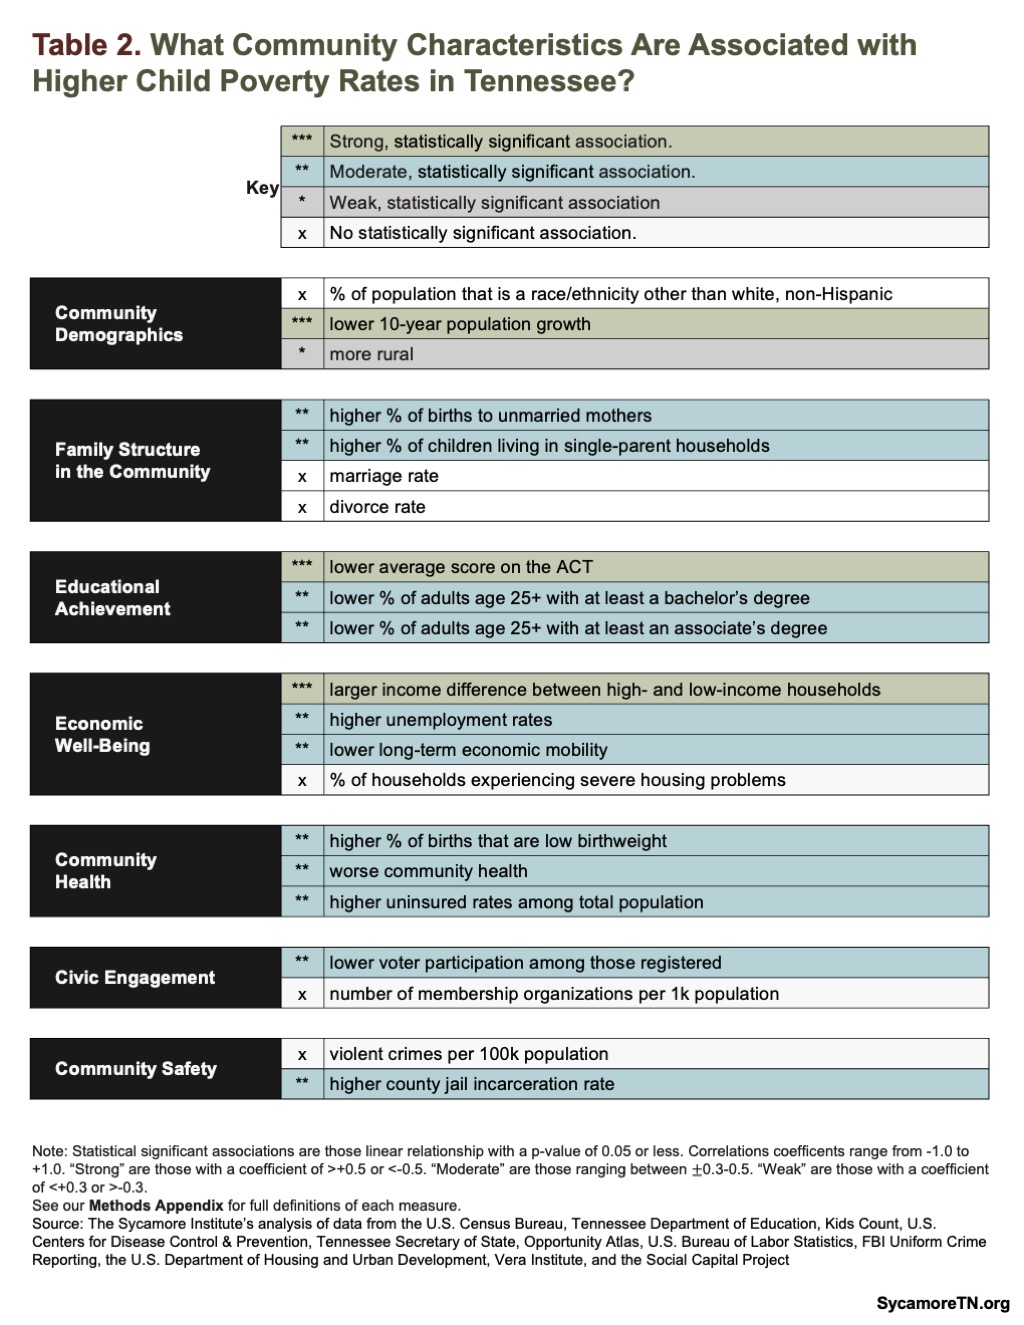
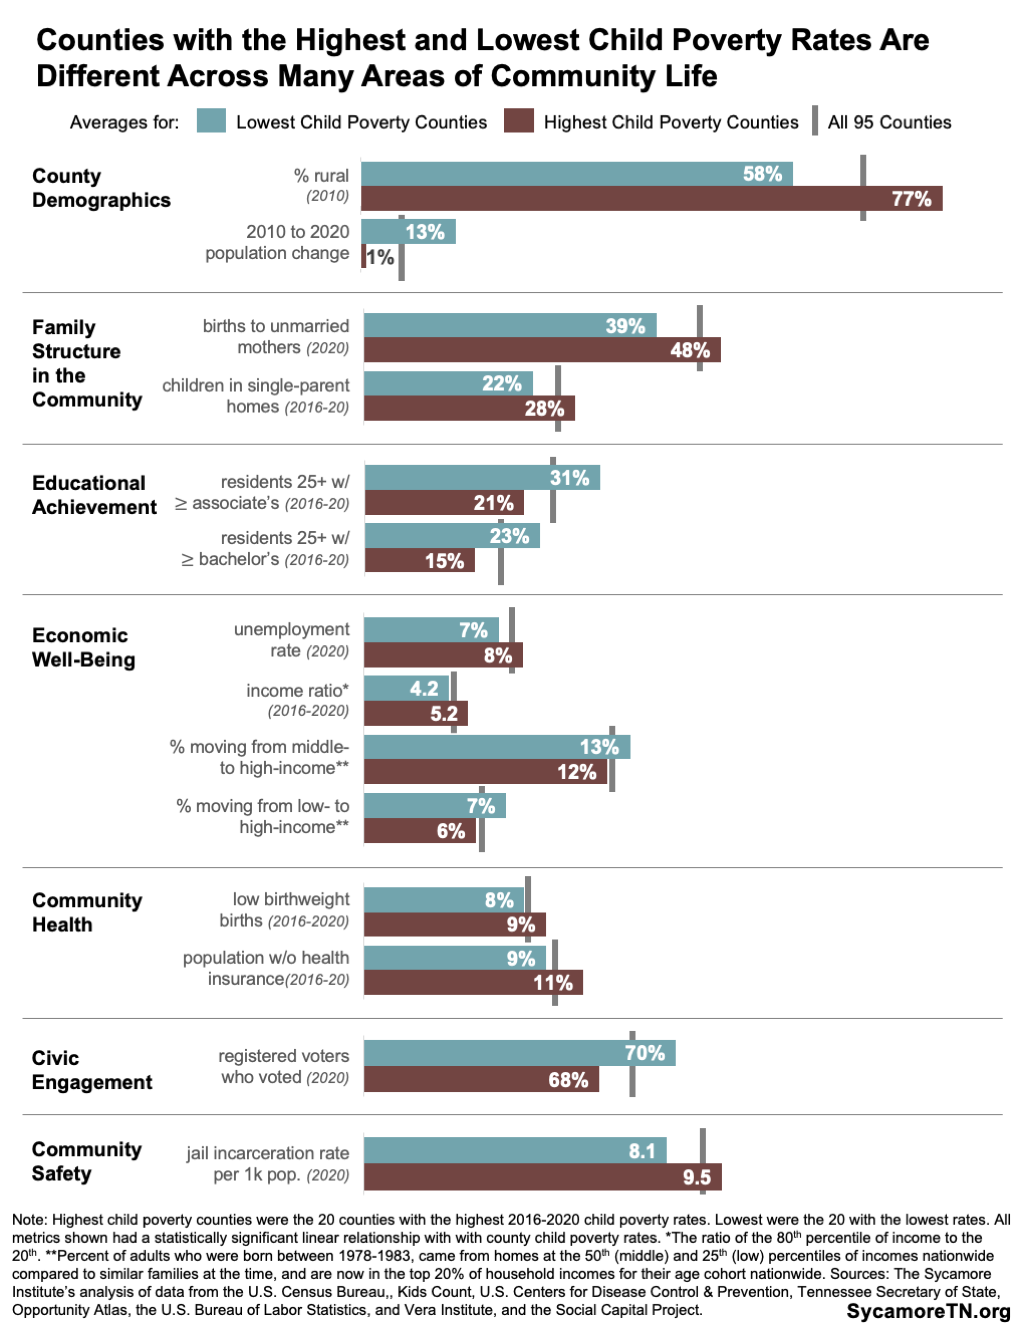
Counties with higher child poverty rates tended to be more rural, experience less growth, and have poorer health, lower education, worse economic conditions, and fewer 2-parent households (Figure 16). We explored measures for multiple aspects of community life to better understand any differences between counties with high and low rates of child poverty. Table 2 outlines each of the characteristics we tested and notes where counties with higher child poverty rates had meaningful and statistically significant differences from counties with lower child poverty rates. The sections that follow summarize key findings about these correlations. See the Appendix for more information about each measure and the full statistical results of our analyses.
We caution readers not to mistake correlation with cause-and-effect. Correlation means that two factors move in the same or opposite directions at the same time. Causality means that changes in one factor lead to changes in another. Establishing cause-and-effect requires more sophisticated research design — like statistical controls, experimental designs with random assignments or matching techniques, or longitudinal designs. Sometimes two data points may be correlated, but there is some other factor at play.
Community Demographics
Counties with higher levels of child poverty tend to be more rural and have less population growth over time:
- Rurality – The 20 counties with the highest child poverty rates are nearly 20% more rural than the 20 counties with the lowest child poverty rates.
- Population Growth – Counties with the highest child poverty rates grew less than 1% on average between the 2010 and 2020 American Community Survey (ACS) 5-Year Estimates. Meanwhile, counties with the lowest child poverty levels grew approximately 13%.
The proportion of white vs. non-white residents was not significantly different between counties with the highest and lowest levels of child poverty.
Family Structures in the Community
Counties with higher poverty levels tend to have more single-parent births and households:
- Single-Mother Births – On average, 48% of children born in the 20 counties with the highest child poverty rates were born to unmarried mothers – compared with 39% in the 20 counties with the lowest child poverty rates.
- Single-Parent Households – About 28% of kids in the highest child poverty counties lived in single-parent households vs. about 22% in the 20 counties with the lowest child poverty rates.
Marriage and divorce rates vary little from one county to the next – including between those with high and low child poverty.
Figure 16
Educational Achievement
Counties with higher child poverty rates tended to have fewer residents with post-secondary degrees and lower ACT scores:
- Adult Post-Secondary Completion – In the 20 counties with the highest child poverty rates, 21% of residents 25+ had at least an associate’s degree and 15% at least a bachelor’s – versus 31% and 23%, respectively, in the 20 counties with the lowest rates of child poverty.
- Standardized Test Performance – Standardized test scores vary widely across counties with the highest and lowest rates of child poverty. In the 20 counties with the highest levels of child poverty, students scored below the population average on the American College Testing (ACT) exam, while students in the 20 counties with the lowest levels of child poverty performed better than the population average. Standardized test performance had a strong and statistically significant relationship with child poverty rates, with scores decreasing as child poverty rates increased across counties (see Appendix Table A2).
Economic Conditions & Well-Being
Counties with higher levels of child poverty also had lower levels of economic mobility, higher unemployment, and larger income gaps:
- Economic Mobility – The probability of moving from low- or middle- income status in childhood to the top 20th percentile in adulthood was less likely in counties with higher child poverty rates.
- Unemployment – An average of 8% of adults were unemployed from 2018-2020 in the 20 counties with the highest child poverty rates – compared to 7% in the counties with the lowest child poverty rates.
- Differences in Household Income – There was a strong and significant relationship between the ratio of incomes among households in the 80th and 20th percentile in each county. As the gap between these income levels grew, counties were more likely to have higher rates of child poverty.
Severe housing problems were not associated with higher or lower levels of child poverty across counties. Housing problems included overcrowding, high housing costs, lack of kitchen facilities, and lack of plumbing facilities, and were experienced at similar rates across all 95 counties.
Community Health
Counties with higher levels of child poverty had higher uninsured rates, more chronic medical conditions, and a slightly higher percentage of low birthweights:
- Uninsured Rates – Counties with higher child poverty rates were more likely to have a higher uninsured rate among residents. An average of 11% of residents in the 20 counties with the highest child poverty rates were uninsured, compared to 9% in the 20 counties with the lowest child poverty rates.
- Community Medical Conditions – Examining a combined prevalence of 13 chronic diseases and medical conditions, counties with higher levels of child poverty were significantly more likely to have higher levels of adults with chronic medical conditions. Chronic medical conditions among adults 18 and older included: arthritis, asthma, high blood pressure, high cholesterol, cancer, chronic kidney disease, chronic obstructive pulmonary disease (COPD), coronary heart disease, depression, diabetes, obesity, all teeth lost (among those 65+), and history of stroke.
- Low Birthweights – Among the 20 counties with the highest levels of child poverty, approximately 9% of children were born with low birthweight, compared to 8% on average among the counties with the lowest child poverty rates. While these averages are not dramatically different, we found a linear relationship across all 95 counties with low birthweight births were more common in counties with higher rates of child poverty.
Civic Engagement
- Voter Participation – Counties with higher voter turnout in 2020 were more likely to have lower child poverty rates. This measure of civic engagement was significantly different across all 95 counties, with less voter participation among counties with higher child poverty rates. Approximately 70% of those registered voted in the 20 counties with the lowest child poverty rates, compared to an average of 68% in the 20 counties with the highest child poverty rates.
There was no linear relationship between county child poverty rates and the number of membership organizations in a county.
Community Safety
- Jail incarceration rate – Counties with higher child poverty rates also had higher jail incarceration rates. The average rate among the 20 counties with the highest child poverty rates was about 9.5 jail incarcerations for every 1,000 people ages 15-64, while the average among the 20 lowest was 8.1.
While there was a difference in violent crime rates between the 20 counties with the highest and lowest child poverty rates – 401 violent crime offenses per every 100,000 people compared to 345 – the relationship was not statistically significant across all 95 counties.
Parting words
Poverty can negatively affect children’s long-term well-being. A data-driven understanding of child poverty in Tennessee can help federal, state, and local policies and programs to meet the needs of and produce better outcomes for those they seek to aid. This report is the first in a series to help stakeholders better understand the geography of child poverty in Tennessee, the children, families, and communities most likely to be affected, and if and how current programs, policies, and community norms and assets can break the connections between poverty and poor long-term outcomes.
‡ Disruptions caused by COVID-19 limit the level of detail available and the comparability of the American Community Survey’s 1-year estimates for 2020. Each year, the ACS produces estimates based on a sample of the U.S. population. If the sample is too small or doesn’t accurately reflect the population in some key way, these estimates will likely be incorrect. Pandemic-related disruptions fundamentally shifted who the Census Bureau was able to reach and who responded to the survey. To account for these changes, the Census Bureau changed how they weighted survey responses to produce estimates for the larger population. They also released far fewer estimates than in years past. Because both the sample surveyed and the estimation methods differ from prior years, the 2020 estimates are not considered comparable to prior estimates.
References
Click to Open/Close
- Gitterman, Benjamin, et al. Poverty and Children Health in the United States. American Academy of Pediatrics. 2016. https://publications.aap.org/pediatrics/article/137/4/e20160339/81482/Poverty-and-Child-Health-in-the-United-States
- Duncan, Greg and Hoynes, Hilary. Reducing Child Poverty Can Promote Children’s Development and Productivity in Adulthood. Society for Research in Child Development. October 2, 2021. https://www.srcd.org/research/reducing-child-poverty-can-promote-childrens-development-and-productivity-adulthood
- U.S. Census Bureau. American Community Survey 1-Year Estimates. 2022. Data accessed from https://data.census.gov/.
- —. 2019 Poverty Thresholds by Size of Family and Number of Children. Accessed on August 16, 2022 from https://www.census.gov/data/tables/time-series/demo/income-poverty/historical-poverty-thresholds.html.
- —. American Community Survey 5-Year Esimates. Data accessed from https://data.census.gov/
- Tennessee Department of Education. Data Downloads & Requests. Data accessed from https://www.tn.gov/education/data/data-downloads.html.
- Tennessee Commission on Children & Youth (TCCY). Tennessee Indicators. The Annie E. Casey Foundation Kids Count Data Center. https://datacenter.kidscount.org/data#TN/2/0/char/0
- U.S. Centers for Disease Control & Prevention. 500 Cities & PLACES Data Portal. https://chronicdata.cdc.gov/browse?category=500+Cities+%26+Places
- Tennessee Secretary of State. Statistical Analysis of Voter Turnout for the November 3, 2020 Election as Submitted by the Counties. [Online] https://sos-tn-gov-files.tnsosfiles.com/2020November.pdf
- U.S. Census Bureau and Opportunity Insights. Analysis of IRS Data. The Opportunity Atlas. Data accessed from https://www.opportunityatlas.org
- U.S. Bureau of Labor Statistics. BLS Reports. Accessed from https://www.bls.gov/opub/reports/
- FBI Uniform Crime Reporting & Tennessee Bureau of Investigation. Tennessee Crime States. Crime Insight TBI. https://crimeinsight.tbi.tn.gov/tops
- America’s Health Rankings. Analysis of U.S. Department of Housing and Urban Development Data. https://www.americashealthrankings.org/explore/annual/measure/severe_housing_problems/state/TN
- U.S. Department of Justice and Tennessee Department of Correction via Vera Institute. 2020-2021 Jail Populations by County. Data accessed on September 13, 2022 from https://trends.vera.org/methodology/.
- U.S. Census Bureau via U.S. Congress Joint Economic Committee. 2015 County Business Patterns. The Social Capital Project. Data accessed on September 12, 2022 from https://www.jec.senate.gov/public/index.cfm/republicans/socialcapitalproject.
- U.S. Census Bureau. Understanding and Using ACS Single-Year and Multiyear Estimates. 2018. https://www.census.gov/content/dam/Census/library/publications/2018/acs/acs_general_handbook_2018_ch03.pdf.