Key Takeaways
- The FY 2023 recommended budget includes unprecedented new spending levels fueled by multiple years of significantly better-than-expected state revenue collections.
- Gov. Lee plans to use about $1.4 billion of new recurring revenue for one-time purposes due to continued fear that recent tax gains may not last.
- The governor’s FY 2023 recommendation is 2.5% (or $1.3 billion) higher than current fiscal year estimates. State spending is 19.9% (or $4.4 billion) higher.
- The Budget projects state tax revenues will grow by 2.5% in FY 2022 – including 2.25% growth in General Fund revenues.
- The largest recurring spending increases are recommended for K-12 education and funding reform, health and social service expansions, and state personnel-related costs.
- The largest non-recurring items include capital improvements and infrastructure, career and technical education, and state employee retirement liabilities.
- The two main rainy day reserves combined would total $2.6 billion in FY 2023 and cover about 47 days of General Fund operations – about 5 days more than before the Great Recession.
On January 31, 2022, Tennessee Governor Bill Lee released his $52.5 billion recommendation for the state’s FY 2023 Budget – along with re-estimates and recommended changes for FY 2022. (1) Budgets reflect policymakers’ goals, the public goods and services intended to help meet those goals, and detailed plans to finance them. It is now the job of the legislature to consider and act on this recommendation.
General Fund Overview
The FY 2023 recommended budget includes unprecedented new spending levels fueled by multiple years of significantly better-than-expected state revenue collections. State policymakers have budgeted more conservatively than usual since 2020 due to uncertainty about consumer spending during the COVID-19 pandemic. To date, revenues have significantly exceeded their cautious estimates – leading to large surpluses and mid-year budget increases (Figure 1).
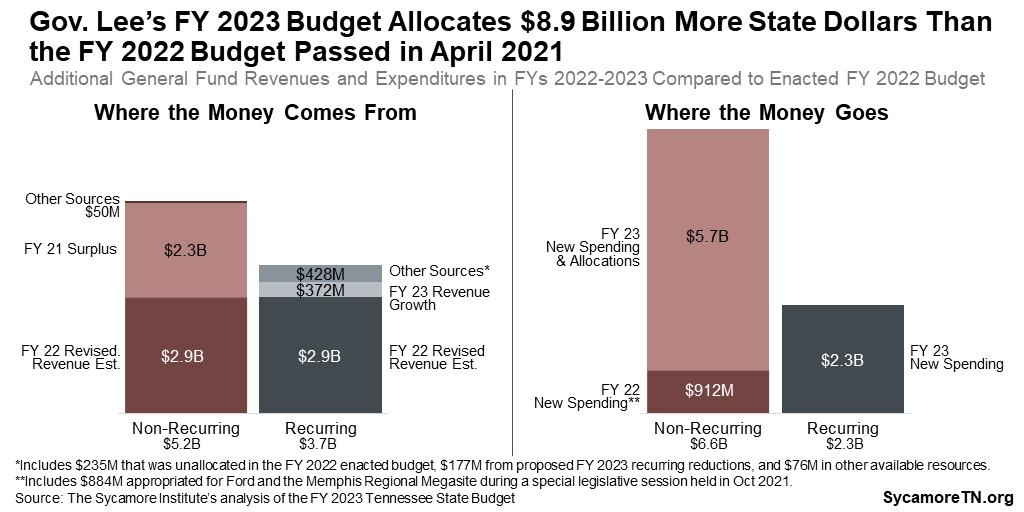
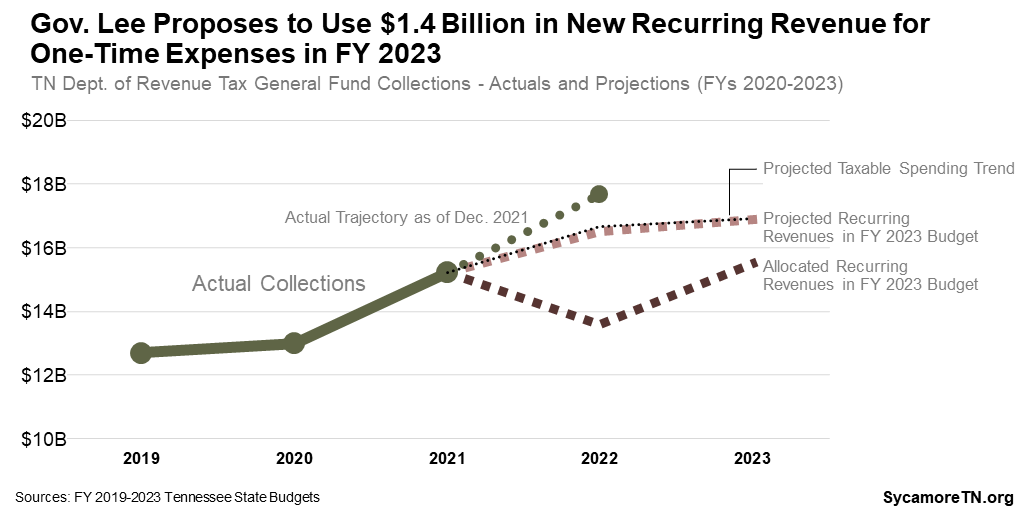
Compared to the current budget, Gov. Lee’s recommendation uses $8.9 billion in additional General Fund dollars – mostly from higher-than-expected revenue growth in FY 2022 (Figure 2). The Lee administration now expects to collect $2.9 billion more revenue this fiscal year than originally estimated – plus another $372 million next year (Figure 2). Five months into the current fiscal year, the state has already collected about $1.5 billion more in General Fund revenues than lawmakers budgeted. (2) Another $2.8 billion comes from: the FY 2021 end-of-year surplus, certain program spending reductions, money that was unallocated in the FY 2022 budget, and other revenues and balances. (3)
Figure 1
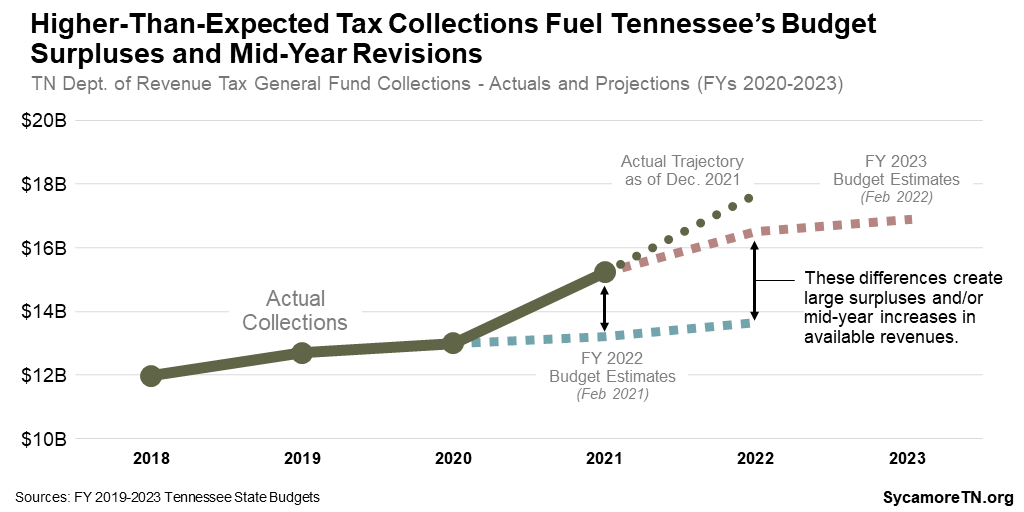
Figure 2
Gov. Lee plans to use about $1.4 billion of new recurring revenue for one-time purposes due to continued fear that recent gains may not last (Figure 2). Some of our better-than-expected collections come from higher sales of durable goods (e.g., sporting goods, appliances, furniture), which may not translate to sustained, long-term revenue growth. (5) Indeed, state economists from the University of Tennessee expect durable goods purchases to fall in FY 2023. However, they still expect overall taxable spending to rise (Figure 3) – a trend reflected in the governor’s projections (Figure 4). (6)
Figure 3
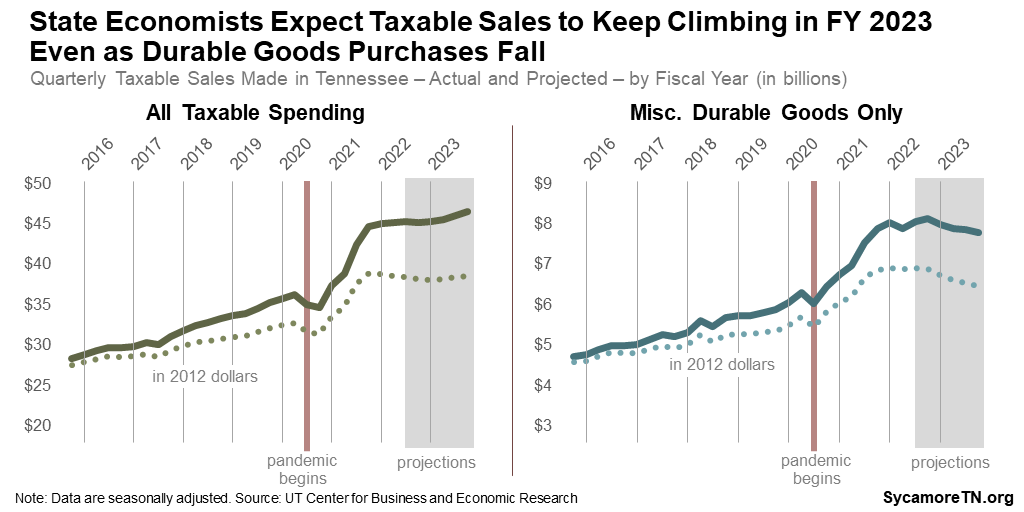
Figure 4
Changes to the FY 2022 Budget
The Budget reflects $912 million of supplemental spending in FY 2022, the current fiscal year – including the $884 million already allocated to Ford and the West Tennessee Megasite (Figure 5). Governors make supplemental requests in most years because actual revenues and spending needs often end up higher or lower than originally estimated.
Figure 5
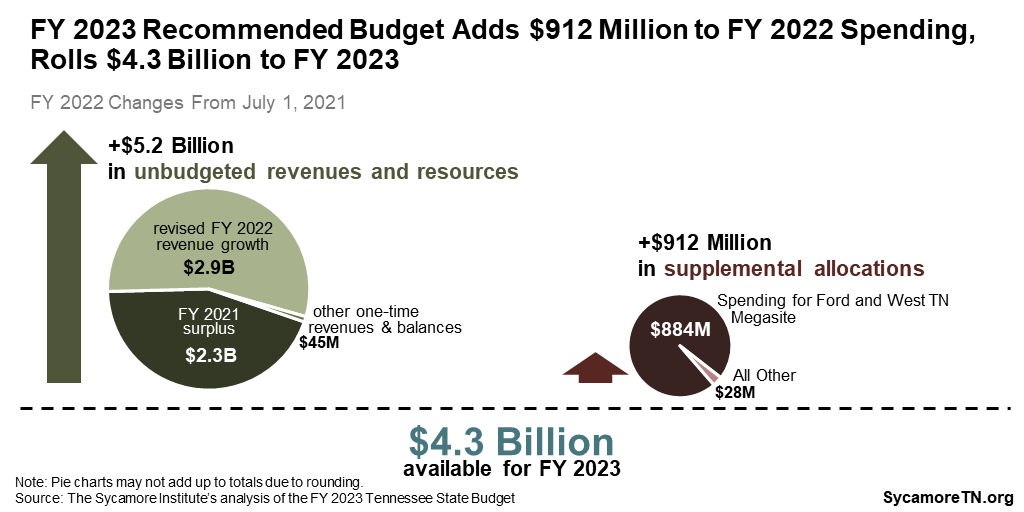
The Budget also anticipates $5.2 billion more money available for FY 2022 than was budgeted when the fiscal year began last July. These funds primarily consist of a $2.3 billion surplus from FY 2021 and $2.3 billion in unbudgeted FY 2022 revenue collections, as discussed earlier. Some of this money funds the supplemental spending items discussed above, while the remaining $4.3 billion will roll over to FY 2023 as non-recurring revenue to pay for the non-recurring recommendations discussed later.
The FY 2023 Recommended Budget
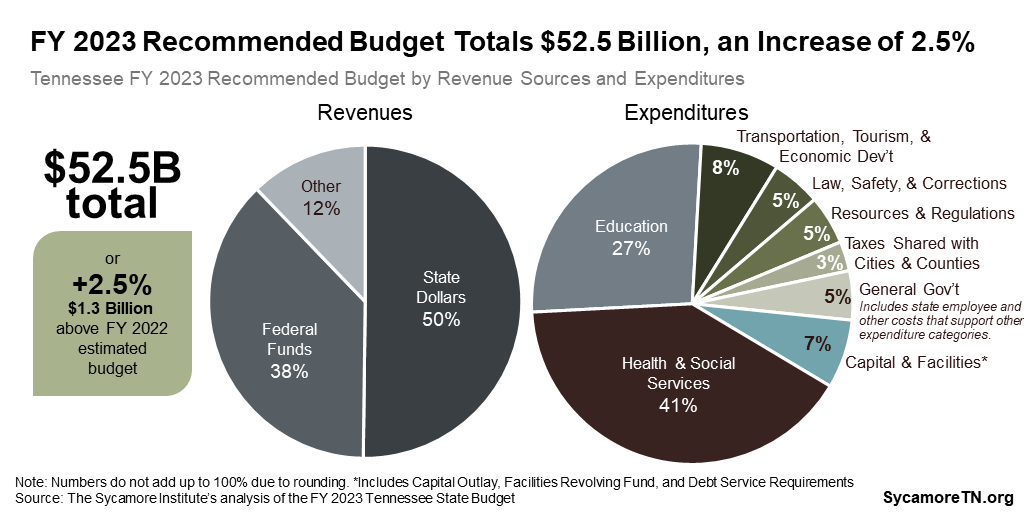
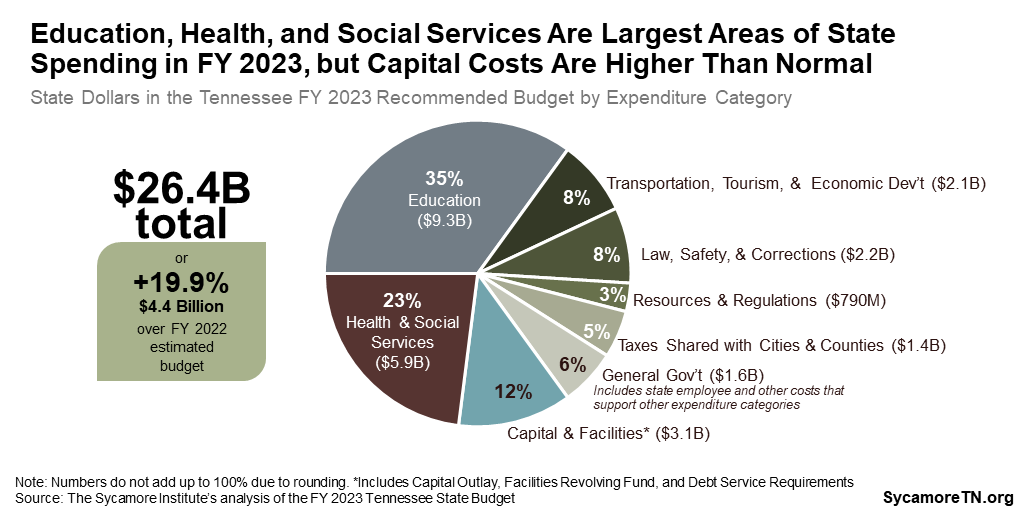
The FY 2023 recommended budget totals $52.5 billion from all revenue sources, an increase of 2.5% (or $1.3 billion) above estimates for the current fiscal year. The funding mix is 50% state dollars, 38% federal funding, and 12% from tuition and other sources. Education (27%) and Health and Social Services (41%) account for nearly three-quarters of total expenditures (Figure 6).
Figure 6
State dollars in the recommended budget total $26.4 billion, an increase of 19.9% (or $4.4 billion) from the current year. State taxes come mostly from sales tax (47%) and taxes on businesses (15%). At 16%, balances from prior fiscal years play a much larger role than usual in funding the recommended budget (Figure 7). Education (35%) and health and social services (23%) account for nearly 60% of expenditures from state appropriations. Spending on capital and facilities takes up a larger-than-usual amount of state spending (Figure 8).
Figure 7
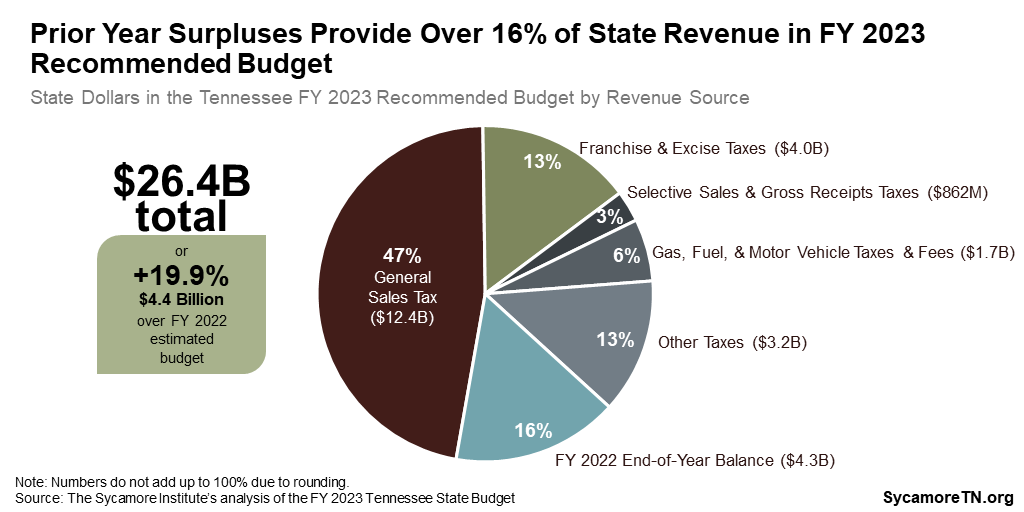
Figure 8
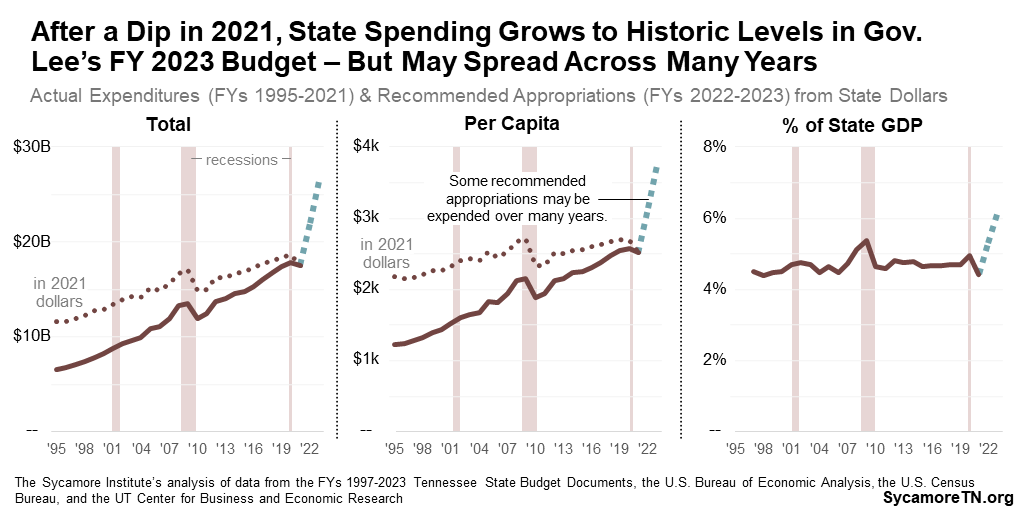
After a small dip in FY 2021, state appropriations rise to historic levels in the FY 2023 recommended budget – but much of the new spending will occur over multiple years. This budget recommends unprecedented state appropriation levels – even after adjusting for inflation and projected economic and population growth (Figure 9). (1) (4) (7) (8) (9) (10) (6) However, multi-year infrastructure and capital projects account for about half of this new spending. Once the proposed appropriations become actual expenditures in future years, the apparent spike shown in Figure 9 will likely smooth out.
Figure 9
The General Fund in Context
The administration’s budget document and presentations often focus on state dollars in the General Fund, which accounts for 77% of all state spending in this recommendation (Figure 10). That number does not include state appropriations for the Capital Outlay Program and Facilities Revolving Fund, which many discussions and calculations lump in with the General Fund because they are partly paid for with General Fund revenue.
Figure 10
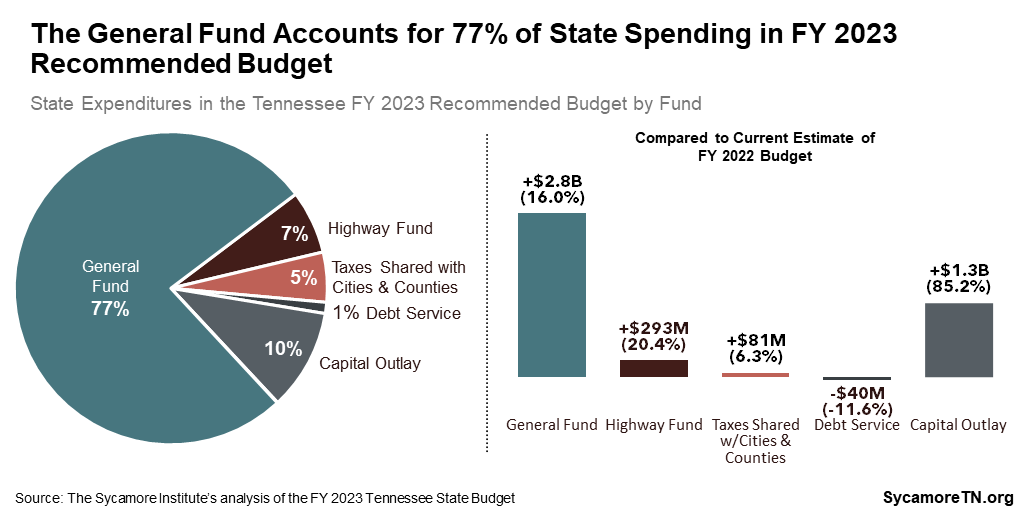
Figure 11
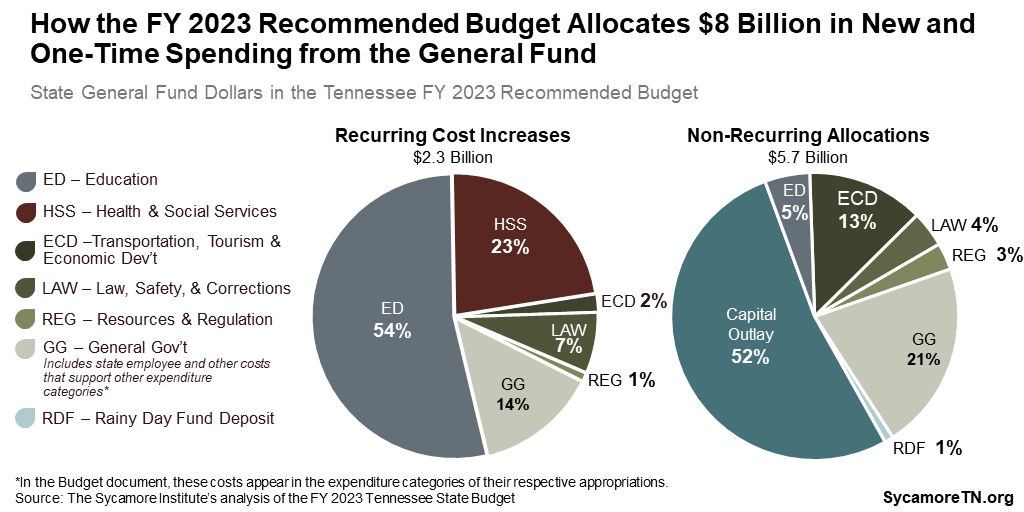
Recommended Increases and One-Time Spending
The Budget recommends $2.3 billion in recurring General Fund spending increases and a total of $5.7 billion in non-recurring spending and allocations (Figure 11).
The Budget’s Largest Recurring Increases
- +$1.0 billion for K-12 education, including a $750 million placeholder for education finance reform, +$125 million for teacher pay, and +$70 million to fund Basic Education Program (BEP) formula growth.
- +$375 million to maintain and expand access to health and social services. These activities will draw down about $2.1 billion additional federal dollars.
- +$276 million for personnel-related costs for state employees like salaries and health insurance (excluding those for K-12 and higher education).
- +$216 million for higher education, including salary increases and outcomes-based formula boosts for state colleges and universities that have achieved greater productivity.
- +$100 million for inflationary increases for health care services and corrections.
The Budget’s Largest Non-Recurring Allocations
- $4.3 billion for infrastructure, capital, technology and equipment investments across state government (excluding those related to career and technical education), including $2.8 billion for the state’s capital outlay program, a $623 million transfer to the Highway Fund, and $200 million to replace public schools located in flood zones.
- $761 million to expand access to career and technical education in both K-12 and post-secondary.
- $700 million in deposits for the state’s rainy day fund and state employee retirement liabilities.
- $214 million to increase law enforcement recruitment and training and address violent crime.
- $154 million for higher education (excluding capital and career and technical education), most of which will support the University of Memphis and a partnership between the University of Tennessee and Oak Ridge National Laboratories.
Summary of Gov. Lee’s Policy Initiatives
Gov. Lee’s policy initiatives affect the FY 2023 recommended budget in a significant way. The recurring and one-time spending plans discussed in the previous section include the costs summarized below. As noted above, many of these proposed expenses would occur over multiple years.
K-12 Education Funding
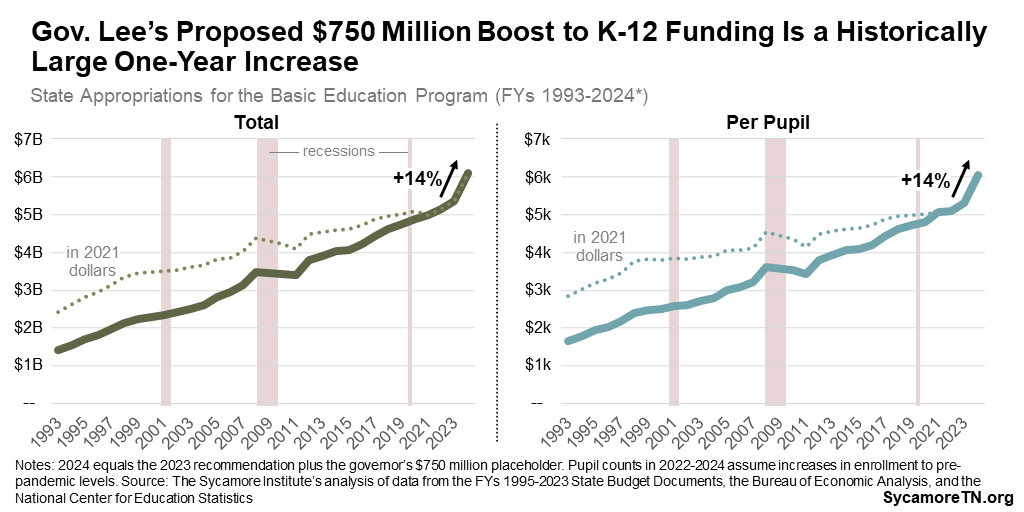
The increases for K-12 education include a $750 million recurring placeholder associated with ongoing efforts to reform the state’s school funding formula. The governor is expected to unveil a proposal soon to change how Tennessee distributes state funds to local school districts. Even if lawmakers enact those changes in the next few months, the new formula likely would not take effect until FY 2024. For this reason, the governor proposes to spend that $750 million on other one-time expenses in FY 2023 and leave it unallocated for FY 2024.
The governor’s proposal represents a historically large one-year increase in K-12 funding (Figure 12). Altogether, state funding for local school districts would reach $6.1 billion in FY 2024 – 14% above the proposed FY 2023 BEP level. (4) (1) (7) (11)
Figure 12
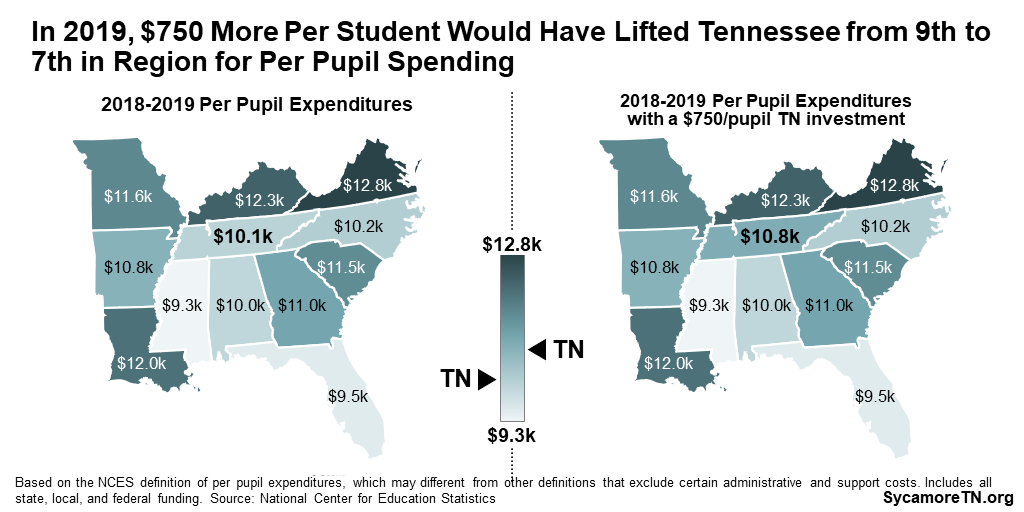
A $750 million investment translates to roughly $750 more per student in Tennessee. Holding all else equal, spending $750 more per pupil in the 2018-2019 school year would have lifted Tennessee from 9th in our 12-state region to 7th for per pupil spending from all revenue sources – or roughly equal to Georgia and Arkansas (Figure 13). (12)
Figure 13
Infrastructure, Capital, Technology, and Equipment
The governor’s recommendation includes a total of $4.3 billion ($49 million recurring, $4.3 billion non-recurring) for infrastructure, capital projects, maintenance, technology, and equipment. That amount excludes investments for similar purposes to expand career and technical education (discussed below).
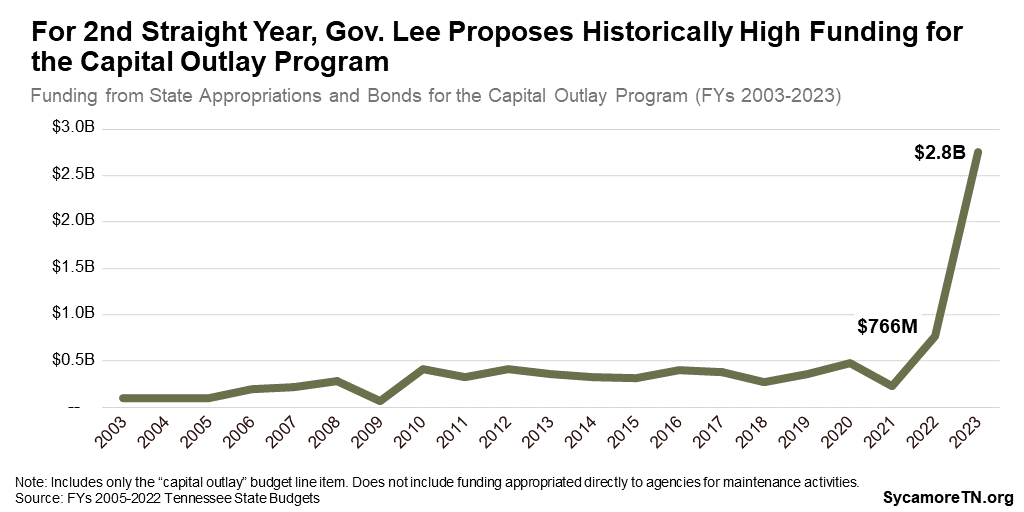
The Budget allocates $2.8 billion for the state’s Capital Outlay program – its highest ever funding level (Figure 14). All construction and maintenance projects that cost $100,000 or more are funded through the Capital Outlay program, and the state’s Capital Outlay needs have been growing for years. Gov. Lee recommends $1.6 billion for improvements and major maintenance for state buildings, $904 million for higher education facilities, and $250 million earmarked for Tennessee State University. The previous Capital Outlay record was a $766 million allocation in FY 2022.
Figure 14
The recommendation also includes a $623 million one-time General Fund subsidy for the the Highway Fund to help it better keep up with inflation. The Highway Fund is primarily financed by gas and fuel taxes – which are excise taxes that do not grow with inflation. As a result, Highway Fund revenues are only expected to grow by a total of 3.1% between FYs 2020 and 2023. Meanwhile, General Fund revenues are expected to grow by over 30% during that same time period. (1) (4)
$100 million of the subsidy is specifically to expedite projects approved as part of the 2017 IMPROVE Act. In 2017, former Gov. Haslam introduced the IMPROVE Act that, among other things, proposed increasing Highway Fund taxes to complete a backlog of 962 transportation projects over the course of 10 years. The original version would have generated an estimated $278 million in new recurring revenue for the Highway Fund starting in FY 2018. Gov. Haslam also proposed to index the fuel taxes to inflation, which would have increased those revenues in step with rising prices.
The enacted IMPROVE Act raised taxes by less than first proposed, which extended the timeline to complete the approved projects. The law also phased in its tax increases over three years and did not include automatic inflation adjustments. As a result, the final IMPROVE Act was expected to bring in about $250 million less to the Highway Fund than the original proposal in the first three years alone. (13) (14)
Other infrastructure highlights include:
- $200 million non-recurring to relocate 14 public schools across the state that are currently in flood plains.
- $222 million non-recurring for already approved capital projects that were going to be financed with bonds. This will reduce the state’s debt and interest payments by about $24 million.
Technology and equipment investments make up another $454 million, including a $47 million recurring increase and $407 million non-recurring. The largest expenses are:
- $179 million ($0.5 million recurring, $179 million non-recurring) for the Tennessee Highway Patrol’s Tennessee Advanced Communications Network
- $170 million non-recurring to replace the Enterprise Resource Planning Systems at the state’s public colleges and universities.
Career and Technical Education
Governor Lee proposes $769 million to expand career and technical education (CTE) in both K-12 and post-secondary – including $8 million recurring and $761 million non-recurring.
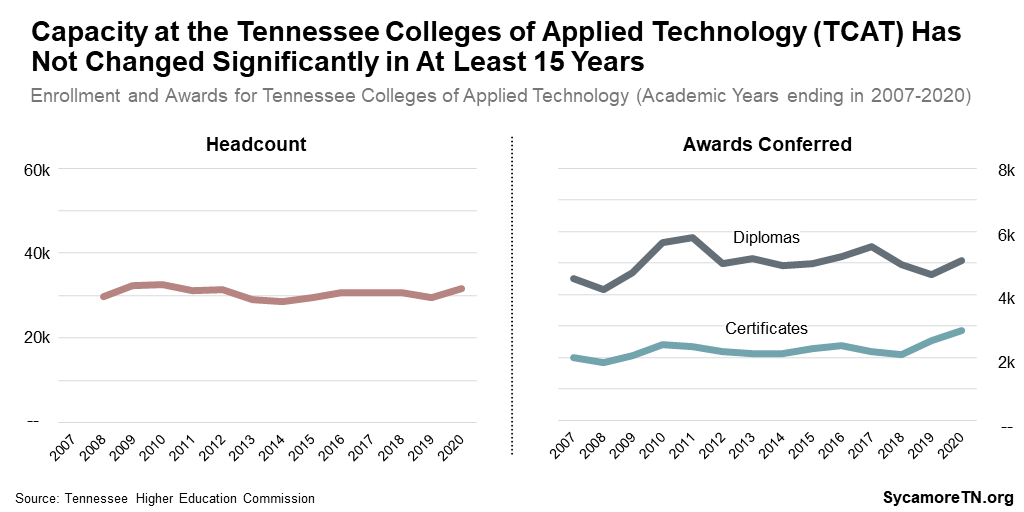
That amount includes $219 million to increase capacity at Tennessee’s Colleges of Applied Technology (TCATs). In addition to $200 million non-recurring for new facility and equipment upgrades, Gov. Lee also proposes $19 million ($8 million recurring, $11 million non-recurring) for the second year of his initiative to clear the current 11,000-person TCAT waitlist. Lawmakers have already approved $79 million for the first year of that initiative and another $40 million for a new TCAT at the West Tennessee Megasite. In the academic year ending in 2020, TCATs awarded about 5,100 diplomas and 3,800 certificates statewide. However, TCAT capacity has not changed significantly in at least 15 years – the earliest year with readily available data (Figure 15). The administration hopes to double current capacity by 2026.
Figure 15
Other CTE-related proposals include:
- $500 million non-recurring for grants to middle and high schools to improve their ability to provide career and technical education.
- $40 million non-recurring for a third round of GIVE Community Grants. The Governor’s Investment in Vocational Education (GIVE) supports regional public-private partnerships meant to address local skills gaps and workforce development. The two prior grant rounds totaled $50 million.
- $10 million non-recurring for SPARC (Supporting Post-Secondary Access in Rural Counties) grants meant to help rural communities purchase CTE equipment.
K-12 Teacher Pay
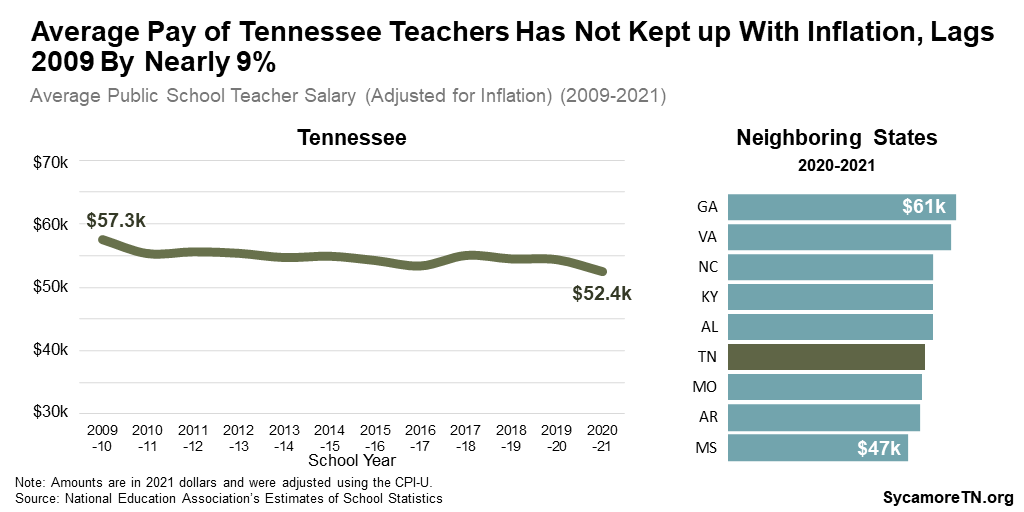
The new funds for K-12 education also include a $125 million recurring increase in the state’s contribution to teacher salaries. Between FY 2016 and FY 2022, lawmakers enacted a total of $549 million in recurring increases for teacher pay (Figure 16). During that time, growth in Tennessee teachers’ average pay began to catch up with inflation but lost ground in 2020-2021. After adjusting for inflation, teachers’ average pay during the 2020-2021 school year was still about 8.9% lower than about a decade earlier (Figure 17).
Figure 16
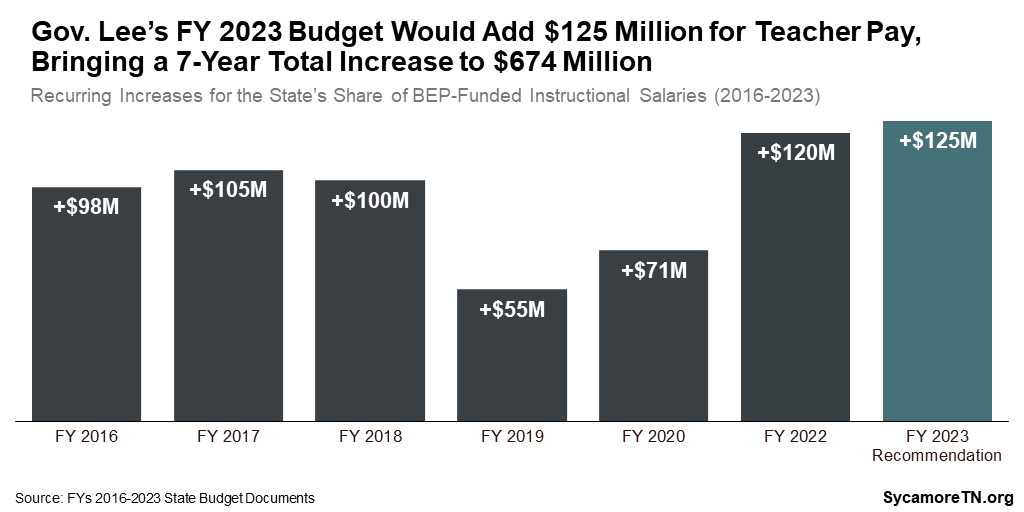
Figure 17
State-funded salary increases haven’t always translated to the teacher raises policymakers hoped to provide. The state awards these funds to local districts through a component of the BEP that supports instructional pay. Local school districts make all decisions about teacher salaries so long as they meet the state’s floor for teacher pay (currently set at $38,000). (19) State policymakers have long expressed frustration that past increases for salary increases did not always translate to an equivalent boost in pay for all classroom teachers. Listed below are several reasons why that can happen, which policymakers may want to keep in mind as they consider changing the state’s education funding formula.
- Local Flexibility – The BEP is often described as “a funding formula, not a spending plan.” The BEP’s different components drive overall state funding to each school district, but local districts have flexibility in how they actually spend that money. (20)
- Local Match – State BEP funds only cover a portion of local education costs. (20) For a 4% increase in the state contribution to become a 4% paycheck boost, for example, local districts would also have to raise their own spending on BEP-funded teacher salaries by 4%.
- BEP Definitions – The instructional salary component of the BEP includes all personnel who are certified to teach, which can include both classroom teachers and administrators. (21)
- Non-BEP Teachers – Nearly all school districts employ more classroom teachers than they get funding for from the BEP. (21) As a result, across-the-board teacher raises would require most local districts to spend even more than what it takes to match BEP funds from the state.
Reducing Post-Secondary Costs
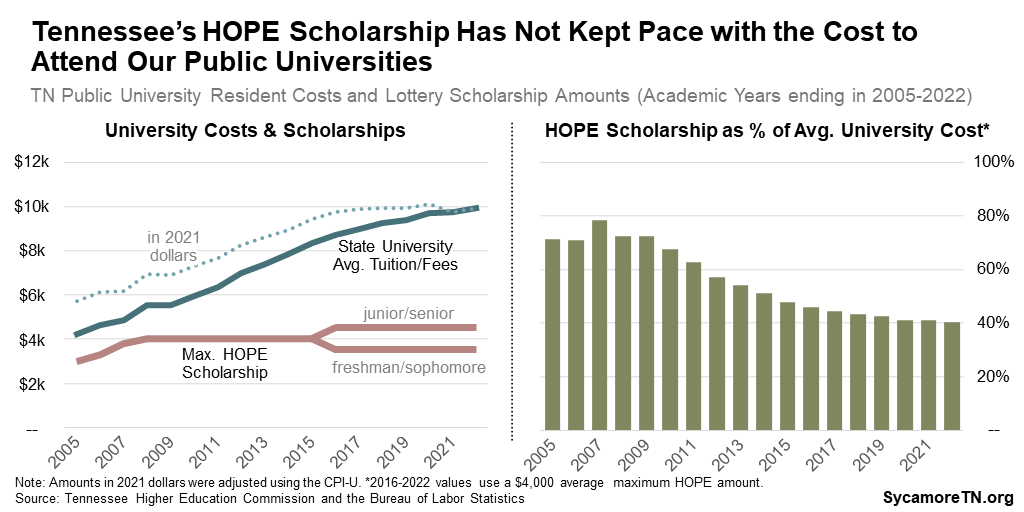
Gov. Lee’s budget includes funding to both prevent tuition hikes at the state’s public colleges and universities and increase lottery-funded scholarships. This includes $90 million recurring for the funding formula that finances Tennessee’s public universities and community colleges. Another $88 million from earnings on the state’s lottery fund would cover an increase in the maximum base HOPE Scholarship. Recipients of the traditional HOPE Scholarship can receive up to $3,500 as freshmen/sophomores and $4,500 as juniors/seniors for 4-year universities or $3,000 at 2-year schools. (22) The recommendation would increase these amounts to $5,100 at 4-year universities and $3,200 at 2-year schools. (1)
This additional money would narrow the growing gap between the state’s largest scholarship program and the average cost of attending a public university. When the HOPE Scholarship first launched, it covered between about 70-80% of average public postsecondary tuition and fees. Beginning around Fall 2009, tuition steadily climbed while the scholarship amounts remained flat for both 4-year and 2-year schools. Changes that took effect in Fall 2015 associated with TN Promise increased HOPE’s coverage of community college costs. For public universities, however, the average value of the HOPE Scholarship continued to fall (Figure 18). Gov. Lee’s proposal would increase HOPE’s coverage of average public university costs from 35-45% in the current academic year to about 51% for 2022-2023.
Figure 18
Access to Health and Social Services
The Budget includes $384 million to secure and expand access to health and social services, including a $375 million recurring increase and $9 million in non-recurring spending. The budget also reflects an increase of $2.1 billion in federal dollars for this purpose.
The recommendation includes $67 million in new recurring state spending and $124 million in additional federal dollars to expand home and community-based services.
- A total of $130 million ($12 million state, $118 million federal) will fund TennCare long-term services and supports for about 2,300 people who have intellectual and developmental disabilities and are currently on waiting lists. The federal government is picking up a larger share of these costs than usual under provisions of the American Rescue Plan (23), so the state will start picking up $33 million of the federal share of those costs in FY 2024.
- A total of $94 million ($55 million state, $39 million federal) will support the Medicaid Alternative Pathways to Independence initiative spread across three agencies. Nearly 6,000 Tennesseans will receive a limited set of home and community-based services meant to help individuals who are older or have physical, intellectual, or developmental disabilities to live independently in the community – potentially avoiding the need for costlier TennCare services.
Other highlights include:
- $91 million recurring to increase payment rates for a variety of service providers – including behavioral health, dental, family and support, and community-based services. This money will draw down an additional $115 million federal match.
- $57 million recurring for foster care and adoption supports for youth and families. These dollars will bring in an additional $6 million in federal funds.
- $38 million recurring to support the Tennessee Early Intervention System, including an additional year of eligibility for covered services. Currently, TEIS provides services like occupational, physical, and speech therapy to over 8,000 children up to age 3 who have disabilities or other developmental delays. (24)
- $37 million to expand access to dental services – including $26 million recurring for TennCare to expand dental coverage to every adult enrollee, which will draw down an additional $50 million in federal dollars. The remaining $12 million non-recurring will support a dental services pilot program meant to increase the supply of dentists.
- The budget also reflects $1.7 billion in new federal funds for federally-mandated increases to Supplemental Nutrition Assistance Program (SNAP) benefits that took effect on October 1, 2021. (25)
Covering Long-Term Retiree Liabilities
Gov. Lee recommends a $650 million one-time deposit to the trust funds that help pay for state employee retirement benefits. This includes $350 million for pension liabilities in the Tennessee Consolidated Retirement System (TCRS) and $300 million for other post-employment benefits (OPEB) like health insurance. Another $250 million transfer to TCRS has already been approved for the current year.
State employee retiree costs are long-term financial obligations that – without proper planning – could lead to tax increases, spending cuts, or underfunded benefits down the road. Like all states, Tennessee maintains trust funds for this purpose financed by employee and employer contributions and premiums, earned income from investments, and state appropriations. The state makes long-term projections of what paying these obligations will cost and how much of that cost dedicated revenues will cover.
The proposed one-time General Fund deposit to TCRS will not draw in other revenues that typically help fund employer retirement contributions. For its routine employer contributions to these funds, the state can sometimes use federal dollars or other program-specific revenues that help cover a program’s administrative costs. (26) However, one-time General Fund transfers do not trigger these other funding sources. As a result, funding retirement benefits in this way may ultimately require more General Fund revenue than if the state increased its employer contribution.
Tennessee is already among the best states in the nation for funding its pension liabilities. (27) (28) According to July 2021 projections, the state had funded 91% of its $17.7 billion long-term pension liability. (29) According to Pew, Tennessee is one of only five states that meet all best practice criteria for projecting, planning, funding, and managing its pension liabilities. (30)
Tennessee had funded about 25% of its $1.1 billion in long-term OPEB liabilities, according to July 2021 projections. (31) Tennessee only began pre-funding these obligations in FY 2019 and now makes a $72 million recurring deposit for this purpose.
Recommended Spending Reductions
The Budget recommends -$117 million in recurring General Fund reductions. These include:
- -$72 million from the Department of Correction to reflect a change required by state law last year to how the department budgets for its capital needs.
- -$25 million from the BEP associated with an adjustment in pension rates.
- -$20 million from TennCare to reflect lower enrollment in one of it’s programs and duplication of certain behavioral health services covered by the Department of Mental Health and Substance Abuse Services.
Funds Reserved for Legislative Action
The Budget reserves $10 million recurring and $20 million in non-recurring funds for initiatives and amendments of the legislature. Another $10 million recurring and $20 million in non-recurring funds are reserved for the Administration Amendment expected later in the legislative session. (3)
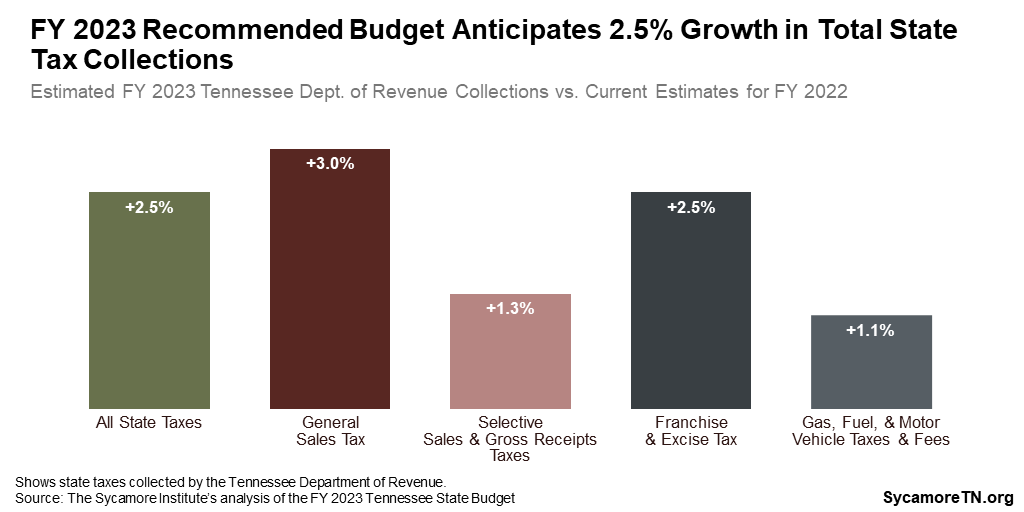
State Tax Revenue Growth
The Budget expects total state tax collections to grow by 2.5% (or $487 million) in FY 2023. The State Funding Board recommended a range of 2.0-2.4% growth in the recurring state tax revenues based on expert estimates that ranged from 1.9-5.5%. (1) Recurring General Fund revenues – which make up about 86% of all Department of Revenue state tax collections – are expected to grow by 2.25% in FY 2023 (Figure 1).
Revenue Growth Highlights
The direction and degree of expected change varies by revenue type (Figure 19):
- +3.0% gain ($360 million) in general sales tax collections
- +1.3% gain ($11 million) in selective sales and gross receipts taxes collections
- +2.5% gain ($97 million) in franchise and excise tax collections from businesses
- +1.1% gain ($18 million) in gas, fuel, and motor vehicle taxes and fees collections
Figure 19
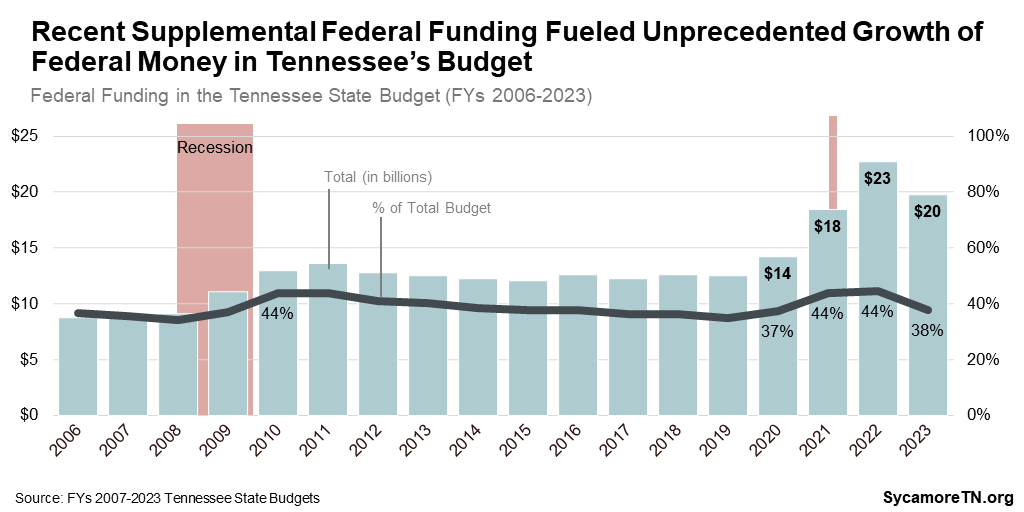
The FY 2023 Budget reflects the historically high levels of federal funding the state has received in recent years from multiple rounds of coronavirus relief and other federal aid. State budget estimates for FY 2022 reflect an historic amount of federal funding (Figure 20). The state’s budget is projected to be about as reliant on federal funding this fiscal year as it was in the wake of the Great Recession.
Figure 20
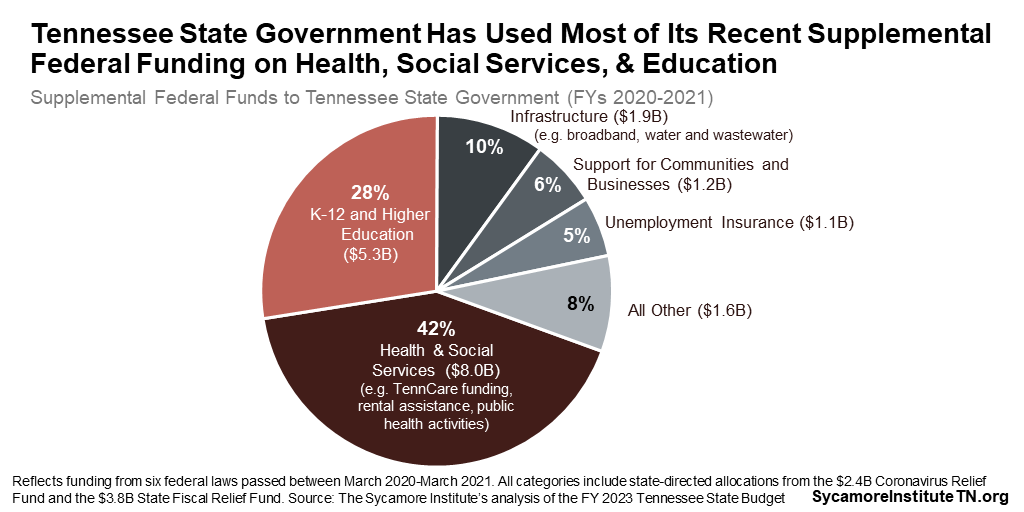
The Budget estimates state agencies have received $19.3 billion from recent federal supplemental funding packages (Figure 21) – including over $6 billion in flexible support. While much of this money has been allocated, spending it will in many cases take several years. Just under 42% of the total is going towards health and social service activities like additional federal support for TennCare, rental assistance, supplemental SNAP (i.e. food stamp) benefits, and public health activities. Another 27% went to K-12 and higher education to respond to the needs and effects of the pandemic. The state will spend the largest portion of its flexible funding – nearly $2 billion – on broadband and water and sewer systems.
Figure 21
These numbers do not reflect the recently enacted Infrastructure Investment and Jobs Act, which increases federal infrastructure funding by over $500 billion between FYs 2022-2026. Tennessee is expected to receive billions in additional federal dollars for water, broadband, transportation, public transit, and other infrastructure. (32) (33)
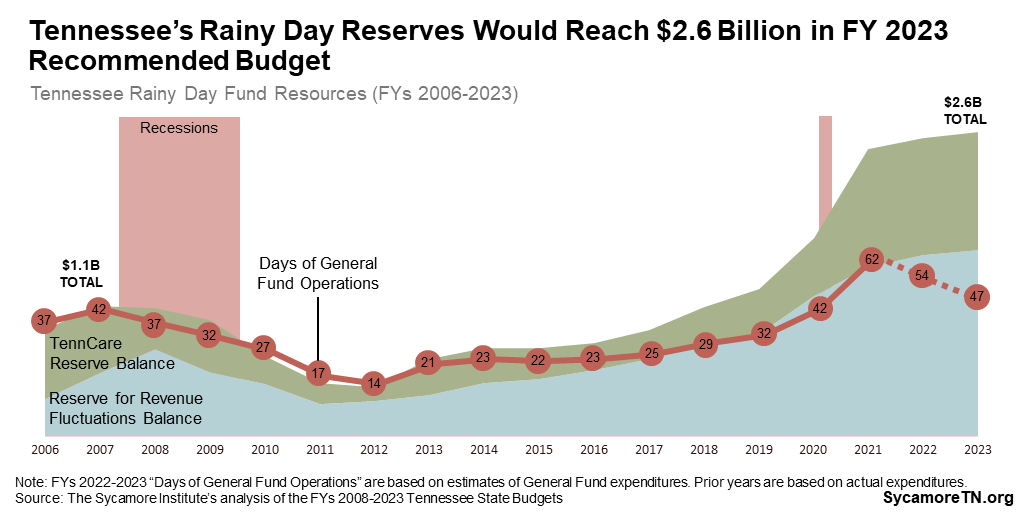
Rainy Day Reserves
The Budget recommends a combined balance of $2.6 billion in the Reserve for Revenue Fluctuations and the TennCare Reserve by the end of FY 2023 (Figure 22). These rainy day reserves are a tool of last resort should Tennessee need to respond to an economic downturn. Reserve balances provide a cushion during a recession, which typically increases demand for state programs and services but decreases the revenues that fund them.
- This combined balance would give the budget about 5 days more cushion than it had just before the Great Recession. At $2.6 billion, the two reserves would cover about 47 days of state-funded General Fund operations at the governor’s recommended FY 2023 levels.
- The Budget hits that mark by adding $50 million to the Reserve for Revenue Fluctuations in FY 2023 This deposit would grow that account to $1.6 billion — the highest dollar amount ever.
- The Reserve for Revenue Fluctuations would exceed its statutory target by $25 million. State law sets a target for that fund at 8% of General Fund revenues, and the FY 2023 recommended balance represents 8.1%[i].
Figure 22
[i] Calculated by adding Department of Revenue and Other State Revenue allocations to the General Fund, Education Fund, and Debt Service Fund minus the Gas Tax allocation to the Debt Service Fund (from page A-65 of the Budget).
References
Click to Open/Close
- State of Tennessee. FY 2022-2023 Budget Document, Volume 1. [Online] January 31, 2022. https://www.tn.gov/content/dam/tn/finance/budget/documents/2023BudgetDocumentVol1.pdf
- Tennessee Department of Finance and Administration. December Revenues. [Online] January 14, 2022. https://www.tn.gov/finance/news/2022/1/14/december-revenues.html.
- —. Budget Overview: Fiscal Year 2022-2023. [Online] February 1, 2022. https://www.tn.gov/content/dam/tn/finance/budget/documents/overviewspresentations/23AdReq13.pdf
- State of Tennessee. FYs 1997-1998 to 2021-2022 Budget Documents, Volume 1. [Online] Available from https://www.tn.gov/finance/fa/fa-budget-information/fa-budget-archive.html and the Tennessee State Libary and Archives.
- Senate Finance, Ways, and Means Committee . Hearing on the FY 2023 Budget with Finance and Administration Commissioner Butch Eley. [Online] February 1, 2022. Video available at https://tnga.granicus.com/MediaPlayer.php?view_id=614&clip_id=2587.0
- University of Tennessee Boyd Center for Business and Economic Research. An Economic Report to the Governor of the State of Tennessee: The State’s Economic Outlook 2022. [Online] December 2021. https://haslam.utk.edu/wp-content/uploads/2021/12/ERG2022.pdf
- U.S. Bureau of Economic Analysis. Gross Domestic Product: Chain-type Price Index. [Online] February 3, 2022. Retrieved from FRED, Federal Reserve Bank of St. Louis at https://fred.stlouisfed.org/series/GDPCTPI.
- —. Real GDP by State (Millions of Chained 2012 Dollars). [Online] February 3, 2022. Accessed from https://apps.bea.gov/itable/iTable.cfm.
- U.S. Census Bureau . State Mid-Year Population Estimates. [Online] Accessed from https://www.census.gov/programs-surveys/popest/technical-documentation/research/evaluation-estimates.html.
- University of Tennessee Boyd Center for Business and Economic Research. 2018 to 2017 Tennessee Population Projection. [Online] February 3, 2022. https://myutk.maps.arcgis.com/apps/opsdashboard/index.html#/cbf0d40870304807a0de26ddf6779604.
- National Center for Education Statistics. Total Enrollment (Excluding Adult Education) for SYs 1992-1993-2020-2021. [Online] February 3, 2022. Accessed from https://nces.ed.gov/ccd/elsi/tableGenerator.aspx.
- —. National Public Education Financial Survey (NPEFS), School Year 2018–19. [Online] February 4, 2022. Data and documentation retrieved from https://nces.ed.gov/ccd/files.asp#Fiscal:1,LevelId:2,SchoolYearId:33,Page:1.
- State of Tennessee. Haslam Unveils Comprehensive Tax Cut, Transportation Proposal. [Online] January 18, 2017. https://www.tn.gov/former-governor-haslam/news/2017/1/18/haslam-unveils-comprehensive-tax-cut-transportation-proposal.html.
- Tennessee General Assembly Fiscal Review Committee. Fiscal Memorandum: HB 534-SB1221. [Online] March 16, 2017. https://www.capitol.tn.gov/Bills/110/Fiscal/FM0576.pdf.
- Tennessee Higher Education Commission. Tennessee Higher Education Fact Books for 2009-2021. [Online] Available from https://www.tn.gov/thec/research/fact-book.html.
- —. Statutory Data Report: February 2008. [Online] February 2008. https://www.tn.gov/content/dam/tn/thec/learn-about/ccta/leg-reports/2008/LM2008_StatutoryDataReport2007-08.pdf.
- National Education Association. Annual Rankings and Estimates Reports. [Online] January 30, 2023. Available from https://www.nea.org/research-publications.
- U.S. Bureau of Labor Statistics. Consumer Price Index – All Urban Consumers. [Online] February 1, 2022. Data accessed from https://data.bls.gov/PDQWeb/cu.
- Tennessee Department of Education. State Salary Schedule Effective July 1, 2021. [Online] May 2021. https://www.tn.gov/content/dam/tn/stateboardofeducation/documents/2021-sbe-meetings/may-21%2c-2021-sbe-meeting/5-21-21%20IV%20J%20State%20Minimum%20Salary%20Schedule%20for%20FY%202021-22%20Attachment.pdf.
- Tennessee Comptroller of the Treasury. Basic Education Program. Officesof Research and Education Accountability. [Online] [Cited: February 5, 2020.] https://comptroller.tn.gov/office-functions/research-and-education-accountability/legislative-toolkit/bep.html.
- Bergfeld, Tara and Wesson, Linda. Teacher Salaries in Tennessee, 2015-2018. Tennessee Comptroller of the Treasury, Office of Research and Education Accountability. [Online] April 2019. https://comptroller.tn.gov/content/dam/cot/orea/documents/orea-reports-2019/Salaries_FullReport.pdf.
- Tennessee Higher Education Commission. Tennessee Education Lottery Scholarship Program: Annual Report through Fall 2018. [Online] 2019. https://www.tn.gov/content/dam/tn/thec/bureau/research/other-research/hope/TELS%20Report_Fall%202018_Suppressed_Updated.pdf.
- U.S. Center for Medicare and Medicaid Services. Strengthening and Investing in Home and Community Based Services for Medicaid Beneficiaries: American Rescue Plan Act of 2021 Section 9817 Spending Plans and Narratives. [Online] [Cited: February 8, 2022.] https://www.medicaid.gov/medicaid/home-community-based-services/guidance/strengthening-and-investing-home-and-community-based-services-for-medicaid-beneficiaries-american-rescue-plan-act-of-2021-section-9817-spending-plans-and-narratives/index.html.
- Tennessee Department of Intellectual and Developmental Disabilities. Tennessee Early Intervention System: Rank Order Data for December 1, 2019. [Online] https://www.dropbox.com/s/v98ixdoryj7xmc4/2019-20%20Rank%20Order%200-3.pdf?dl=0.
- U.S. Department of Agriculture. USDA Modernizes the Thrify Food Plan, Updates SNAP Benefits. [Online] August 16, 2021. https://www.usda.gov/media/press-releases/2021/08/16/usda-modernizes-thrifty-food-plan-updates-snap-benefits.
- Wayman, James. TCRS Actuarial Minimum Employer Rate for FY 2021-2022. Tennessee Treasury Department, Tennessee Consolidated Retirement System. [Online] March 3, 2021. https://publicreports.treasury.tn.gov/GASB68_PDFs/2021-Employer%20Rate%20Cover%20Letter.pdf.
- Pew. The State Pension Funding Gap: Plans Have Stabilized in Wake of Pandemic. [Online] September 14, 2021. https://www.pewtrusts.org/en/research-and-analysis/issue-briefs/2021/09/the-state-pension-funding-gap-plans-have-stabilized-in-wake-of-pandemic.
- The Volcker Alliance. State Budget Practice Report Cards: Tennessee. [Online] February 5, 2023. https://www.volckeralliance.org/state-budgets/tennessee.
- State of Tennessee. Tennessee Consolidated Retirement Fund: Schedule of Changes in the State of Tennessee’s Net Pension Liability (Asset) and Related Ratios. FY 2021 Annual Comprehensive Financial Report. [Online] December 2021. https://www.tn.gov/content/dam/tn/finance/acfr/ACFR_fy21.pdf.
- Pew. Pew’s Fiscal Sustainability Matrix Helps States Assess Pension Health. [Online] December 10, 2021. https://www.pewtrusts.org/en/research-and-analysis/issue-briefs/2021/12/pews-fiscal-sustainability-matrix-helps-states-assess-pension-health.
- State of Tennessee. Other Postemployment Benefits: Schedule of Changes in the Net OPEB Liability and Related Ratios. FY 2021 Annual Comprehensive Financial Report. [Online] December 2021. https://www.tn.gov/content/dam/tn/finance/acfr/ACFR_fy21.pdf.
- The White House. Infrastructure Investment and Jobs Act State Fact Sheets: Tennessee. [Online] November 2021. https://www.whitehouse.gov/wp-content/uploads/2021/08/TENNESSEE_Infrastructure-Investment-and-Jobs-Act-State-Fact-Sheet.pdf.
- The Council of State Governments. Infrastructure Investment and Jobs Act: Roads and Bridges. [Online] November 15, 2021. https://www.csg.org/2021/11/15/infrastructure-investment-and-jobs-act-roads-and-bridges/.
- State of Tennessee. Reserve Balance Information from the FYs 2005-2006 to 2022-2023 Budget Documents, Volume 1. [Online] Available via https://www.tn.gov/finance/fa/fa-budget-information/fa-budget-archive.html.
- Tennessee General Assembly. Testimony and Statements before the Senate Finance, Ways, and Means Committee on February 4, 2020 and February 9, 2021. [Online] Video available at http://tnga.granicus.com/MediaPlayer.php?view_id=431&clip_id=21413 and http://tnga.granicus.com/MediaPlayer.php?view_id=614&clip_id=23836.