Key Takeaways
- Compared to current law, Gov. Lee’s budget reflects lower-than-expected tax collections and proposes new spending and tax cuts for FYs 2024-2025 — mostly funded by previously unallocated recurring revenues and a large FY 2023 surplus.
- Spending in the governor’s FY 2025 recommendation from all revenue sources is 16% (or $9.9 billion) lower than FY 2024 estimates. Spending from state revenues is 21% (or $6.6 billion) lower.
- These year-over-year decreases follows historically high spending levels in the last several years — driven by fast revenue growth and billions in federal aid.
- The largest recurring increases are recommended for state personnel-related costs, school funding formula growth, subsidies for private school students, and inflationary increases.
- Gov. Lee proposes a $410 million cut to the franchise tax on businesses. Business tax collections are currently 11% below projections made after prior cuts enacted last year.
- Combined, the two main rainy day reserves would total $3.6 billion in FY 2025 and cover about 59 days of General Fund operations — about 18 days more than before the Great Recession.
On February 5, 2024, Tennessee Governor Bill Lee released his $52.6 billion recommendation for the state’s FY 2025 Budget along with re-estimates and recommended changes for FY 2024. (1) (2) Budgets reflect policymakers’ goals, the public goods and services intended to help meet those goals, and detailed plans to finance them. It is now the legislature’s job to consider and act on this recommendation.
Figure 1
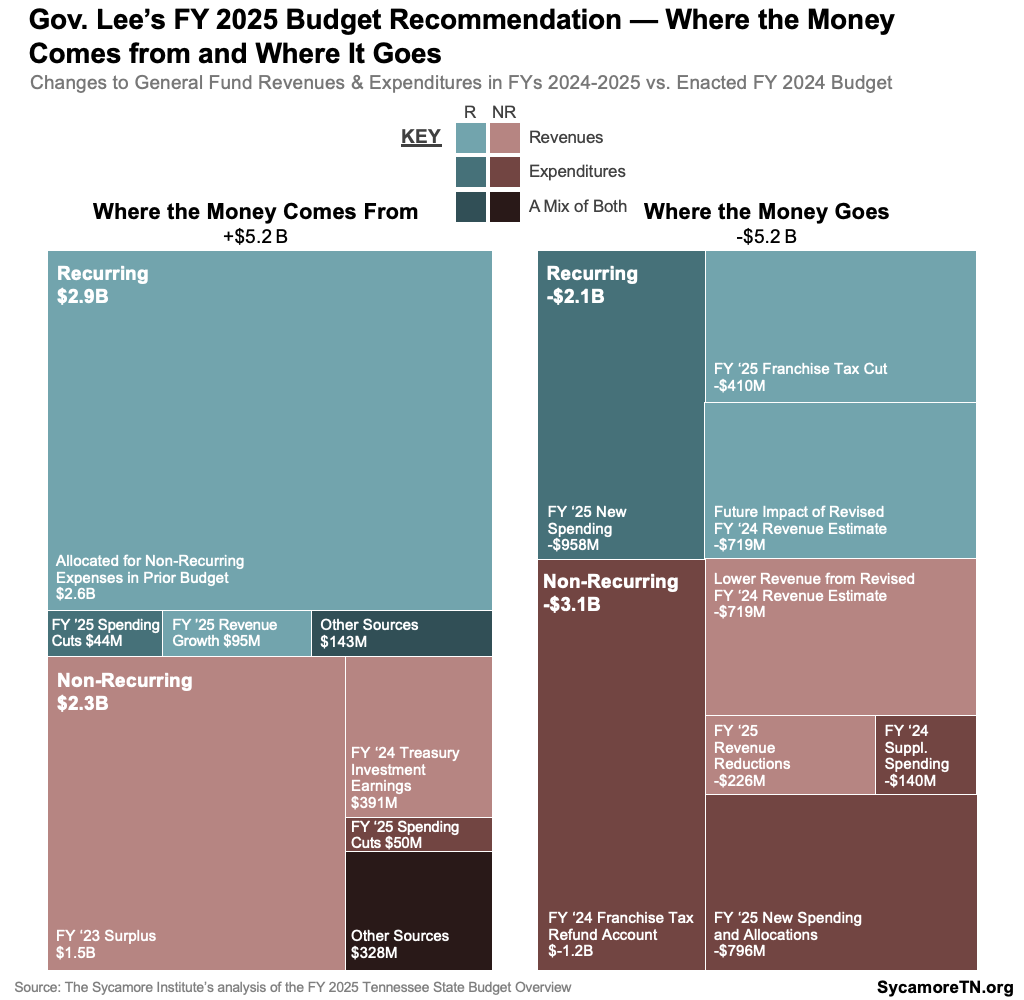
General Fund Overview
Compared to current law, Gov. Lee’s budget reflects lower-than-expected tax collections and proposes new spending and tax cuts for FYs 2024-2025 — funded mainly by previously unallocated recurring revenues and a large FY 2023 surplus. This report discusses the new spending and tax cuts at length throughout. The budget is balanced with (Figure 1):
- $2.6 billion in recurring money used for non-recurring purposes in FY 2024 (discussed below).
- $1.5 billion from the FY 2023 end-of-year surplus (discussed below).
- $391 million from earnings on the Treasurer’s investment of state funds.
- $95 million in new FY 2025 tax growth.
- $94 million from proposed spending reductions — including $44 million recurring and $50 million non-recurring.
- $472 million in other revenues and balances — including $143 million recurring and $328 million non-recurring. The non-recurring revenues include a $74 million transfer from the state’s debt service fund and $50 million in anticipated TennCare reversions (discussed below).
Figure 2
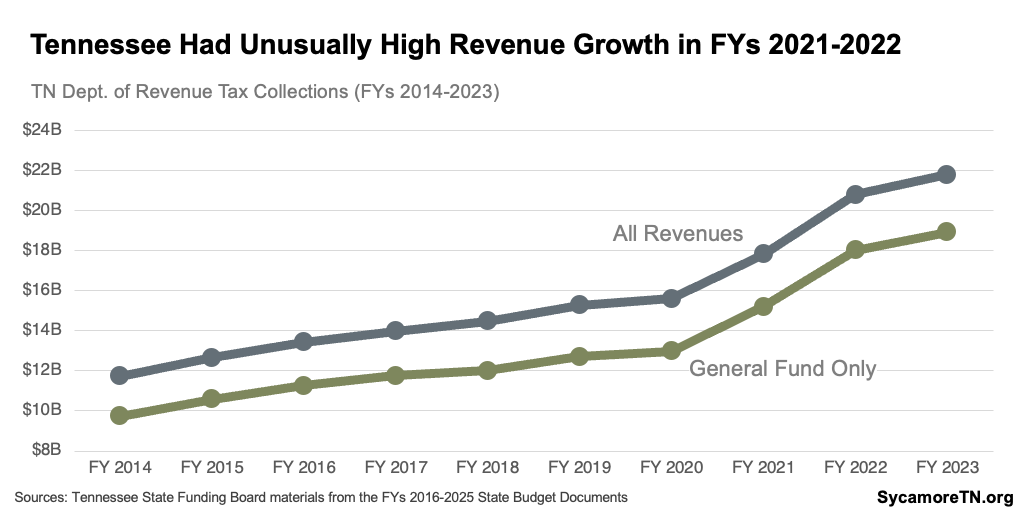
Figure 3
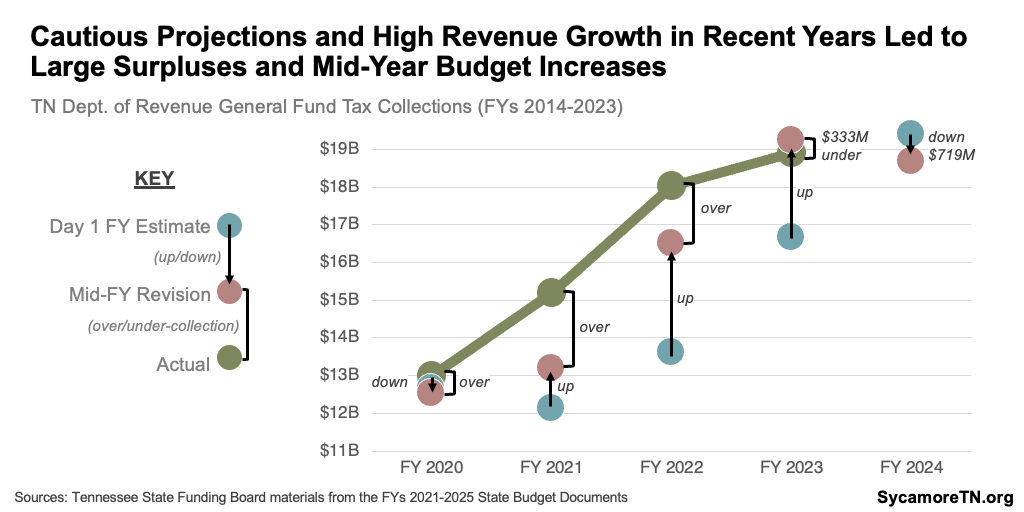
Tennessee fell $333 million short of tax projections in FY 2023, and this Budget anticipates collecting about $719 million less in revenue than initially planned for FY 2024. In FYs 2021 and 2022, state revenues grew swiftly (Figure 2) and significantly exceeded cautious estimates — leading to large surpluses and mid-year budget increases (Figure 3). However, FY 2023 General Fund collections fell short of the mid-year revised estimate by about $333 million. Six months into FY 2024, General Fund revenues are $379 million behind what was budgeted. (4) Given these shortfalls, the FY 2025 Budget predicts lower FY 2024 revenues than originally budgeted and a modest 0.5% growth into FY 2025 (Figure 4).
Figure 4
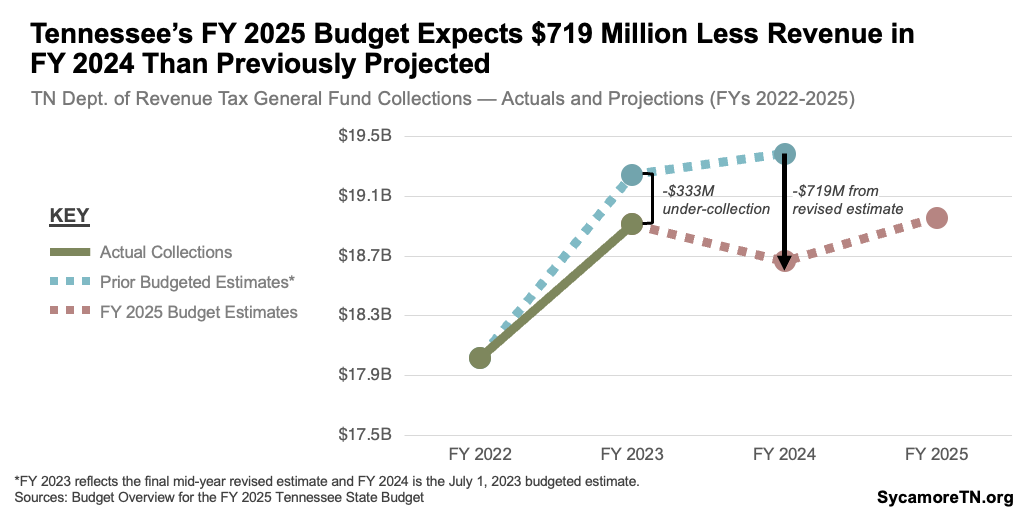
Figure 5
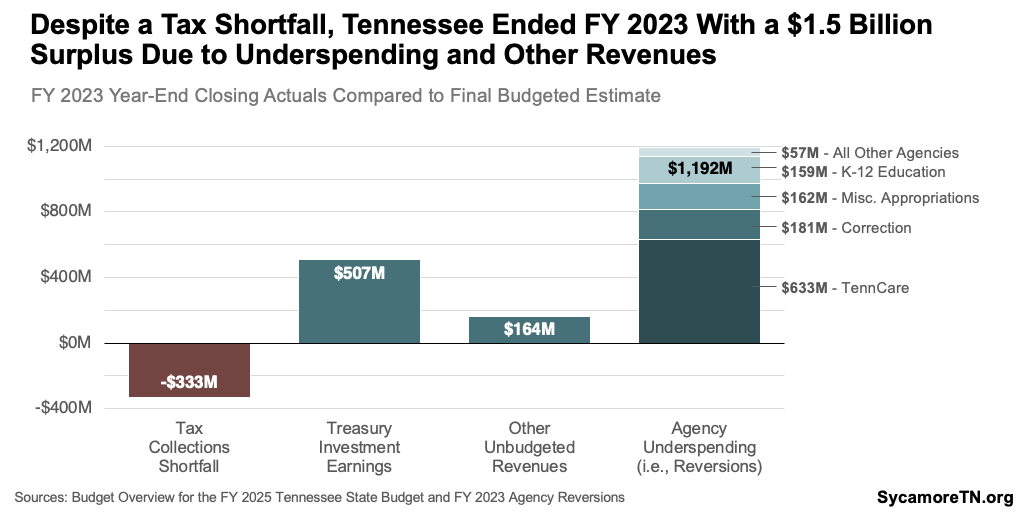
Despite the tax revenue shortfalls, the state ended FY 2023 with another historically large $1.5 billion surplus — largely from unspent program “reversions” (Figure 5). In addition to $507 million in FY 2023 unbudgeted earnings from the Treasurers’ investment of state funds, state agencies reverted about $1.5 billion in unspent money to the General Fund — or $1.2 billion more than expected. Over half of the savings came from TennCare, where the availability of more federal dollars under a COVID-19-related enhanced match rate freed up $633 million in state funds. (6) (5)
When agencies send unspent dollars back to the General Fund at the end of the fiscal year, these are known as reversions. These unspent dollars can come from program and personnel underspending, delayed start-up of recurring initiatives, over-collection of departmental revenues like fees and licenses, and program reserves. Both agency reversions and year-end surpluses have been unusually high in recent years (Figures 6 and 7).
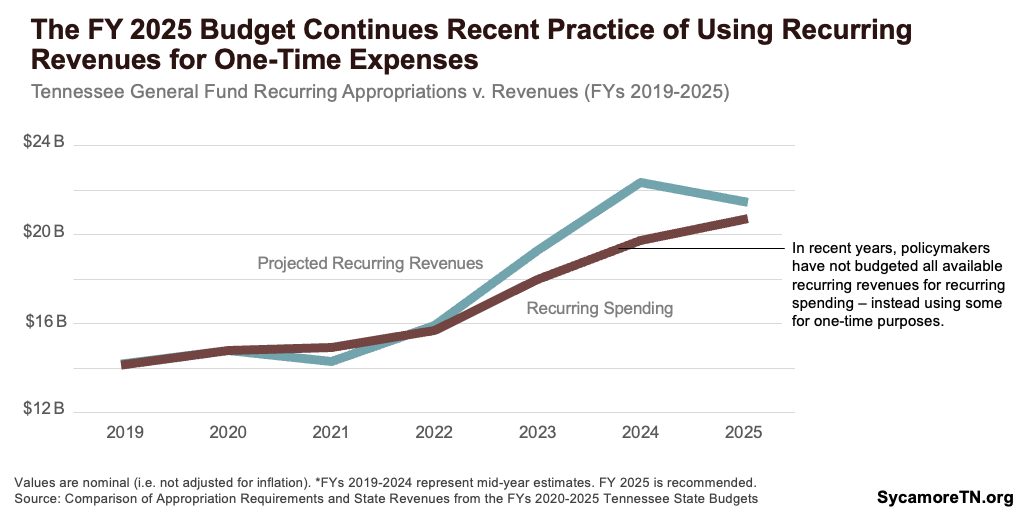
In addition to the FY 2023 surplus, the FY 2025 Budget also draws on $2.6 billion in recurring revenue that prior budgets allocated for non-recurring purposes. The last several budgets have used new recurring revenues for one-time purposes due to fears that revenue collections could slow or decline (Figure 8). By not tying these dollars up for long-term recurring commitments, they remain unallocated for future years. The recommendation continues this practice into FY 2025 by proposing to use about $797 million in expected recurring revenues for one-time purposes.
Figure 6
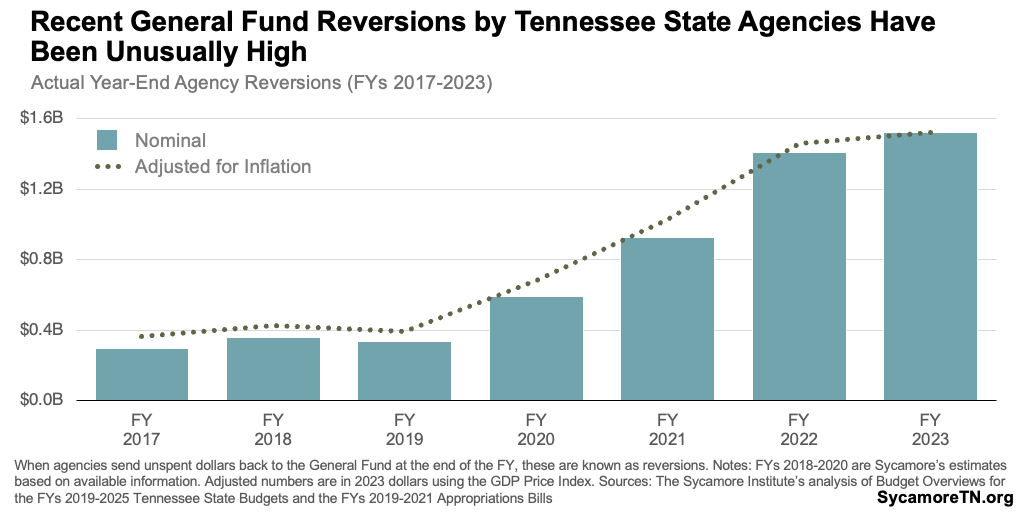
Figure 7
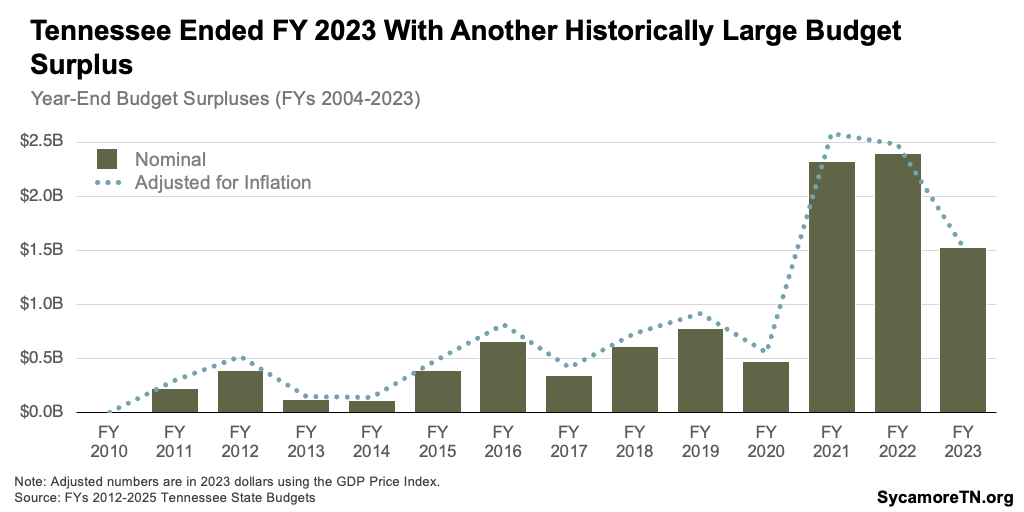
Figure 8
Changes to the FY 2024 Budget
The Budget reflects $1.2 billion of net supplemental spending in FY 2024, the current fiscal year (Figure 9). The governor makes supplemental requests each year because actual revenues and spending needs often differ from original estimates. This time, that includes $1.3 billion in new spending partially offset by an additional $70 million in planned reversions and a $30 million reduction in funds available to build a new state prison. Highlights of the new spending include:
- $1.2 billion to set up a refund account for proposed changes to the business franchise tax (discussed in more detail later).
- $110 million in funding associated with actions taken during the legislature’s August 2023 special session on school safety (e.g., $50 million for Community Mental Health Grants, $30 million for Higher Education Safety Grants).
The Budget also anticipates an additional $1.4 billion in available funds for FY 2024 beyond what was initially planned (Figure 9). This includes $2.1 billion in previously unbudgeted revenues and balances partially offset by the $719 million revenue reduction from the mid-year revised estimate discussed earlier. The newly available resources come from the $1.5. billion FY 2023 surplus discussed above and $620 million from other revenues (e.g., $391 million from earnings on the Treasurer’s investment of state funds).
Figure 9
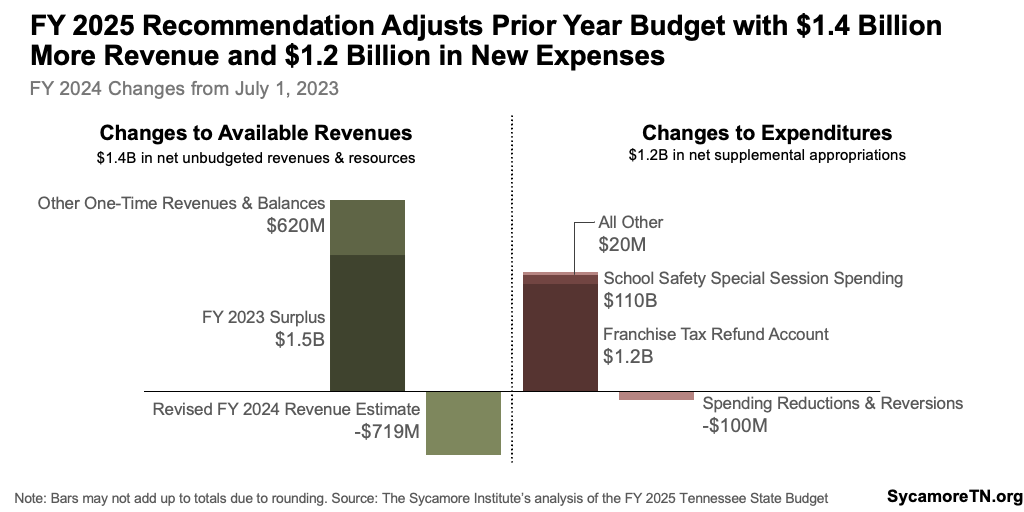
Figure 10
The FY 2025 Recommended Budget
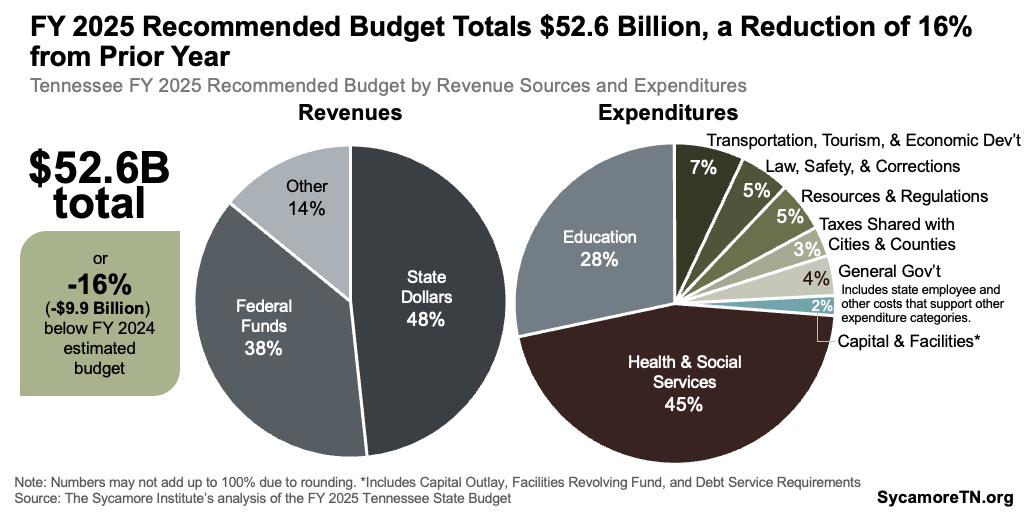
The FY 2025 recommended budget totals $52.6 billion from all revenue sources, a decrease of 16% (or $9.9 billion) below estimates for the current fiscal year. The funding mix is 48% state dollars, 38% federal funding, and 14% from tuition and other sources. Education (28%) and Health and Social Services (45%) account for nearly three-quarters of total expenditures (Figure 10).
Figure 11
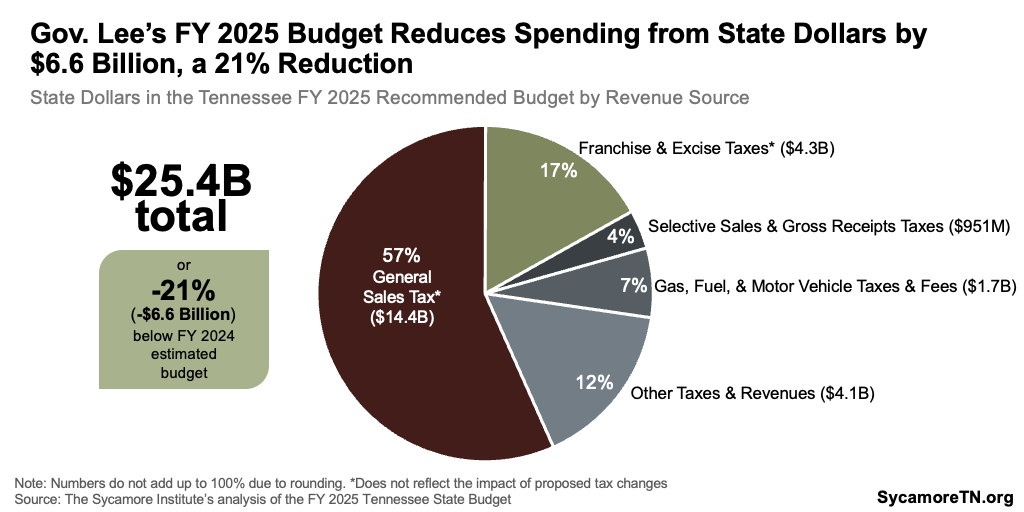
Figure 12
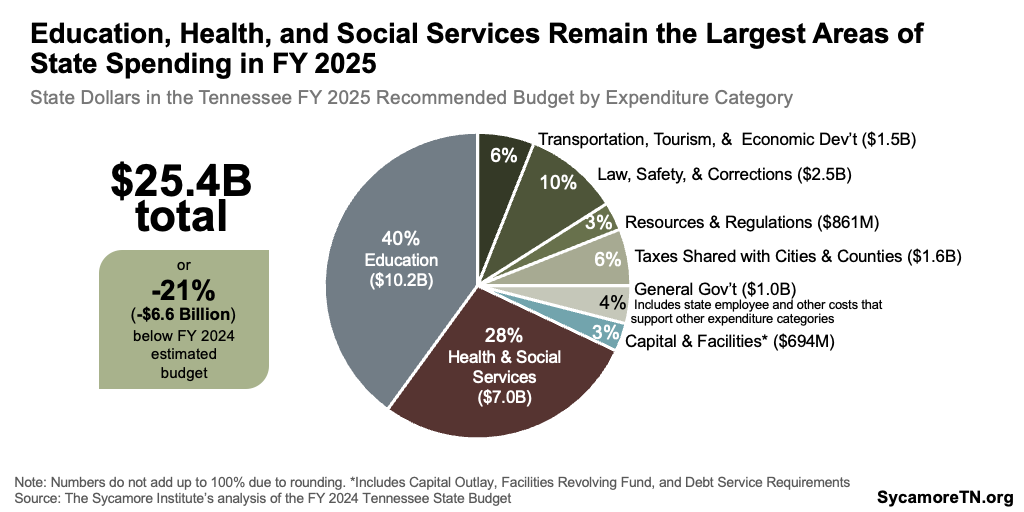
State dollars in the recommended budget total $25.4 billion, a decrease of 21% (or $6.6 billion) from the current year. Most of the state dollars in the FY 2025 budget come from taxes — the largest of which are sales and business taxes (Figure 11). Education (40%) and Health and Social Services (28%) account for more than two-thirds of expenditures from state appropriations (Figure 12).
Figure 13
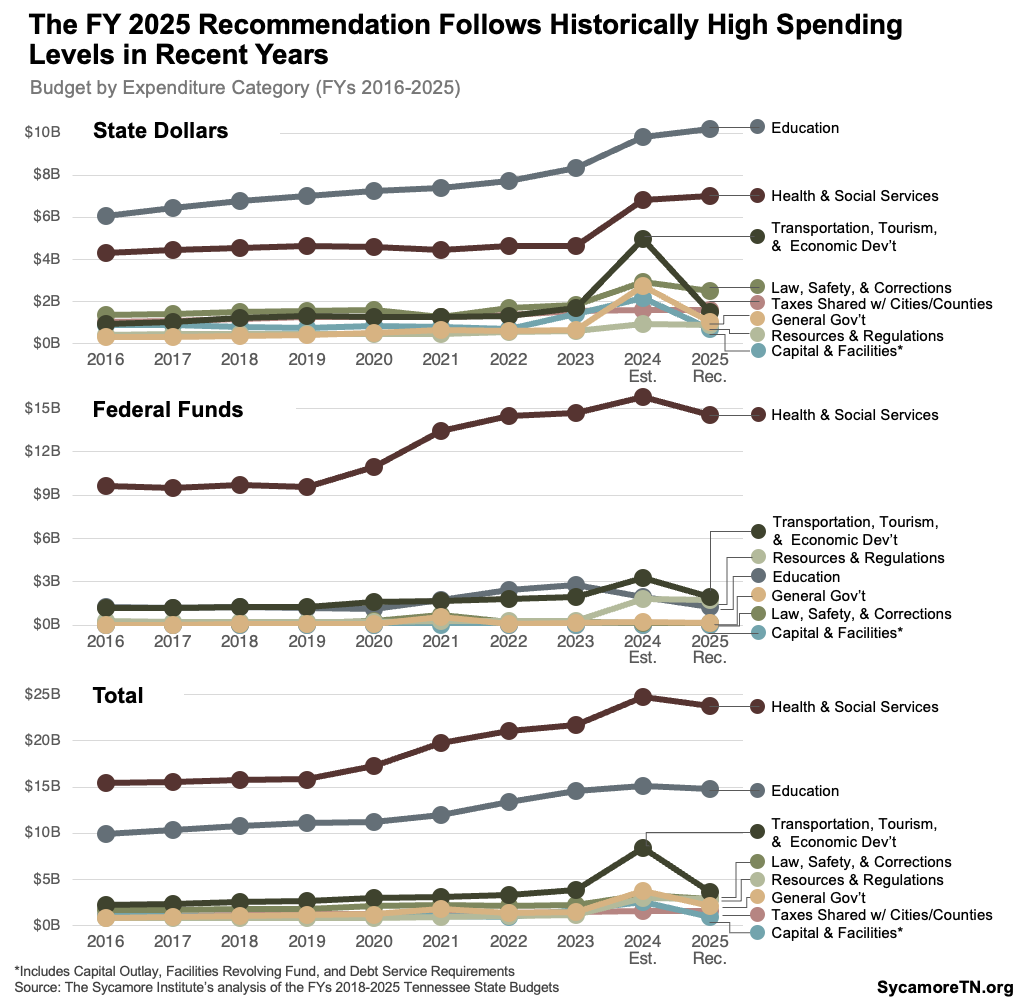
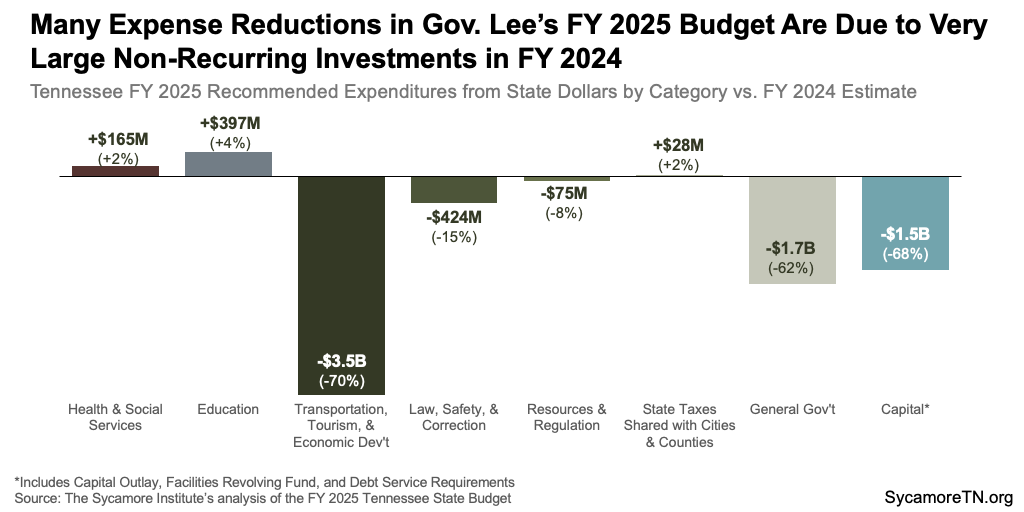
These year-over-year decreases follow historically high spending levels over the last several years — driven by fast revenue growth and billions in federal aid (Figure 13). As state revenues grew rapidly, policymakers funneled many of these dollars into one-time investments in capital expenses, one-time Highway Fund subsidies, and (if approved) the proposed business franchise tax refund account. So while the annual declines in Transportation, Economic Development, General Government, and Capital shown in Figure 14 look quite large, proposed spending in these categories is returning to historical averages. Meanwhile, the expiration of billions in COVID-related federal aid accounts for the decline in federal dollars in some program areas (e.g., education and health and social services).
Figure 14
The General Fund in Context
The administration’s recommended budget often focuses on state dollars in the General Fund, which accounts for 86% of all state spending (Figure 15). That number does not include state appropriations for the Capital Outlay Program and Facilities Revolving Fund, which many calculations lump in with the General Fund because General Fund revenue partly pays into those funds.
Recommended Increases and One-Time Spending and Allocations
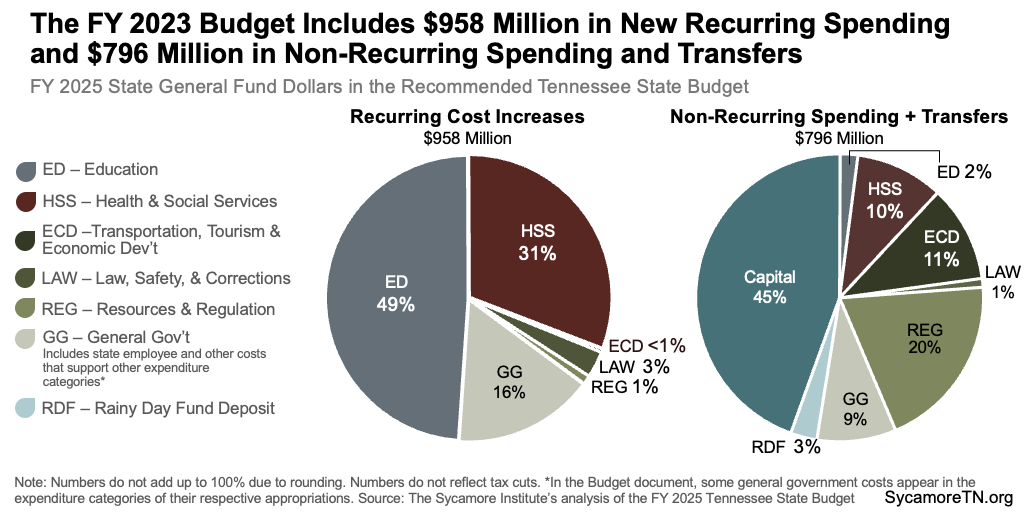
The Budget recommends $958 million in new recurring General Fund spending and $796 million in non-recurring spending and transfers (Figure 16). Recurring spending is expected to occur every year and gets added to the budget’s “base,” while non-recurring expenditures are one-time.
The Budget’s Largest Recurring Increases
- +$442 million for K-12 education.
- +$214 million to fund inflationary cost increases and a routine change in the federal match rate for TennCare, the state’s Medicaid program.
- +$157 million for state employee personnel-related costs, such as salaries and health insurance.
The Budget’s Largest Non-Recurring Allocations
- $413 million for capital, technology, and equipment investments across state government.
- $146 million for state parks and conservation efforts.
- $58 million for economic and community development grants.
Figure 15
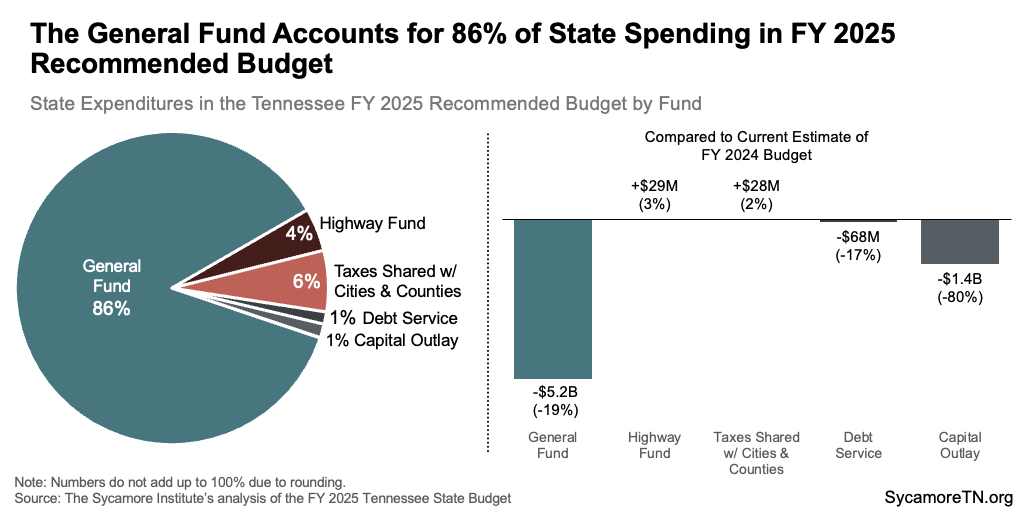
Figure 16
Governor Lee’s Policy Initiatives
Gov. Lee’s policy initiatives affect the FY 2025 recommended budget in a significant way. The recurring and one-time spending plans discussed in the previous section include the costs highlighted below.
FY 2025 Initiative: K-12 Education
The governor proposes a total increase of $459 million for K-12 education — including $442 million recurring and $16 million non-recurring. Highlighted here are:
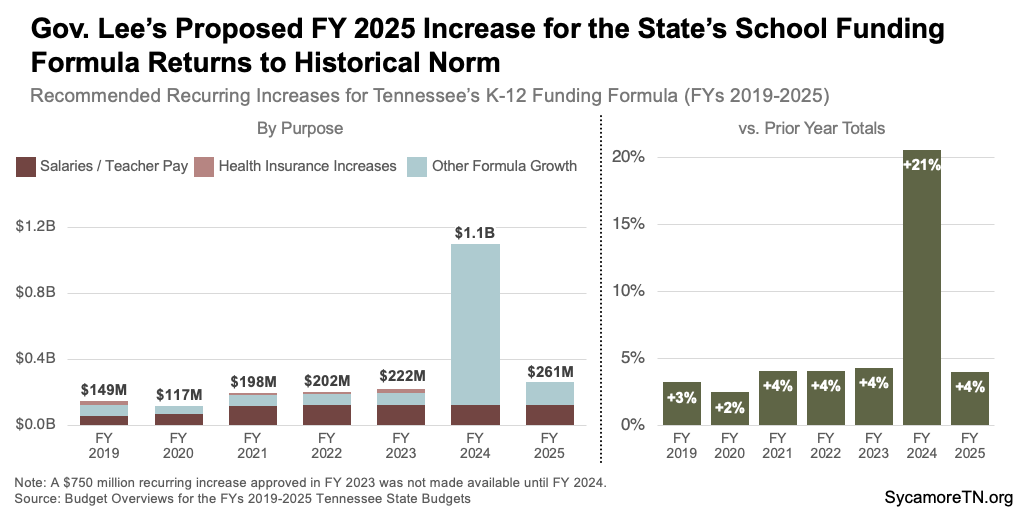
- $261 million total recurring increase for growth in the Tennessee Investment in Student Achievement (TISA) school funding formula
- $144 million recurring for the proposed Education Freedom Scholarship Act.
TISA Increases
Unlike its predecessor, underlying elements of the TISA formula do not automatically grow with inflation. TISA replaced Tennessee’s prior school funding formula, the Basic Education Program (BEP), in FY 2024. The BEP was a “resource-based” formula that used the costs of dozens of inputs and resources to determine funding levels — including built-in inflationary factors that determined annual growth. The TISA formula uses a “student-based” approach with a base amount per pupil and adjustment factors for students with additional needs. It does not include any automatic adjustments to the base amount, so any changes to the base are determined in the annual budget process.
Even in the absence of automatic formula growth, the FY 2025 Budget proposes about a 4% boost for TISA over the FY 2024 estimate — in line with prior years’ annual formula increases (Figure 17). This includes funding to cover enrollment growth, teacher pay raises, and a 3.1% increase to the base per pupil amount — from $6,860 per student in FY 2024 to $7,075 in FY 2025. (14)
Figure 17
Within the proposed TISA increase is $125 million for teachers’ salaries. Between FYs 2016 and 2024, lawmakers enacted $799 million in recurring increases for teacher pay (Figure 18). During that time, Tennessee teachers’ average pay growth did not keep up with inflation. After adjusting for inflation, teachers’ average pay during the 2021-2022 school year was still about 14% lower than a dozen years earlier (Figure 19). Tennessee’s neighboring states saw similar declines during this period (Figure 20). Meanwhile, the median earnings of Tennessee workers with a bachelor’s degree saw 2% real growth. (15) (16) (17)
Figure 18
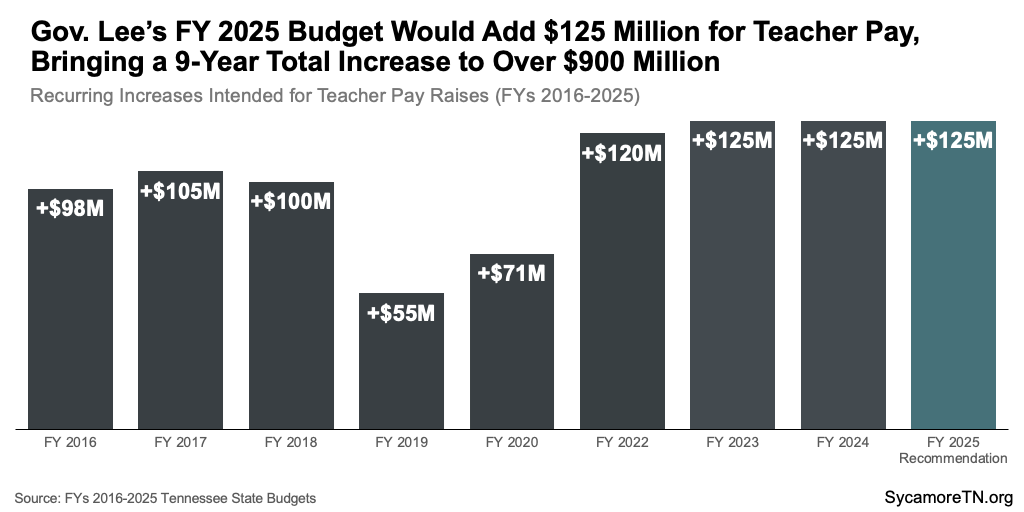
Figure 19
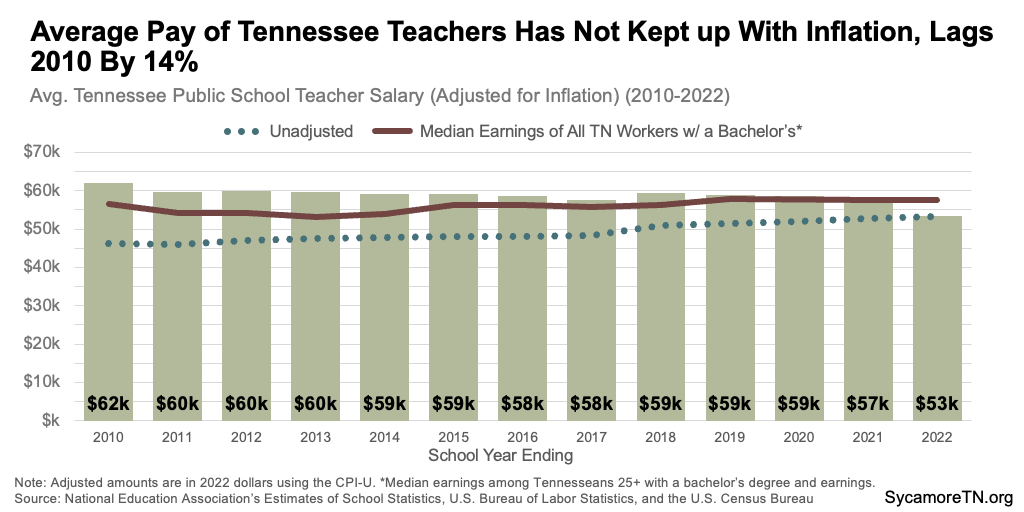
Figure 20
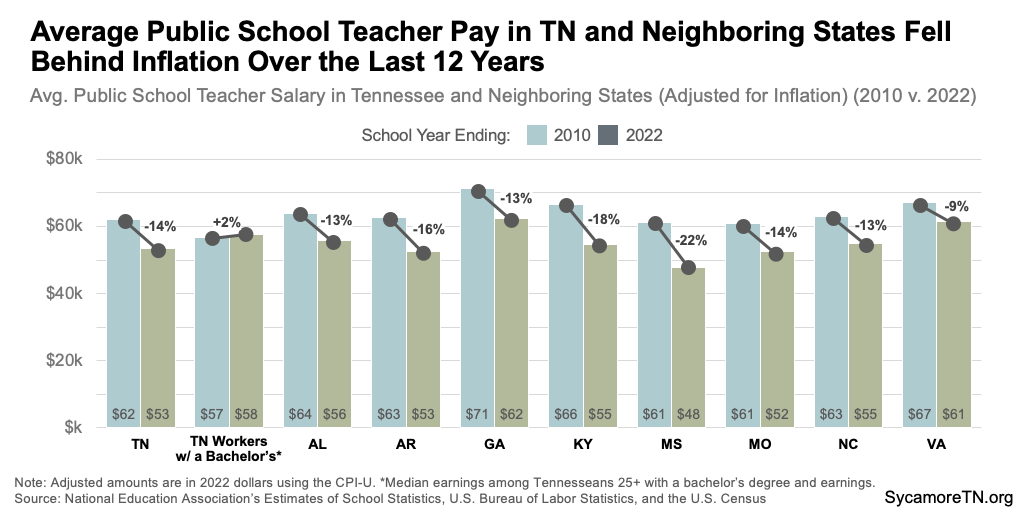
Figure 21
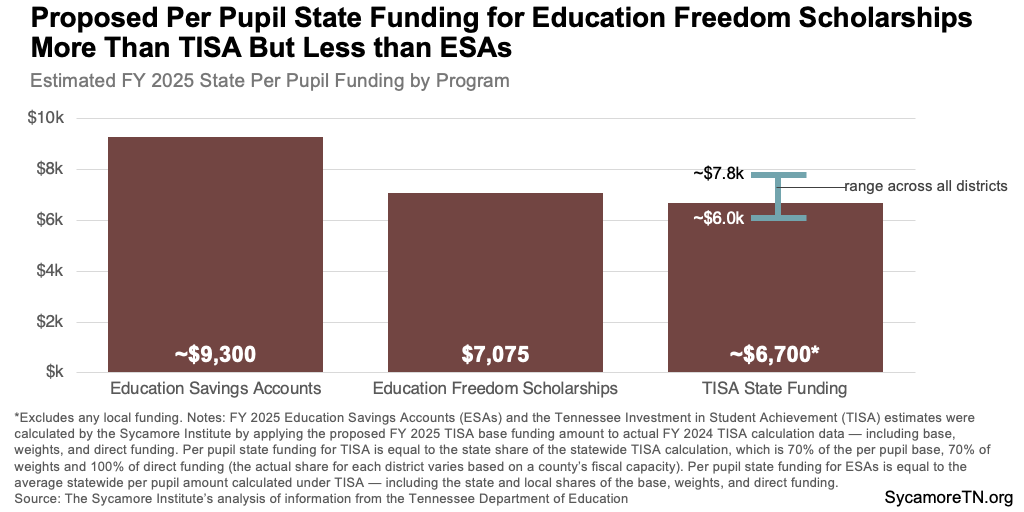
Education Freedom Scholarship Act
Gov. Lee proposes $144 million recurring for the first year of his Education Freedom Scholarship Act — including $142 million for up to 20,000 scholarships and $3 million for administrative costs. Under the proposal, Tennessee students could receive up to $7,075 per year in state funding for the costs and expenses of attending private school. For context, $7,075 is less than what is estimated to be available under an existing school choice program — Education Savings Accounts (ESAs) — but more than the expected state share of TISA per pupil funding (which excludes local funding) (Figure 21).[1] (14) (18) (19)
Additional information on the proposal, differences with an existing program, and context and data on Tennessee’s current private school landscape are available in a separate report.
FY 2025 Initiative: TennCare Shared Savings for Rural & Behavioral Health
The Budget draws on $634 million in federal funding from TennCare shared savings accumulated in FYs 2023 and 2024. Because TennCare operates under a federal waiver, program spending is subject to a budget neutrality cap — an estimate of what Tennessee’s Medicaid program would have spent without the waiver. Under a 2021 agreement with the federal government, Tennessee can keep up to 55% of the federal share of any difference between the cap and actual spending without committing any additional state money. Referred to as “shared savings,” these federal dollars must be used on specific state-funded activities that expand or improve health coverage, access, delivery, or outcomes for low-income Tennesseans. (20)
The Budget uses $163 million in shared savings in FY 2025 and $624 million total[2] over FYs 2024-2031 for non-recurring spending on coverage expansions, rural health, and behavioral health. Because shared savings are determined each year based on actual TennCare spending and specific quality metrics, these dollars are budgeted as non-recurring but allocated for spending over several years. Details include:
- $81 million in FY 2025 and $197 million total through FY 2029 for rural health initiatives discussed more below.
- $38 million in FY 2025 and $101 million total through FY 2029 related to both youth and adult mental health and substance use disorders discussed more below.
- $31 million in FY 2025 and $234 million total between FYs 2024-2031 to cover some of the state’s share of Medicaid eligibility expansions for low-income mothers and children approved as part of the FY 2024 Budget.
- $11 million in FY 2025 and $82 million total between FYs 2024-2031 to provide 100 disposable diapers per month for children under two on TennCare — also approved as part of the FY 2024 Budget.(21)
- $2 million in FY 2025 and $10 million total through FY 2029 for the TennCare value-based payment initiative.
Figure 22
FY 2025 Initiative: Details on Rural Health
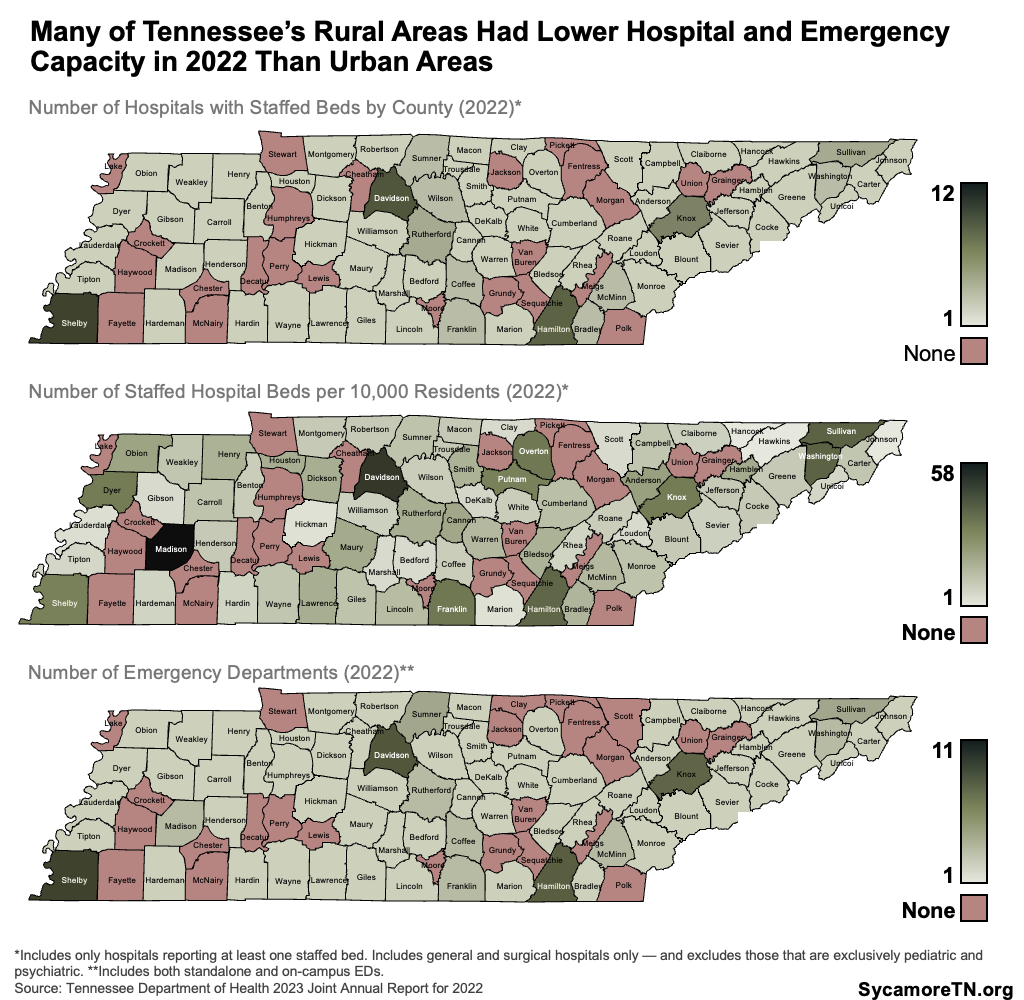
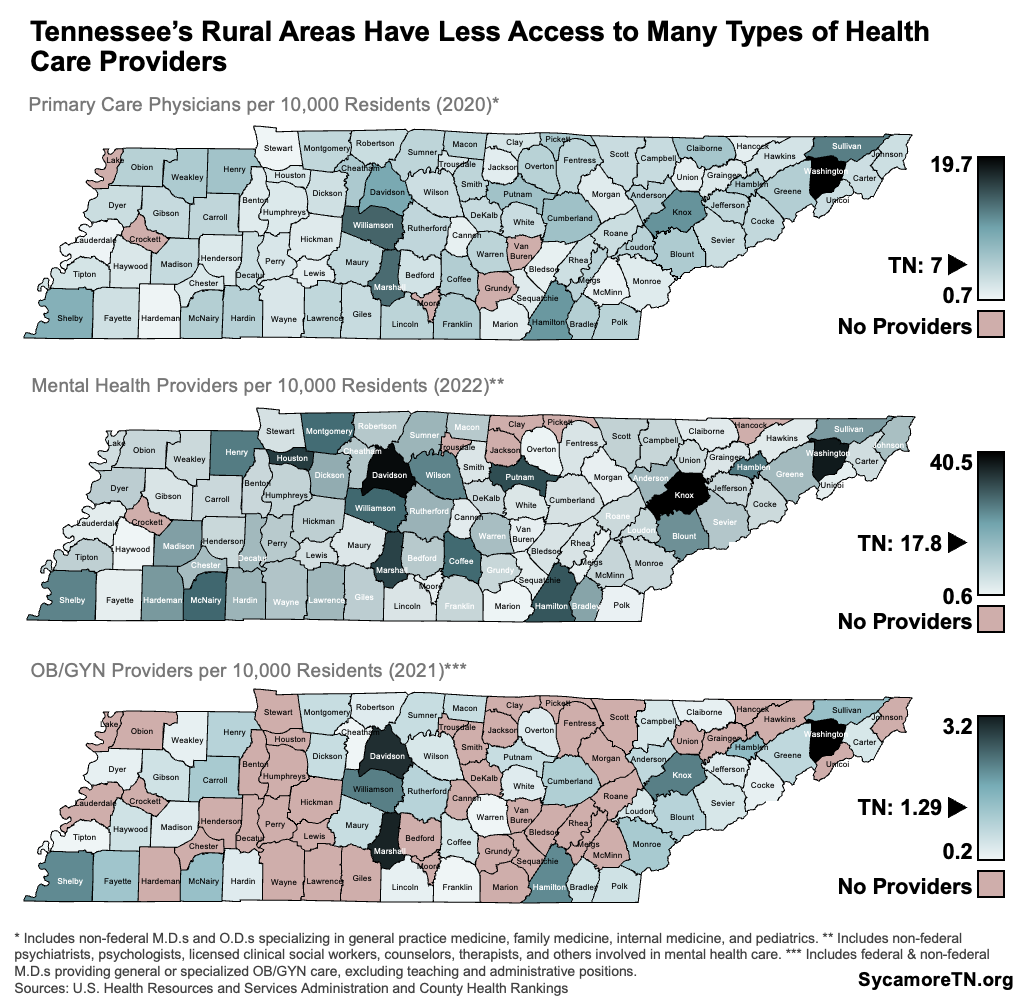
The rural health initiatives above are intended to help increase access to care in rural areas, with fewer hospitals and health care providers (Figures 22 and 23). Funded from TennCare shared savings, the recommendations include:
- $50 million for the Rural Health Care Resiliency Program within the Tennessee Department of Health (TDH) to fund community-driven projects to expand and improve health care capacity in rural areas.
- $16 million in FY 2025 and $68 million total through FY 2029 within Higher Education for the Rural Health Pathways Program to bolster the pipeline for the rural health workforce.
- $6 million in FY 2025 and $39 million total through FY 2029 within the Department of Labor and Workforce Development to expand rural health apprentice programs for the health workforce.
- $5 million in FY 2025 and $23 million total through FY 2029 within TDH for rural health care training programs to address rural primary and behavioral health workforce shortages.
- $2 million in FY 2025 and $12 million total through FY 2029 to fund Centers of Excellence and related grants to support rural communities in meeting the health needs of their citizens.
- $1 million in FY 2025 and $5 million total through FY 2029 within TDH to increase access to specialty care in rural areas.
- $67,000 to enhance telemedicine capabilities in rural areas.
Figure 23
FY 2025 Initiative: Behavioral Health
Gov. Lee proposes about $64 million in FY 2025 investments in behavioral health, which includes the shared savings mentioned above. Specific items are listed below, and a forthcoming Sycamore report will provide additional context on how some of these items fit into the state’s existing programs and services for children’s mental health. These include:
Provider Payments
- $6 million recurring to increase reimbursement rates for the Department of Mental Health and Substance Abuse Services’ (TDMHSAS) community-based mental health and substance abuse treatment providers. This funding builds on an $18 million recurring increase for this purpose in FY 2023 and another $9 million in FY 2024.
- $7 million in FY 2025 and $35 million total through FY 2029 from TennCare shared savings for quality incentive payments to community mental health centers and certain TennCare providers.
Children’s Behavioral Health
- $10 million from TennCare shared savings to fund the final year of a 2-year grant program to develop behavioral health infrastructure at children’s hospitals.
- $8 million recurring — including $6 million from General Fund dollars and $2 million from K-12 Mental Health Trust Fund earnings — to fund 114 additional school-based behavioral health liaisons. This follows an $8 million recurring increase in the FY 2024 Budget.
- $5 million non-recurring to fund the final year of a 2-year expansion of youth crisis stabilization units.
- $4 million non-recurring from K-12 Mental Health Trust Fund earnings to help localities expand their capacity to provide school-based behavioral health treatment.
- $1 million in FY 2025 and $5 million total through FY 2029 from TennCare shared savings to provide in-home behavioral health support for infants and young children.
- $400,000 in FY 2025 and $2 million total through FY 2026 from TennCare shared savings to train pediatric primary care providers in strategies to identify and manage behavioral health needs.
Other Behavioral Health
- $15 million in FY 2025 and $30 million total through FY 2026 from TennCare shared savings to support capacity and quality improvements at behavioral health hospitals.
- $2 million in FY 2025 and $10 million total through FY 2029 from TennCare shared savings to increase capacity for substance use disorder treatment.
- $2 million from the state’s opioid abatement settlement funds for the first year of a 4-year expansion of the Addiction Recovery Program.
- $1.5 million in FY 2025 and $3 million total through FY 2026 from TennCare shared savings to bolster supports for individuals with both intellectual/developmental disabilities and behavioral health needs.
- $1 million in FY 2025 and $5 million total through FY 2029 from TennCare shared savings to compensate behavioral health providers supervising trainees.
Franchise Tax Cut
Gov. Lee proposes a $410 million recurring cut to the franchise tax on businesses beginning in FY 2025 and setting aside $1.2 billion in FY 2024 to refund taxes already paid. Several reasons for the proposed cut have been cited, including simplifying the tax, staying competitive with other states, and preempting a possible legal challenge to current law.
Tennessee’s franchise and excise (F&E) taxes are corporate taxes that comprised 22% of the state’s tax revenues in FY 2023. Tennessee’s excise tax on for-profit businesses is 6.5% of their net earnings within the state. The state calculates the franchise tax as either 0.25% of a business’s net worth or an alternative minimum based on 0.25% of its real and tangible property in Tennessee, including assets like land, buildings, and machinery. (26) A business’ net worth is calculated by subtracting total liabilities, such as debts, from its total assets.
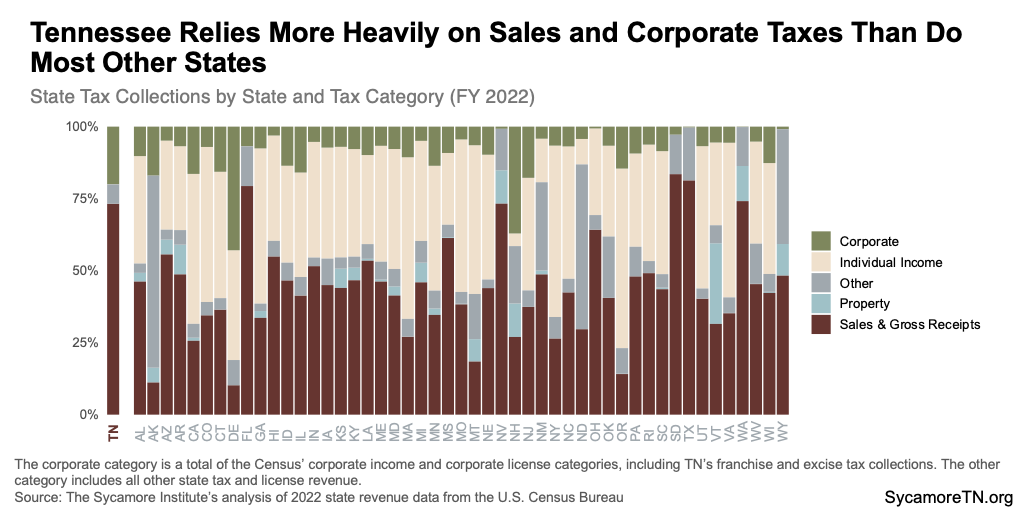
In 2023, Tennessee was one of 16 states levying a franchise tax based on net worth or assets — although several other states have recently begun to phase theirs out. (27) (28) (29) We also levy the more common corporate excise (i.e., income) tax. (30) However, Tennessee does not collect state taxes on individual income, property, or other items such as estates and gifts — major revenue sources for other states (Figure 24). Instead, the state heavily relies on two primary sources of revenue — sales and gross receipt taxes and corporate taxes. According to Census data, Tennessee was more reliant on corporate taxes than all but two other states in FY 2022. (31)
Figure 24
The FY 2025 Budget proposes removing the franchise tax’s alternative minimum tax on property and providing partial refunds for companies that paid that tax in 2021-2023. (32) Refunds would be available to any company that paid the alternative minimum tax for the amount exceeding what the organization would have owed on its net worth in those years. The state projects the change will result in $1.2 to $1.6 billion in one-time refunds and a recurring reduction of $410 million in annual tax revenue. (33) (34) (1) (35)
State officials say the proposal is necessary to preempt legal challenges to the current law under the U.S. Constitution’s Dormant Commerce Clause. (35) (36) While no case has been filed, the concern is that the current tax may hinder businesses from operating across state lines, creating an illegal barrier to interstate commerce. This concern arises from using an alternative minimum tax base — meaning the most valuable tax on one metric or another (i.e., net worth or property). The argument is that a company operating in multiple states could end up paying a higher effective tax rate than a company only operating within Tennessee — thus discouraging companies from expanding into or beyond Tennessee’s borders. However, without the context of an actual lawsuit, how a court would rule and the exact details of any potential Constitutional violation remain uncertain. As a result, it is hard to determine the extent to which Gov. Lee’s proposal rectifies a real and significant liability or simply provides a straightforward tax cut.
Any legal challenge to Tennessee’s franchise tax could also impact the tax structure of other states. While there are no reported legal cases elsewhere, at least three other states use an alternative minimum or maximum in their corporate tax calculations. (37) (38) (39) North Carolina recently removed its alternative minimum definition but did not provide for refunds. (40) (41) (42)
Several alternative approaches could potentially address the state’s legal concerns with less revenue impact.[3] For example:
- Some tax experts believe that a credit program could address constitutional concerns for affected companies at a lower cost than the Budget’s proposal. (33) (34)
- Policymakers could also adjust the tax rate on net worth to fully or partially offset any losses associated with eliminating the alternative minimum tax on property. However, this approach would redistribute the tax burden from companies currently paying on property to those paying on net worth.
- Another revenue-neutral option could involve taxing both a company’s net worth and its property at a reduced rate. This change may alleviate any concerns regarding using an alternative minimum tax definition.
- With or without any changes to the tax structure, policymakers could set aside available non-recurring dollars for a potential refund account that would only pay out if a lawsuit materializes and the state doesn’t win.
Officials have also cited competitiveness as a reason for the change, and indeed, Tennessee has relatively high corporate taxes nationally, largely due to the state’s tax structure. When comparing Tennessee’s corporate tax revenue with other states, we consistently rank among the ten highest. This ranking holds whether measured as a percentage of gross domestic product (GDP), a percentage of personal income, or on a per capita basis. (31) (43) (44) Tennessee also has the highest combined average state and local sales tax rate nationwide. (45) In fact, the state’s revenue structure was the 6th most dependent on sales and gross receipt taxes and 3rd most reliant on corporate taxes in FY 2022 (Figure 24). (31) This context underscores the trade-offs involved in Tennessee’s tax structure — which must balance the lack of certain taxes with higher reliance on others.
However, corporate taxes are just one factor in the overall competitiveness of a state’s business environment. Given our overall low tax environment, low regulatory burden, and strong economic output, Tennessee is consistently considered a business-friendly state with a strong economic outlook. (46) (47) (48)
Revenue Context for the Franchise Tax Proposal
The governor’s proposal comes in the context of recent cuts to what is already a volatile tax, a strong overall economy, and lower-than-expected F&E tax collections.
- Corporate taxes (and any changes made to them) are notoriously difficult to project because of their volatility. Compared to the sales tax, the state’s corporate taxes have much larger swings in revenue change from one year to the next (Figure 25). (49)
- Policymakers enacted several other F&E cuts last year. The 2023 Tennessee Works Act (TWA) was forecast to reduce F&E collections by $158 million in FY 2024 via a mix of permanent and temporary tax cuts. (50)(51) (52) The enacted F&E changes permanently raised the thresholds at which businesses must start paying these taxes and instituted a two-year tax credit for companies offering paid family leave. Even so, initial budget forecasts with those changes estimated F&E collections would still grow by 2% in FY 2024. However, the actual impact may not be known for several years.
- Tennessee’s economy has been growing (Figure 26). The U.S. economy grew faster in 2023 than the year before, with its greatest gains occurring in the year’s final six months. (53) Though final 2023 data for Tennessee is not yet available, Tennessee’s economy also grew throughout the year. In fact, we outperformed the U.S. economy and 34 other states during the first three months of FY 2024 (i.e., July-August 2023). (54)
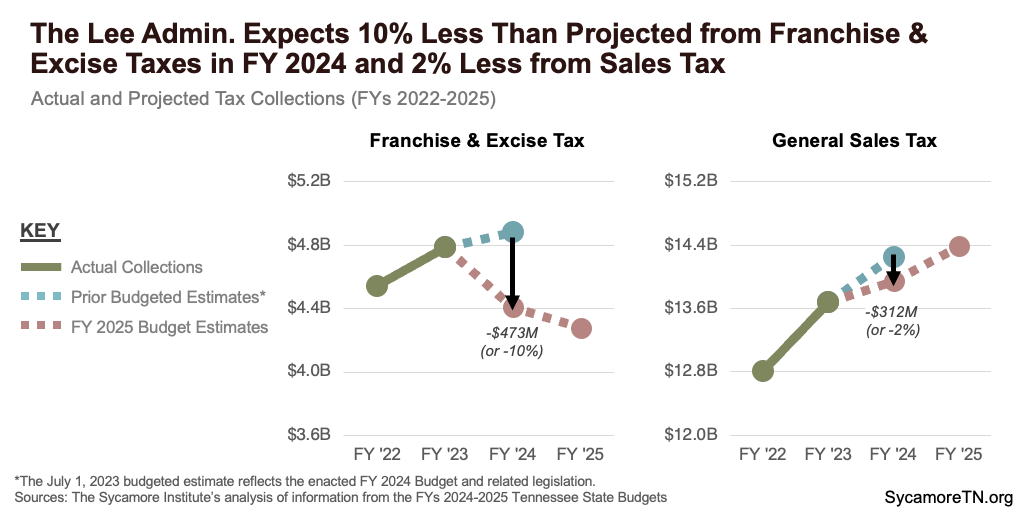
- F&E tax collections for FY 2024 are coming in below projections despite the growing economy. Six months into this fiscal year, actual F&E collections have fallen $234 million short (or 11%) of projections (Figure 27) — which could be due to an underestimation of the TWA’s effects and/or typical F&E volatility. The Budget now expects an 8% annual decline in collections — amounting to $378 million less than in FY 2023 and $473 million less than previously projected for FY 2024 (Figure 28). (55) In contrast, sales tax collections have been more in line with projections — even after accounting for the TWA’s sales tax holiday — and are still expected to grow by 2% over FY 2023 collections. (55)(51)
Figure 25
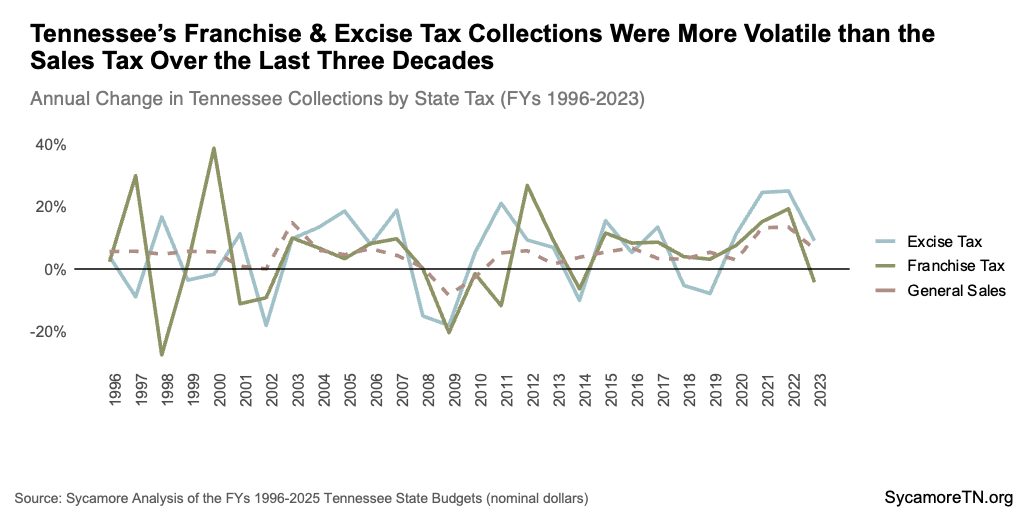
Figure 26
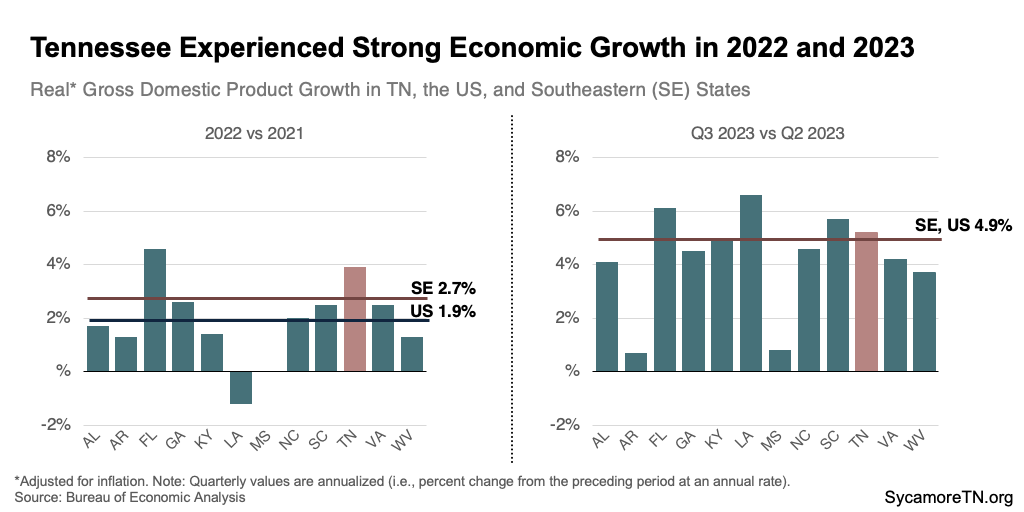
Figure 27
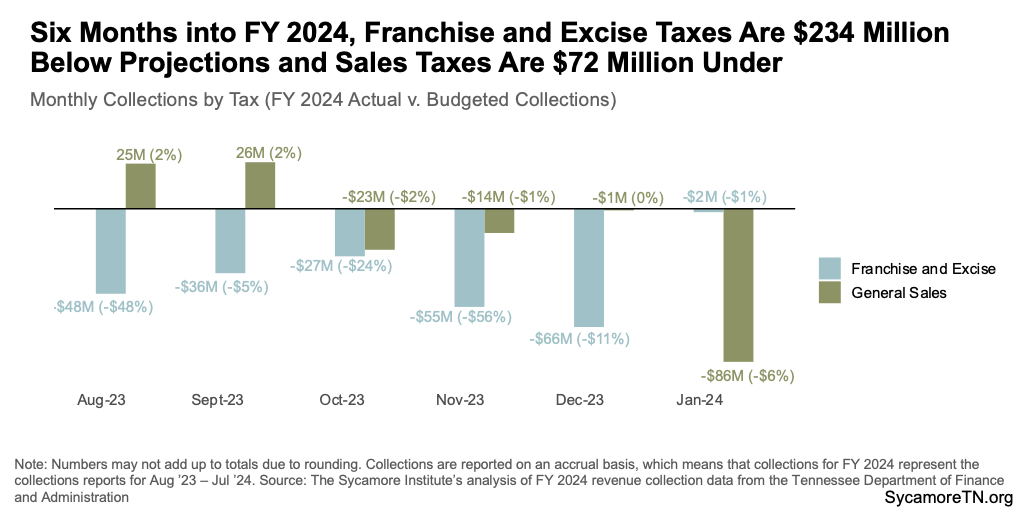
Figure 28
FY 2025 Funds Reserved for Legislative Action
The Budget reserves $3 million in recurring and $10 million in non-recurring funds for initiatives and amendments of the legislature. Another $3 million in recurring and $10 million in non-recurring funds are reserved for the Administration Amendment expected later this legislative session.
FY 2025 Spending Reductions
The Budget proposes reductions totaling $44 million recurring and $50 million non-recurring. The non-recurring reductions reflect replacing state dollars with other temporary sources of funding. The recurring reductions largely come from:
- A $20 million reduction to the state’s recurring obligations for funding other post-employment benefits (OPEB) — which includes health insurance for retired state employees. This reduced obligation comes on the heels of $550 million in one-time deposits over the last two years to help pay down those long-term liabilities. See our FY 2024 budget summary for more information.
- $13 million comes from enrollment and utilization reductions in the TennCare programs housed at the Department of Intellectual and Developmental Disabilities.
- $7 million from rent reductions and billing system savings across several agencies.
FY 2025 State Tax Revenue Growth
The Budget expects total state tax collections to grow by 1.53% (or $332 million) in FY 2025. The State Funding Board recommended a range of 0.1% to 1.1% growth in the recurring state tax revenues based on expert estimates that ranged from 0.6% to 4.2%. Recurring General Fund revenues — about 86% of all Department of Revenue state tax collections — are expected to grow by 0.5% in FY 2025.
The direction and degree of expected change vary by revenue type (Figure 29):
- +3.2% gain ($446 million) in general sales tax collections.
- +1.3% gain ($22 million) in gas, fuel, and motor vehicle taxes and fees collections.
- -2.9% loss ($128 million) in franchise and excise tax collections from businesses — before any reductions from the proposed tax cut discussed earlier. These losses are largely associated with a temporary tax credit for businesses offering paid family leave and changes to calculating depreciation. (57)
- -0.9% loss (-$9 million) in selective sales and gross receipts taxes collections.
Figure 29
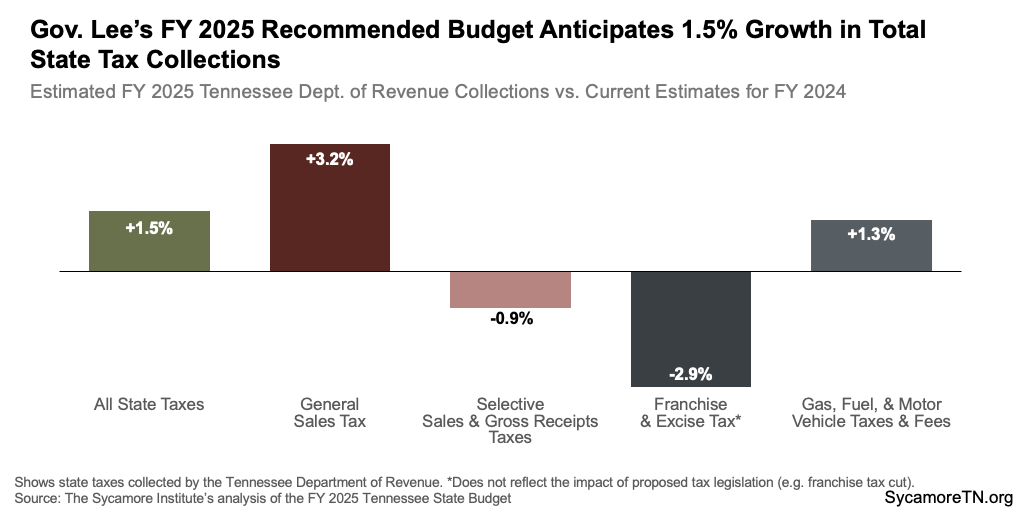
Figure 30
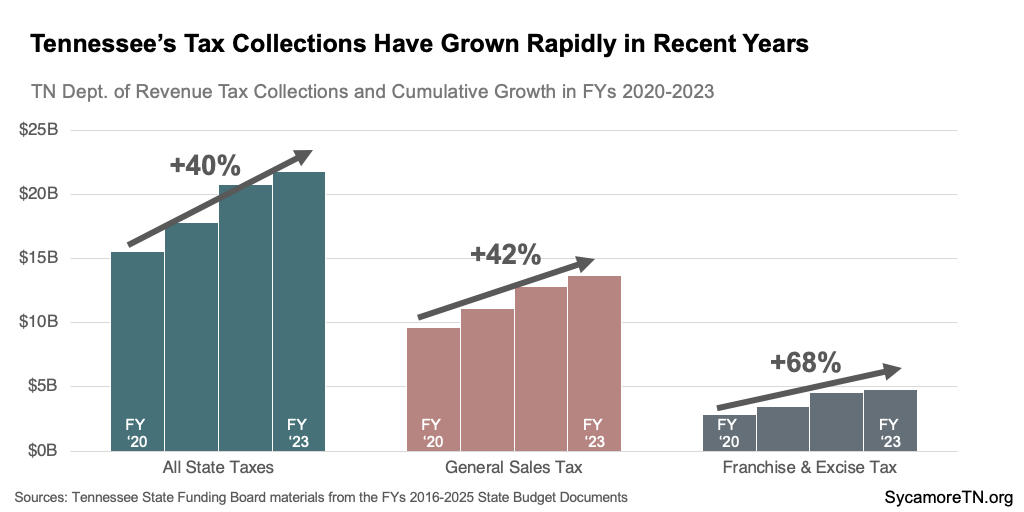
Tennessee experienced rapid revenue growth over the last several years due to large gains in sales tax and franchise and excise taxes. Department of Revenue tax collections grew by 40% between FYs 2020 and 2023, bolstered by a 42% increase in sales tax collections and a 68% increase in franchise and excise tax collections. After adjusting for inflation, these totals remain strong at 21%, 23%, and 45%, respectively (Figure 30). Meanwhile, the state’s gas, fuel, and motor vehicle taxes and fees collections only grew by 2% during this period — a 12% decline after adjusting for inflation.
Figure 31
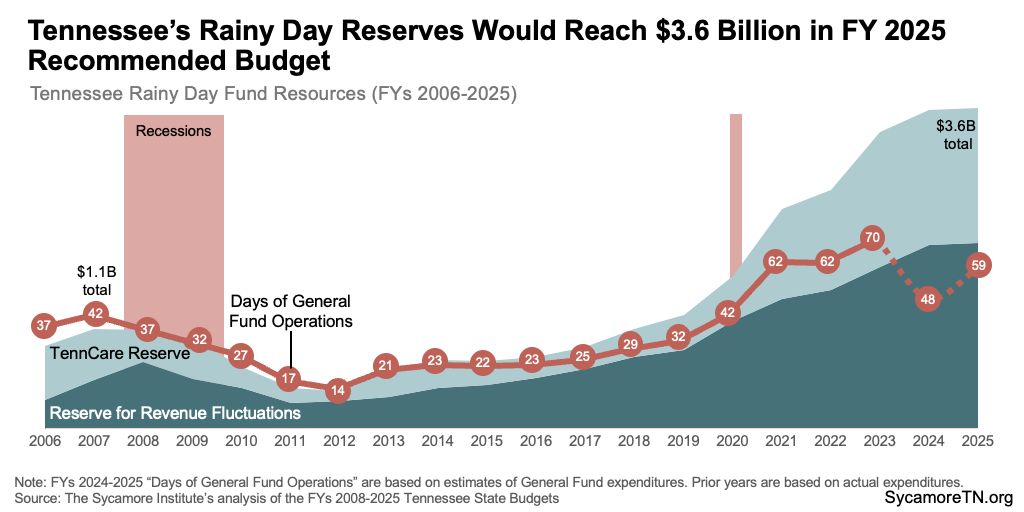
Rainy Day Reserves
The Budget recommends a combined balance of $3.6 billion in the Reserve for Revenue Fluctuations and the TennCare Reserve by the end of FY 2025 (Figure 31). These rainy day reserves are a tool of last resort should Tennessee need to respond to an economic downturn. Reserve balances provide a cushion during a recession, which typically increases demand for state programs and services but decreases the revenues that fund them.
- This combined balance would give the budget about 18 days more cushion than just before the Great Recession. At $3.6 billion, the two reserves would cover about 59 days of state-funded General Fund operations at the governor’s recommended FY 2025 levels.
- The Budget hits that mark by adding $20 million to the Reserve for Revenue Fluctuations in FY 2025. This deposit would grow that account to $2.1 billion — the highest dollar amount ever.
- The Reserve for Revenue Fluctuations would exceed its statutory target by about $302 million. State law sets a target for that fund at 8% of General Fund revenues, and the FY 2025 recommended balance represents 9.4%.[4]
Key Budget Resources
- Sycamore’s Tennessee State Budget Primer
- FY 2025 Tennessee State Budget
- Budget Overview for the FY 2025 Tennessee State Budget
- Lee’s 2024 State of the State Address
- FY 2025 Budget Presentation to the House and Senate Finance Committees
- Archive of Tennessee State Budgets
[1] FY 2025 ESA and TISA estimates were calculated by the Sycamore Institute by applying the proposed FY 2025 TISA base funding amount to actual FY 2024 TISA calculation data — including base, weights, and direct funding. Per pupil state funding for is TISA equal to the state share of the statewide TISA calculation, which is 70% of the per pupil base and weights and 100% of direct funding (the actual share for each district varies based on a county’s fiscal capacity). Per pupil state funding for ESAs is equal to the average statewide per pupil amount calculated under TISA — including the state and local shares of the base, weights, and direct funding. (14) (18)
[2] The Budget does not allocate $10 million of the FYs 2023-2024 shared savings.
[3] The information provided does not, and is not intended to, constitute legal advice; instead, all information and content are for general informational purposes only.
[4] Calculated by adding Department of Revenue and other state revenue allocations to the General Fund, Education Fund, and Debt Service Fund minus the Gas Tax allocation to the Debt Service Fund (from page A-63 of the Budget).
*This paper was updated on February 27, 2024 to correct misidentified counties in Figures 22 and 23.
References
Click to Open/Close
- Tennessee Department of Finance and Administration. State of Tennessee, The Budget Fiscal Year 2024 – 2025. Fiscal Year 2024-2025 Budget Publications. February 5, 2024. https://www.tn.gov/finance/fa/fa-budget-information/fa-budget-archive/fiscal-year-2024-2025-budget-publications.html.
- —. Budget Overview to the FY 2024-2025 State Budget. February 5, 2024. https://www.tn.gov/content/dam/tn/finance/budget/documents/overviewspresentations/FY25%20Budget%20Overview%20Final.pdf.
- —. State of Tennessee, The Budget for Fiscal Years 2001-2002 through 2023-2024. Budget Publications Archive. https://www.tn.gov/finance/fa/fa-budget-information/fa-budget-archive.html.
- —. December Revenues: 2023_Dec_Tables.xlsx. January 19, 2024. https://www.tn.gov/content/dam/tn/finance/documents/lola/2023_Dec%20_Tables.xlsx.
- —. FY 2023 Agency Reversions.
- TennCare. Information Provided to the Sycamore Institute on February 9, 2024.
- U.S. Bureau of Labor Statistics. Comparing the Consumer Price Index with the Gross Domestic Product Price Index and Gross Domestic Product Implicit Price Deflator. Monthly Labor Review. March 2016. https://www.bls.gov/opub/mlr/2016/article/comparing-the-cpi-with-the-gdp-price-index-and-gdp-implicit-price-deflator.htm.
- U.S. Bureau of Economic Analysis. Gross Domestic Product: Chain-Type Price Index [GDPCTPI], retrieved from FRED, Federal Reserve Bank of St. Louis. January 2024. https://fred.stlouisfed.org/series/GDPCTPI.
- Tennessee Department of Finance and Administration. Budget Overview to the FYs 2018-2019 through 2023-2024 Budgets. 2018-2023.
- State of Tennessee. Public Chapter No. 1061 (2018). May 21, 2018. https://publications.tnsosfiles.com/acts/110/pub/pc1061.pdf.
- —. Public Chapter No. 405 (2019). May 17, 2019. https://publications.tnsosfiles.com/acts/111/pub/pc0405.pdf.
- —. Public Chapter No. 651 (2020). April 2, 2020. https://publications.tnsosfiles.com/acts/111/pub/pc0651.pdf.
- —. Public Chapter No. 760 (2020). June 30, 2020. https://publications.tnsosfiles.com/acts/111/pub/pc0760.pdf.
- Tennessee Department of Education. Information Obtained by The Sycamore Institute on February 6, 2024.
- National Education Association. Annual Rankings and Estimates Reports for 2012-2023. Obtained from https://www.nea.org/research-publications and https://eric.ed.gov/.
- U.S. Bureau of Labor Statistics. Consumer Price Index for All Urban Consumers: All Items in U.S. City Average [CPIAUCSL], retrieved from FRED, Federal Reserve Bank of St. Louis. https://fred.stlouisfed.org/series/CPIAUCSL.
- U.S. Census Bureau. American Community Survey 1-Year Estimates for 2010-2023. Accessed from http://data.census.gov.
- Tennessee Department of Education. FY 2024 TISA Calculator – District View. Provided to The Sycamore Institute on December 18, 2023.
- State of Tennessee. Education Freedom. Accessed on January 26, 2024 via https://tneducationfreedom.com/.
- TennCare and the Centers for Medicare & Medicaid Services. TennCare III Medicaid Section 1115 Demonstration. October 20, 2023. https://www.tn.gov/content/dam/tn/tenncare/documents/tenncarewaiver.pdf.
- TennCare. Notice of Change to the TennCare III Demonstration: Amendment 5. September 13, 2023. https://www.tn.gov/content/dam/tn/tenncare/documents2/Amendment5ComprehensiveNotice.pdf.
- Tennessee Department of Health. Joint Annual Report for Hospitals for 2022. 2023. https://internet.health.tn.gov/publicjars/default.aspx.
- —. Joint Annual Report data on EDs from 2022. Provided to the Sycamore Institute on February 14, 2024.
- U.S. Health Resources and Services Adminsitration. Data Downloads: 2022-2023 County Level Data. August 2023. https://data.hrsa.gov/data/download.
- County Health Rankings and Roadmaps. Tennessee Data and Resources: 2023 Tennessee Data. Health Data. 2023. [Accessed on February 8, 2024.] https://www.countyhealthrankings.org/explore-health-rankings/tennessee/data-and-resources.
- Tennessee Department of Revenue. Franchise & Excise Tax: Due Dates and Tax Rates. https://www.tn.gov/revenue/taxes/franchise—excise-tax/due-dates-and-tax-rates.html.
- Fritts, Janelle. Does Your State Levy a Capital Stock Tax? Tax Foundation. March 21, 2023. https://taxfoundation.org/data/all/state/state-capital-stock-taxes-franchise-taxes-2023/.
- Mississippi Department of Revenue. Corporate Income and Franchise Tax FAQs. [Accessed on February 19, 2024.] https://www.dor.ms.gov/business/corporate-income-and-franchise-tax-faqs.
- Bhatt, Manish. Tax Foundation: Oklahoma Adopts Franchise Tax Repeal, Eliminates Marriage Penalty. Tax Foundation, June 7, 2023. https://taxfoundation.org/blog/oklahoma-franchise-tax-repeal-marriage-penalty/.
- Fritts, Janelle. State Corporate Income Tax Rates and Brackets, 2023. Tax Foundation. January 24, 2023. https://taxfoundation.org/data/all/state/state-corporate-income-tax-rates-brackets-2023/.
- U.S. Census Bureau. Database on Historical State Tax Collections. April 2023. https://www.census.gov/programs-surveys/stc/data/datasets.html.
- Tennessee General Assembly. HB 1893 – SB 2103 Bill Summary. [Accessed on February 21, 2024.] https://wapp.capitol.tn.gov/apps/BillInfo/Default.aspx?BillNumber=HB1893&GA=113.
- Friedman, Adam. Tax Expert: Tennessee Is Caving To Businesses On Tax Cut and $1B+ Refunds, Offers Another Option. The Tennessee Lookout. January 29, 2024. https://tennesseelookout.com/2024/01/29/tax-expert-tennessee-is-caving-to-businesses-on-tax-cut-and-1b-refunds-offers-another-option/.
- Sher, Andy. Tennessee’s Billion Dollar Franchise Tax Problem Could Be Fixed On The Cheap, Expert Says. The Tennessee Journal. January 30, 2024. https://pro.stateaffairs.com/stories/economy-business/franchise-tax-cost.
- Bryson, Jim. Testimony before the Tennessee General Asssembly Senate Standing Committee on Finance, Ways and Means. February 6, 2024.
- Sher, Andy. Lee Administration Plan To Overhaul Franchise Tax Gets Pushback In House. The Tennessee Journal. January 25, 2024. https://pro.stateaffairs.com/stories/taxes/franchise-tax-pushback.
- New York Department of Taxation and Finance. Article 9-A—Franchise Tax On General Business Corporations. December 18, 2023. https://www.tax.ny.gov/bus/ct/article9a.htm.
- Delaware Division of Corporations. How to Calculate Franchise Taxes. [Accessed on February 20, 2024.] https://corp.delaware.gov/frtaxcalc/.
- Massachusetts Department of Revenue. Massachusetts Tax Rates. January 25, 2024. https://www.mass.gov/info-details/massachusetts-tax-rates.
- North Carolina Department of Revenue. 2023 Tax Law Changes. 2023. https://www.ncdor.gov/2023-tax-law-changes.
- North Carolina General Assembly: Fiscal Research Division. Senate Bill 105 / SL 2021-180: Edition 4 Legislative Fiscal Note. August 10, 2021. https://www.ncleg.gov/BillLookUp/2021/sb105.
- North Carolina General Assembly: Legislative Analysis Division. Bill Summaries And Explanatory Memos for SB 105 – 2021 Appropriations Act: Sec. 42.3: Franchise Tax Reduction and Simplification. January 23, 2022. https://dashboard.ncleg.gov/api/Services/BillSummary/2021/S105-SMSV-85(sl)-v-7.
- Bureau of Economic Analysis. Downloads: Gross Domestic Product (GDP), SASUMMARY: Summary Tables For U.S. States. [Accessed on January 26, 2024.] https://apps.bea.gov/regional/downloadzip.cfm?_gl=1*46z4c6*_ga*MTM4Njc3MjY3NS4xNzA2MjkzMjM5*_ga_J4698JNNFT*MTcwNjI5MzIzOC4xLjAuMTcwNjI5MzIzOC42MC4wLjA..
- U.S. Census Bureau. Annual Estimates of the Resident Population for the United States, Regions, States, Disctrict of Columbia, and Puerto Rico: April 1, 2020 to July 1, 2022. State Population Totals and Components of Change: 2020-2023. [Accessed on February 7, 2024.] https://www2.census.gov/programs-surveys/popest/tables/2020-2022/state/totals/NST-EST2022-POP.xlsx.
- Tax Foundation. State and Local Sales Tax Rates, Midyear 2023. July 17, 2023. https://taxfoundation.org/data/all/state/2023-sales-tax-rates-midyear/.
- Walczak, Jareed, Yushkov, Andrey and Loughead, Katherine. 2024 State Business Tax Climate Index. Tax Foundation. October 24, 2023. https://taxfoundation.org/research/all/state/2024-state-business-tax-climate-index/.
- Cato Institute. Freedom in the 50 States, An Index of Personal and Economic Freedom: Tennessee Economic Freedom. [Accessed on February 14, 2024.] https://www.freedominthe50states.org/economic/tennessee.
- American Legislative Exchange Council. Rich States, Poor States 16th Edition: ALEC-Laffer State Economic Competitiveness Index. April 13, 2023. https://alec.org/wp-content/uploads/2023/04/2023-16th-Rich-States-Poor-States.pdf.
- Urban Institute. Revenue Volatility: How States Manage Uncertainty. November 2017. https://www.taxpolicycenter.org/sites/default/files/publication/149171/revenue-volatility_1.pdf.
- Tennessee Department of Revenue. Tennessee Works Act. https://www.tn.gov/revenue/tennessee-works.html#:~:text=The%20legislation%20includes%20a%20three,changes%20to%20Tennessee’s%20tax%20laws.
- Tennessee Department of Mental Health & Substance Abuse Services (TDMHSAS). Announcement of Funding: Community Mental Health & Primary Care. April 20, 2023. https://www.tn.gov/content/dam/tn/mentalhealth/documents/MH_Primary_Care_Integration_AOF.pdf.
- Tennessee Department of Finance and Administration. Tennessee Annual Comprehensive Financial Report for the Fiscal Year Ended June 30, 2023. https://www.tn.gov/content/dam/tn/finance/acfr/ACFR_fy23.pdf.
- Bureau of Economic Analysis. Gross Domestic Product, Fourth Quarter and Year 2023. January 25, 2024. https://www.bea.gov/news/2024/gross-domestic-product-fourth-quarter-and-year-2023-advance-estimate.
- —. GDP by State: Gross Domestic Product by State and Personal Income by State, 3rd Quarter 2023. December 22, 2023. https://www.bea.gov/sites/default/files/2023-12/stgdppi3q23.pdf.
- Tennessee Department of Mental Health & Substance Abuse Services. Crisis Walk-In Centers. [Accessed on February 5, 2024.] https://www.tn.gov/behavioral-health/need-help/crisis-services/walk-in-centers.html.
- Tennessee Department of Finance and Administration. FY 2024 Revenue Tables. https://www.tn.gov/content/tn/finance/news.revenues.html.
- Tennessee Department of Revenue. Notice #23-10: Tennessee Works Tax Act Creates Paid Family and Medical Leave Credit . May 2023. https://www.tn.gov/content/dam/tn/revenue/documents/notices/fae/23-10fe.pdf.