Gross domestic product (GDP) estimates the overall size of an economy. Although it has a variety of shortcomings, GDP is one of the most common metrics used to gauge how economic activity in Tennessee and the U.S. changes over time.
Key Takeaways
- Gross domestic product estimates the total dollar value of all goods and services produced in an economy during a specific period.
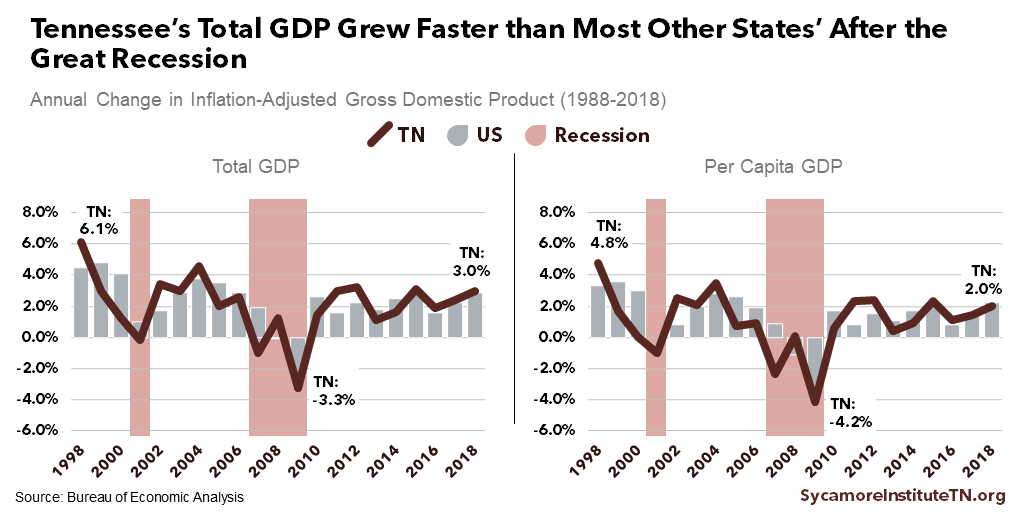
- Tennessee’s GDP grew faster than most other states’ after the Great Recession but slower than during past recovery periods.
- GDP is calculated quarterly and provides a standardized way to track the overall size of an economy over time and across areas.
- While GDP provides valuable information about goods and services, it does not capture many important aspects of and contributions to economic well-being.
This is part of our series on the pros and cons of five common ways to measure prosperity and economic growth in Tennessee.
What is GDP?
Gross domestic product estimates the total dollar value of all goods and services produced in an economy during a specific period. It includes spending by consumers, businesses, and government, as well as the net value of goods produced in Tennessee and exported to other states and countries (i.e. exports minus imports). Popular discourse often cites GDP as an indicator of broad economic well-being, but the metric has its limitations.
People use variations of GDP to describe, compare, and track economic changes in different ways. Total GDP and per capita GDP, which is adjusted for population size, are often used for comparisons between multiple states or countries. “Real” GDP is adjusted for inflation to allow apples-to-apples comparisons of how economic activity changes over time. Businesses and investors often consider GDP when determining how to allocate resources, and the Federal Reserve uses it to help guide monetary policy, such as setting interest rates. (2)
Tennessee’s Gross Domestic Product
Tennessee’s GDP grew faster than most other states’ after the Great Recession but slower than during the previous period of economic expansion (Figure 1). Measured in total GDP, Tennessee had the 19th largest economy in the U.S. in 2018 at $365 billion. Our per capita GDP ranked 37th. (3) (4) Since the Great Recession officially ended in 2009, Tennessee’s real GDP has grown by an average of 2.3% per year — tied for the 11th fastest growth in the country and just above the national rate of 2.2%. (5) During the prior economic recovery between 2001 and 2006, however, real GDP growth in Tennessee averaged 3.1% annually. (5)
Figure 1
Trade-Offs of Using GDP to Measure Prosperity
Advantages of the Measure
Gross domestic product offers one main advantage for tracking and quantifying overall economic activity. (2) (6) (7)
- GDP provides a standardized way to track the overall economy of an area over time and compare the economies of different regions. The U.S. Bureau of Economic Analysis calculates GDP every quarter at the national, state, and metro area levels. Compared to other readily-available and routinely-reported metrics, GDP is a relatively robust way to measure economic activity. It provides information about economic growth, the sources of economic production, how different industries are faring, and the portion of growth that is due to inflation.
Limitations of the Measure
Gross domestic product also has several characteristics that prevent it from offering a comprehensive picture of economic activity and well-being. (2) (7) (8) (9) (10) (11) (12)
- GDP does not count many activities that affect the size of the economy and economic well-being and security. For example, productive activities like volunteering, childcare, cooking, cleaning, and household errands generally do not show up in GDP calculations unless the practitioner is paid. Even when these are paid labors, they may occur “off the books” in the shadow economy of both legal and illegal activities not reported to government authorities.
- Economic well-being involves aspects that GDP does not attempt to quantify. Health status, education, social connections, and economic stratification and mobility all affect the well-being of people and society. GDP also does not quantify the value or depletion of assets like natural resources and infrastructure, which limits the metric’s ability to provide insights into longer-term economic security and sustainability.
- GDP does not account for whether the circumstances around different types of spending or production are “good” or “bad” for overall well-being. For example, spending associated with recovery from natural or environmental disasters increases GDP the same as building homes or exporting goods, yet GDP does not fall when a tornado or coal ash spill destroys a home.
- GDP makes assumptions about the prices and value of goods and services that might not reflect the value consumers receive or changes in quality over time. For example, technological advances may result in goods that are cheaper but deliver more value than in the past (e.g. phones, computers, and televisions).
References
Click to Open/Close
- U.S. Bureau of Economic Analysis (BEA). Real GDP by State: All Industry Total (Percent Change from Preceding Period). [Online] May 1, 2019. [Cited: October 25, 2019.] Accessed via https://apps.bea.gov/itable/index.cfm.
- —. Measuring the Economy: A Primer on GDP and the National Income and Product Accounts. [Online] December 2015. https://www.bea.gov/sites/default/files/methodologies/nipa_primer.pdf.
- —. Gross Domestic Product by State: All Industry Total (Millions of Current Dollars). [Online] May 1, 2019. [Cited: October 25, 2019.] Accessed via https://apps.bea.gov/itable/index.cfm.
- —. Per Capita Real GDP by State (Chained 2012 Dollars). [Online] May 1, 2019. [Cited: October 25, 2019.] Accessed via https://apps.bea.gov/itable/index.cfm.
- —. Compound Annual Growth Rate Between Two Periods of Real GDP in Chained Dollars by State. [Online] May 1, 2019. [Cited: October 25, 2019.] Accessed via https://apps.bea.gov/itable/index.cfm.
- Katz, Arnold J. An Overview of BEA’s Source Data and Estimating Methods for Quarterly GDP. U.S. Bureau of Economic Analysis. [Online] 2006. https://www.bea.gov/system/files/papers/P2006-8.pdf.
- Giannetti, B F, et al. A Review of Limitations of GDP and Alternative Indicies to Monitor Human Well-Being and to Manage Eco-System Functionality. Journal of Cleaner Production, 87(11-25). [Online] 2015. http://www.advancesincleanerproduction.net/papers/journals/2014/2014_jcp.pdf.
- Dynan, Karen and Sheiner, Louise. Huthcins Center Working Paper #43: GDP as a Measure of Economic Well-Being. Hutchins Center on Fiscal & Monetary Policy at Brookings. [Online] August 2018. https://www.brookings.edu/wp-content/uploads/2018/08/WP43-8.23.18.pdf.
- Cha, Mijin. What’s Missing from GDP? Demos. [Online] January 29, 2013. https://www.demos.org/publication/whats-missing-gdp.
- Dobbs, Richard, Remes, Jaana and Woetzel, Jonathan. Is GDP the Best Measure of Growth? McKinsey Global Institute. [Online] January 2015. https://www.mckinsey.com/featured-insights/employment-and-growth/is-gdp-the-best-measure-of-growth.
- Lange, Glenn-Marie, Wodon, Quentin and Carey, Kevin. The Changing Wealth of Nations 2018 : Building a Sustainable Future. The World Bank. [Online] January 30, 2018. https://openknowledge.worldbank.org/handle/10986/29001.
- Bate, Roger. What is Prosperity and How Do We Measure It? American Enterprise Institute. [Online] October 27, 2009. http://www.aei.org/publication/what-is-prosperity-and-how-do-we-measure-it/.