Key Takeaways
- A growing share of Tennessee adolescents report poor mental health, symptoms of depression, and attempting suicide. Youth suicide death rates have also increased.
- While girls in Tennessee are more likely to report struggling with mental health challenges, boys are significantly more likely to die by suicide.
- Tennessee’s rates of youth mental and behavioral health challenges are in line with national rates, but kids in Tennessee needing services are less likely to receive them.
- Available data suggest uneven geographic access to mental health providers within Tennessee.
- A significant lack of data prevents a detailed understanding of the status of child mental health in Tennessee and how it varies by age, geography, and child and family characteristics.
Positive child mental health is the foundation for lifelong health, happiness, and success. Mental and behavioral health, early experiences, and support can affect whether children hit appropriate developmental milestones and learn skills to cope and build resilience for the future. (1) (2)
Nationally, child mental health indicators have been trending in the wrong direction for the last decade — exacerbated by the COVID-19 pandemic. (3) (2) (4) Most children display signs of positive mental health, but conditions such as anxiety and depression have risen rapidly over the past several years. (5) Although stigma certainly remains a barrier to diagnosis and treatment, the recent increases are partially explained by a greater willingness to acknowledge mental health challenges than in the past. (6) (7) The pandemic socially isolated children, disrupted routines at critical developmental stages, heightened family stress, and exacerbated disparities in access to mental health care — particularly for those who rely on school-based services. (8)
This report synthesizes information from multiple data sources about the current state of child mental health in Tennessee. It is the start of a multi-part series examining relevant policies and programs striving to support children and adolescents.
Navigating This Report
This report draws from multiple state and national data sources that cover different age ranges, time periods, demographics, and conditions (see About Our Data and Appendix Table 1). It begins with available information about Tennessee youth ages 3-17 and 6-17 and then looks more closely at high schoolers, teens, and access to care. It is generally structured as broad-to-specific for each age group — beginning with prevalence estimates for the age groups and then digging into breakdowns of those numbers, changes over time, and national comparisons.
About Our Data
Our report relies on multiple data sources that each give insight, but none provide a comprehensive picture of mental health across all ages, demographics, time, or geography (see Appendix Table 1). For example, the National Survey on Children’s Health (NSCH) asks parents of youth ages 3-17 about a broad range of physical and behavioral health issues. State-level estimates can be broken down by demographics and other child and household characteristics but only for a very limited number of mental health measures and for two time periods that span four years. Meanwhile, the Youth Risk Behavior Surveillance System (YRBSS) provides greater insight into mental health challenges and related behaviors by grade, gender, and race/ethnicity over nearly two decades, but it relies on self-reported data from high schoolers only.
Across data sources, mental and behavioral health conditions can also be defined and gauged differently and are often lumped together. Some surveys ask about whether someone has symptoms of a mental health condition, such as depression, while others ask about clinical diagnoses. The terms mental health and behavioral health are also used in different ways to categorize types of mental and behavioral health conditions. For example, NSCH’s state-level estimates on the prevalence of mental, emotional, developmental, or behavioral problems is an aggregate measure that includes everything from depression to learning disorders to attention-deficit/hyperactivity disorder (ADD/ADHD).
Accurately assessing mental and behavioral health can also be tricky because of the influence of stigma and access to diagnostic care. For example, national studies have shown that people may be less likely to report experiencing these conditions because of stigma — which can manifest in different ways across cultures and generations. Furthermore, there are many reasons a child may not receive a diagnosis even if a condition is a present — including access to and frequency of use of health care services. In fact, the 2023 Vanderbilt Child Health Poll estimates that 20% of Tennessee parents were concerned their children had undiagnosed anxiety. (11)
Youth Mental and Behavioral Health in Tennessee
State and national sources suggest that ADD/ADHD, anxiety, and depression are the top mental and behavioral health issues facing youth in Tennessee. However, in many instances, only aggregate prevalence measures are available, which group a broad spectrum of mental and behavioral health conditions together.
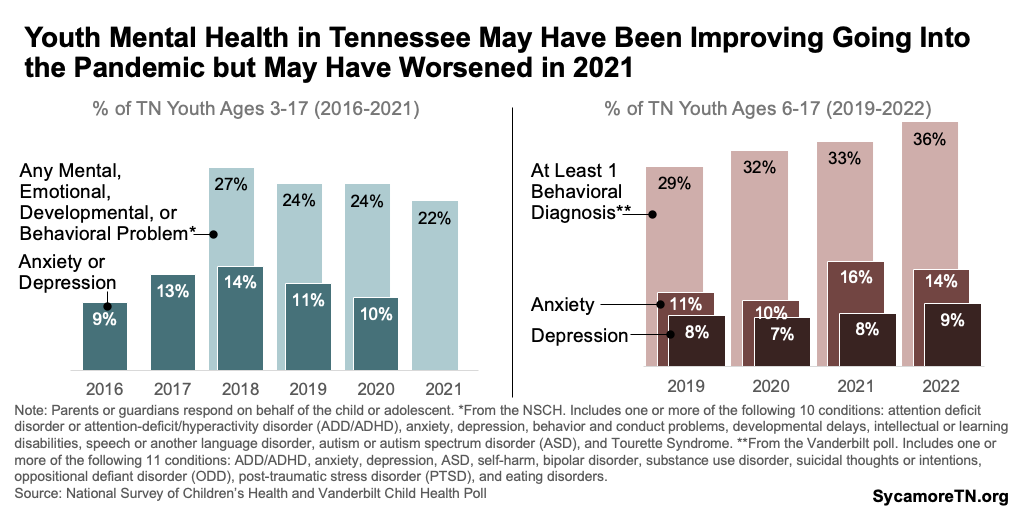
- National Survey Data — According to 2020-2021 national data, nearly one in four Tennessee youth ages 3-17 had been told they have at least one of 10 mental, emotional, developmental, or behavioral problems (Figure 1). Of the 10 conditions, attention deficit disorder or attention-deficit/hyperactivity disorder (ADD/ADHD) was most common — affecting about 11% or 141,000 of those ages 3-17. (9) Data from 2020 show that about 10% of this population had anxiety and/or depression.(10) Other conditions included behavior and conduct problems, developmental delays, intellectual or learning disabilities, speech or another language disorder, autism or autism spectrum disorder (ASD), and Tourette Syndrome.
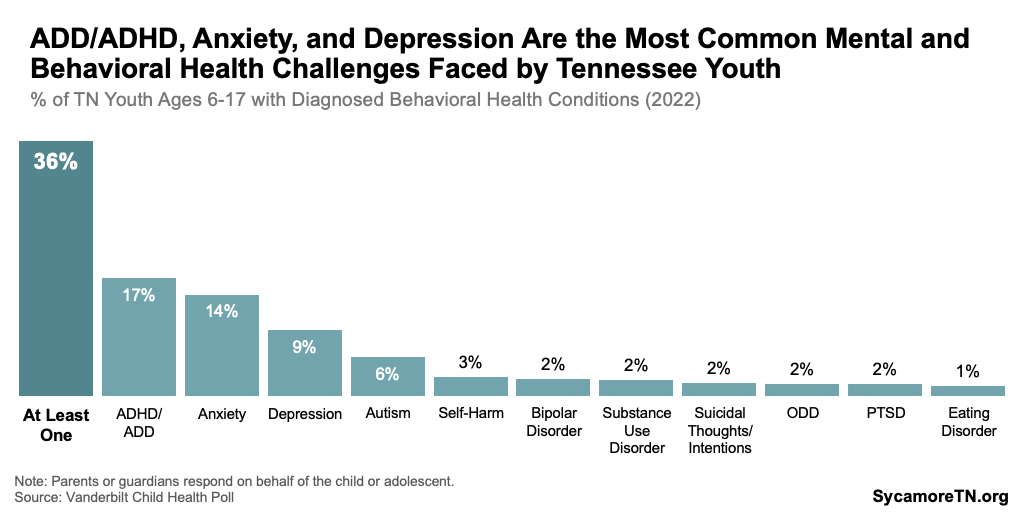
- State Polling Data — The 2023 Vanderbilt Child Health Poll estimated that 36% of youth ages 6-17 statewide had been diagnosed with at least one of 11 behavioral health conditions in 2022 (Figure 2). Of these, ADD/ADHD was again most common — affecting about 17% or those ages 6-17. Anxiety and depression were also close behind at 14% and 9%, respectively. The other conditions included ASD, self-harm, bipolar disorder, substance use disorder, suicidal thoughts or intentions, oppositional defiant disorder (ODD), post-traumatic stress disorder (PTSD), and eating disorders. (11)
Figure 1
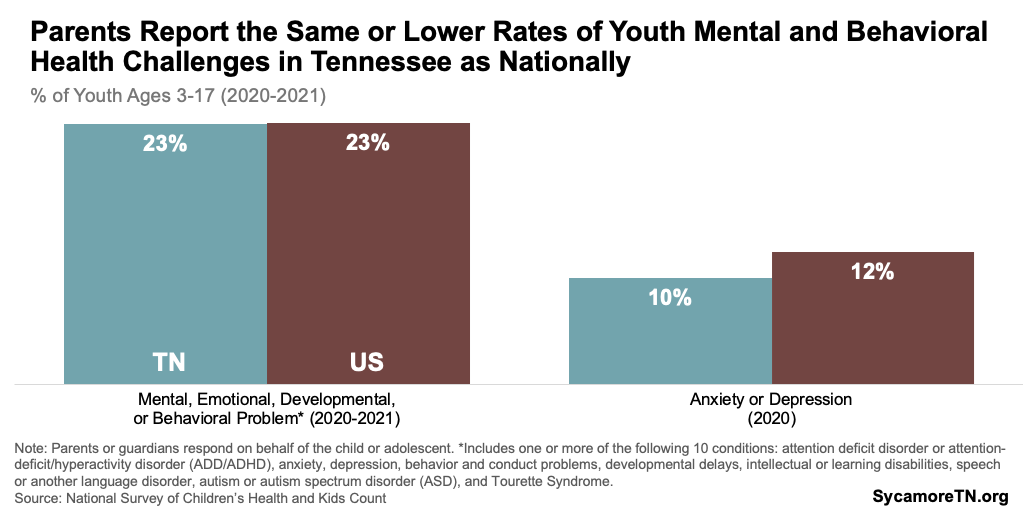
Figure 2
Demographic Variation in Youth Mental and Behavioral Health
Available data show differences in the prevalence of these conditions across demographics, socioeconomic status, upbringing, and geography.
- National Survey Data — The 2020-2021 national data show that those most likely to have at least one of the 10 problems listed above are older youth, boys, white, have experienced two or more adverse childhood experiences (ACEs), and in families with lower incomes (Figure 3). (9)
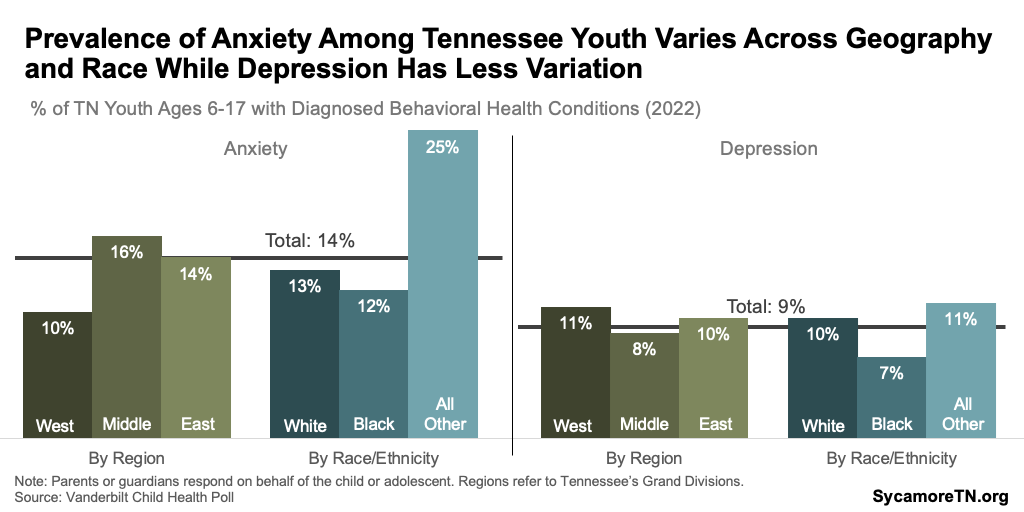
- State Polling Data — The Vanderbilt poll found the highest rates of anxiety among youth in 2022 in Middle Tennessee and of depression in West Tennessee. Both anxiety and depression were highest among youth of a race or ethnicity other than non-Hispanic black or white (Figure 4).(11)
Figure 3
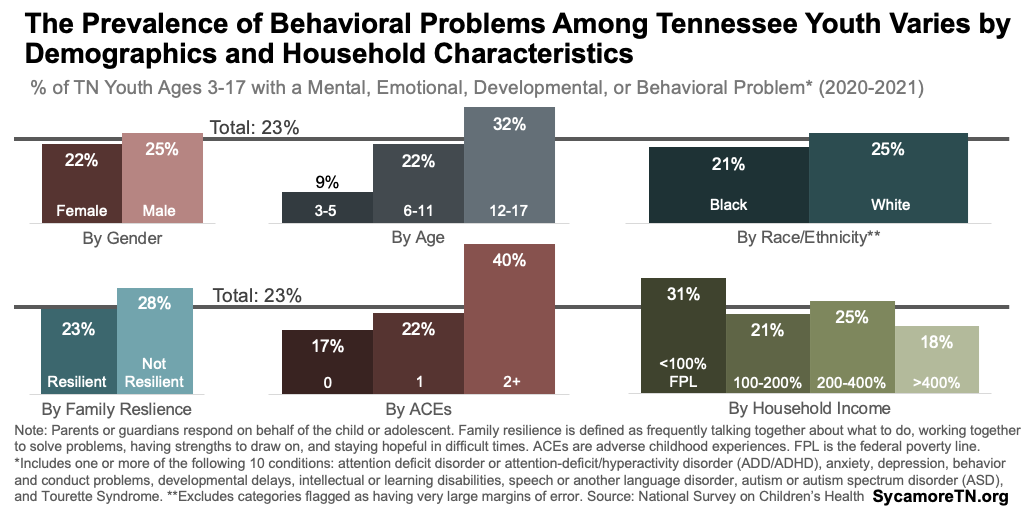
Figure 4
Trends in Youth Mental and Behavioral Health
Together, the available data suggest that rates of anxiety and depression may have been improving before the pandemic but ticked back up in 2021 (Figure 5). The national survey data estimate that the prevalence of anxiety or depression among Tennessee youth ages 3-17 fell from 14% in 2018 to 10% in 2020. (9) A more recent Vanderbilt poll shows that anxiety surged in the year after the pandemic’s start — increasing from 10% of six to 17-year-olds in 2020 to 16% in 2021. (11)
Figure 5
Youth Mental Health in Tennessee Compared to Other States
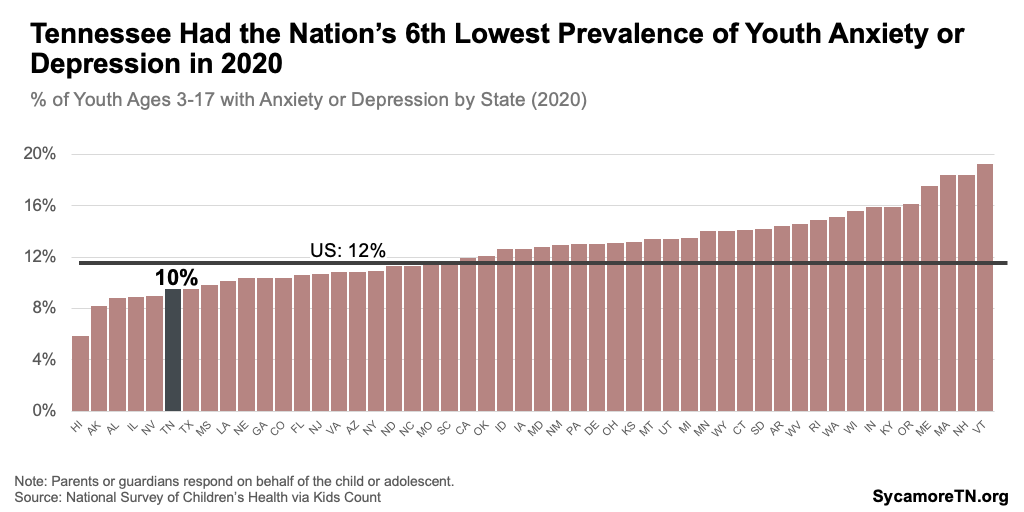
Parents of Tennessee youth report lower rates of mental and behavioral health challenges than parents nationally. Tennessee had the 6th lowest rate of anxiety or depression in 2020 (Figure 6) and the 17th lowest percentage of children with at least one mental, emotional, developmental, or behavioral problem in 2020-2021. (9)
Figure 6
About Our Terminology
Mental health refers to emotional and psychological well-being. (27) Generally, behavioral health focuses on the actions and behaviors that influence well-being — including substance use and self-injury. (27) Mental and behavioral health conditions can vary in severity and the extent to which a person is affected in their day-to-day life.
Below, we include definitions for the most diagnosed mental and behavioral disorders among kids nationally. (5) Importantly, children and adolescents can have more than one, in which case they would be considered co-occurring conditions. Mental health conditions can also co-occur with substance use and other behavioral health conditions.
- Attention-Deficit/Hyperactivity Disorder (ADHD) is characterized by inattentiveness, hyperactivity, and impulsivity. It affects children’s academic performance, social interactions, and self-esteem. (5)
- Anxiety Disorders includes generalized, social, and separation anxiety disorders. These conditions cause excessive worry, fear, and avoidance behaviors that interfere with daily functioning and healthy development. (5)
- Behavior or Conduct Problems includes aggression, defiance, disruptive behaviors, and difficulties adhering to social norms and rules. (28) Children with behavioral or conduct problems often have trouble establishing positive relationships, succeeding academically, and engaging in social interactions.
- Depressive Disorders includes major depressive disorder and persistent depressive disorder. Symptoms may include persistent sadness, loss of interest, changes in appetite and sleep patterns, and difficulties concentrating. (5) Major depressive episode (MDE) from the SAMHSA data is based on the clinical definition of experiencing a depressed mood or loss of interest in daily activities with majority of specified depressive symptoms. (25)
Adolescent Mental and Behavioral Health in Tennessee
National survey data provide a more robust picture of the challenges facing adolescents and high schoolers. This section summarizes data collected from high schoolers on measures of mental health, ranging from symptoms of depression to drug use to suicidal ideation and deaths.
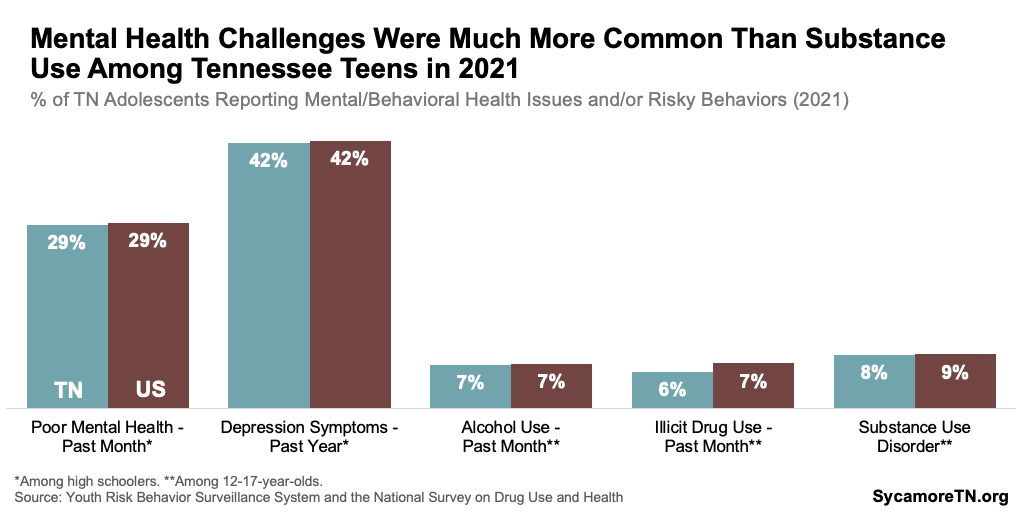
In 2021, 29% of Tennessee high school students reported experiencing poor mental health in the past month, while over 40% had symptoms of depression in the prior year (Figure 7). Poor mental health was defined as experiencing stress, anxiety, and depression during the 30 days before the survey. For symptoms of depression, students were asked if they had felt sad or hopeless such that they stopped doing some usual activities almost every day for two or more weeks in a row during the 12 months before the survey. (12)
Substance use and substance use disorders among Tennessee teens were much less common than mental health challenges in 2021 (Figure 7). In 2021, fewer than 10% had used either alcohol or illicit drugs in the month before the survey, only 3% had engaged in binge drinking in the past month, and less than 2% had misused an opioid in the prior year. All told, about 8% of Tennessee youth ages 12-17 reported having a substance use disorder in 2021. (13)
Figure 7
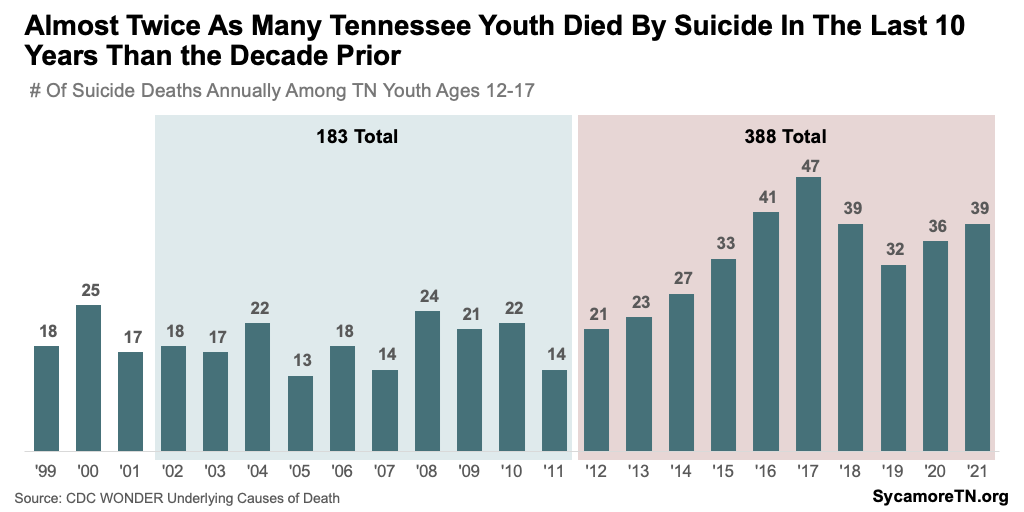
In 2021, nearly one in four Tennessee high schoolers seriously considered attempting suicide, more than 1 in 10 tried, and 39 adolescents 12-17 died from suicide (Figure 8 and 9). (12) (14) Suicide is one the of the most severe outcomes that can result from poor mental health and well-being. Risk factors for suicide include previous attempts, feeling hopeless or lonely, experiencing a stressful life event, abuse, or bullying; and having a psychiatric or substance use disorder, among others. (15)
Figure 8
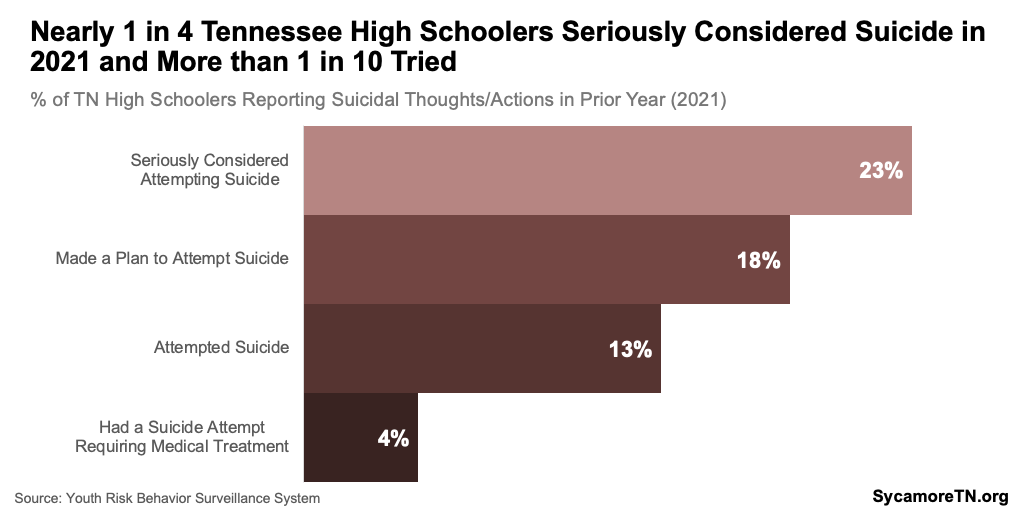
Figure 9
Demographic Variation in Adolescent Mental and Behavioral Health
Each measure of mental health varies — sometimes dramatically — based on demographic characteristics like gender, race and ethnicity, and grade level. State-level demographic breakdowns of data on youth substance use and substance use disorder are not available. State-level estimates of prevalence by other characteristics like socioeconomic status, family circumstances, and sexual orientation are also not available. Key findings from the available 2021 data are described below.
Differences by Gender
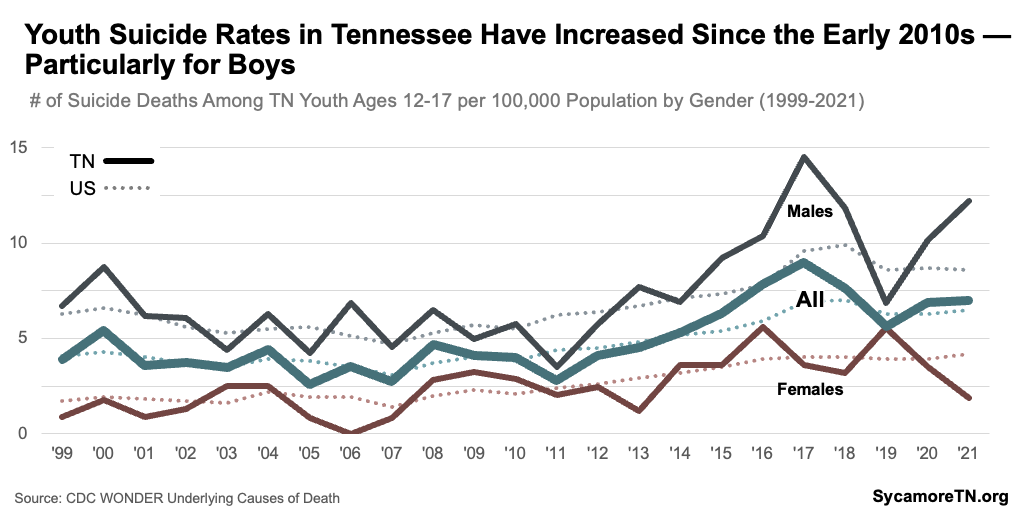
Girls are much more likely to report struggling with mental health and suicidal thoughts, but boys have significantly higher suicide death rates. Female high school students are significantly more likely to report poor mental health in the past month, depressive symptoms in the past year, and suicidal thoughts and actions (Figures 10 and 11). (12) However, Tennessee boys ages 12-17 had a suicide death rate six times higher than that of girls in 2021 (Figure 12) — and almost three times higher than that of girls over the course of the last decade (Figure 13). (14)
Figure 10
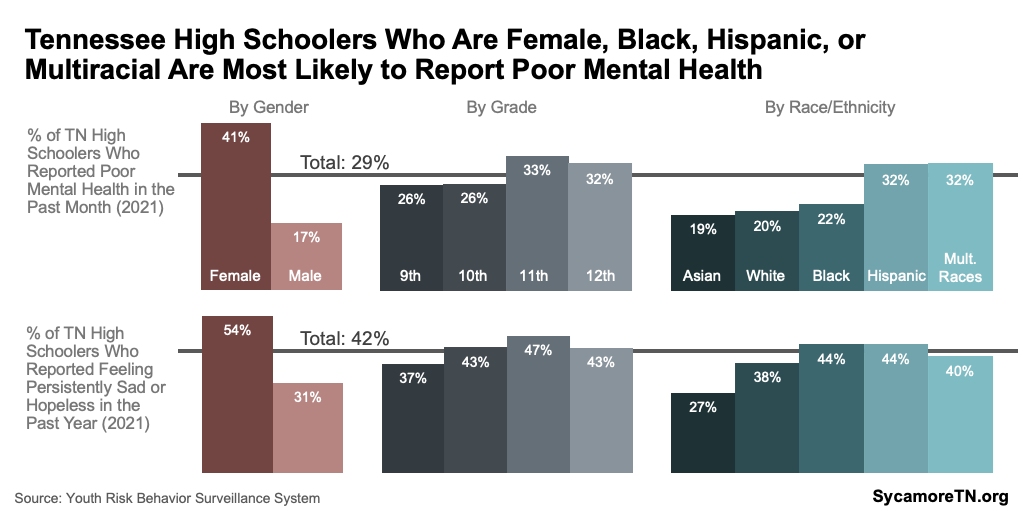
Figure 11
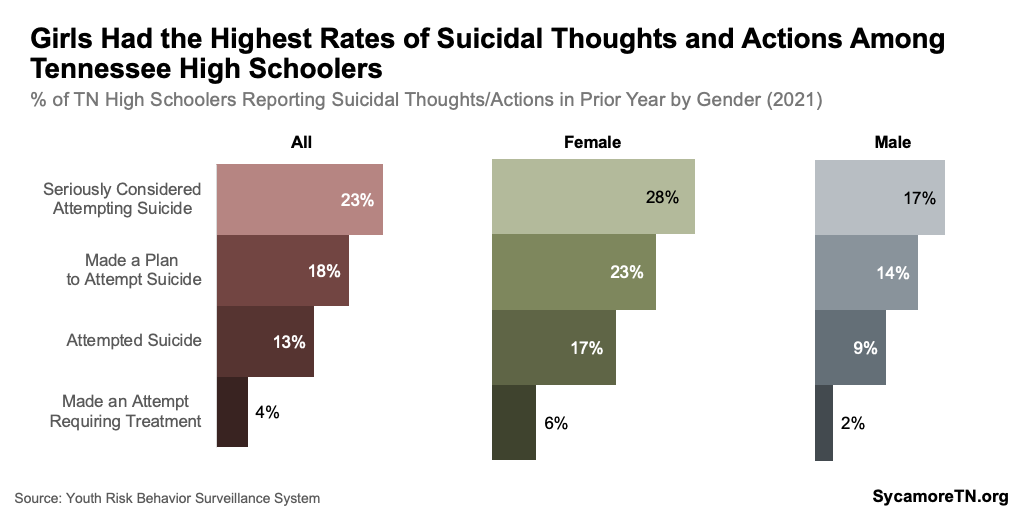
Figure 12
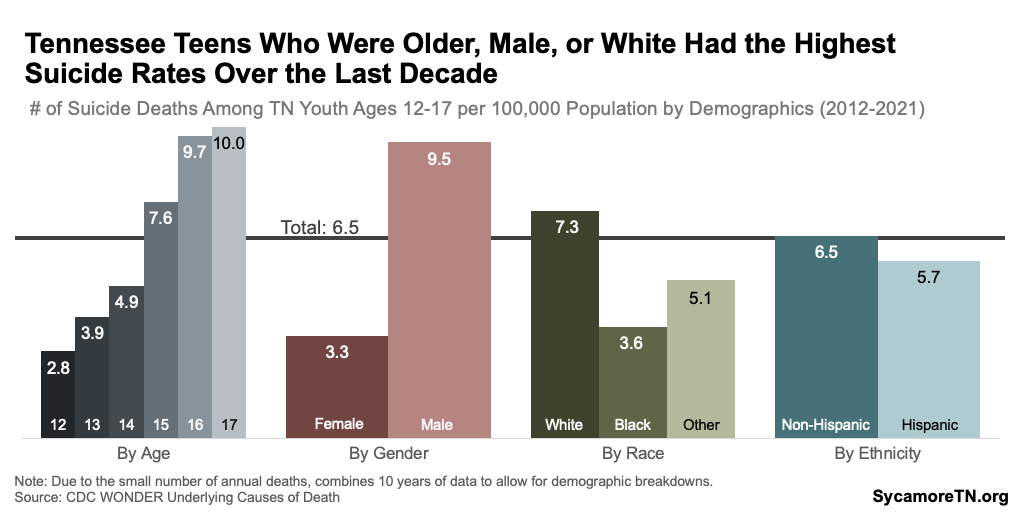
Figure 13
Differences by Race and Ethnicity
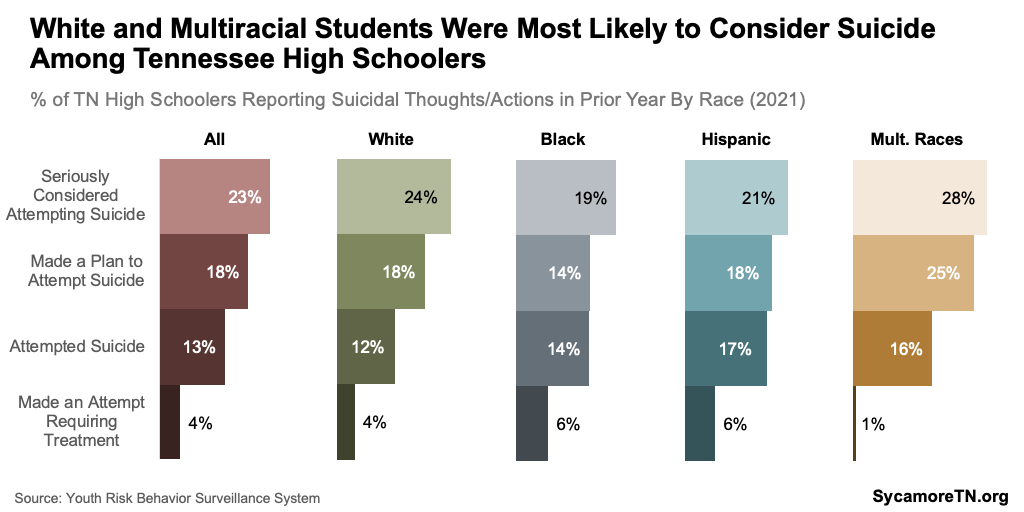
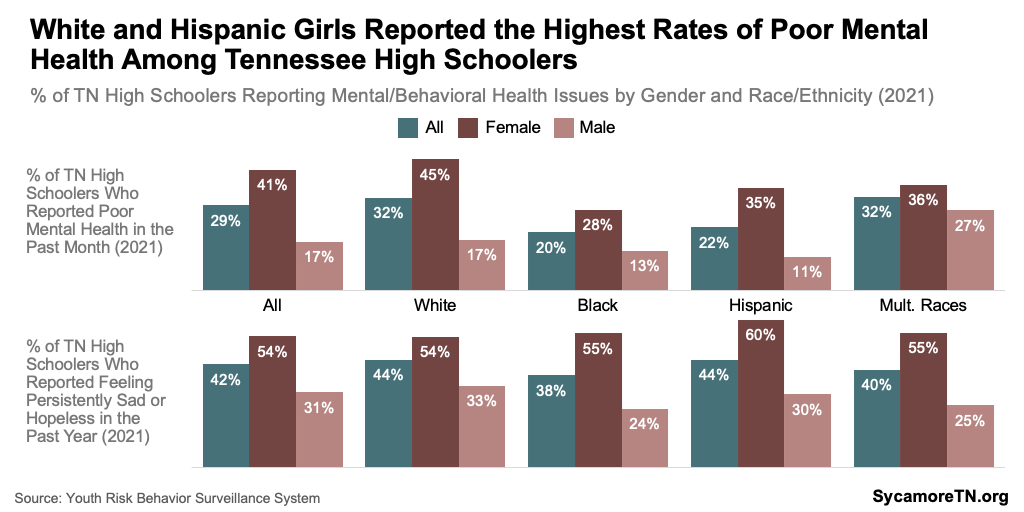
Hispanic and multiracial high schoolers were most likely to report poor mental health, while black and Hispanic students were most likely to report symptoms of depression (Figure 10). Along the continuum from suicidal thoughts to actions, multiracial and white students were most likely to have seriously considered suicide (Figure 14). Hispanic and multiracial students had the highest attempt rate, but white, non-Hispanic adolescents had the highest suicide death rates (Figures 12 and 14). (12) (14)
Figure 14
Differences by Gender and Race/Ethnicity
Among girls, white Tennessee high schoolers reported the highest rates of poor mental health — and among boys, multiracial students had the highest rates (Figure 15). The rate of poor mental health among white, female high schoolers was, for example, about 60% higher than the rate among black, female students. The rate among multiracial, male students was over 140% higher than for Hispanic, male students. Within each gender, reports of depressive symptoms did not vary considerably across race and ethnicity. (12)
Figure 15
Differences by Grade and Age
Eleventh graders and older adolescents had the highest rates of mental health challenges and suicide deaths, respectively. Eleventh graders reported the highest rates of poor mental health, depression, and suicidal thoughts (Figure 10). In 2021, nearly half of Tennessee’s 11th grade students reported feeling sad or hopeless for two or more consecutive weeks in the past year. Over the past decade, suicide death rates were highest among 16 and 17-year-olds — the typical ages of 11th graders (Figure 12). (12) (14)
Differences by Geography
Very limited data exist to provide a picture of how mental health varies among older youth across Tennessee. Two sources provide some insight:
- Suicide Mortality Data — Between 2001-2020, only the 11 most populous counties had 10 or more youth suicides, the threshold for reporting data — Blount, Davidson, Hamilton, Knox, Montgomery, Rutherford, Shelby, Sullivan, Sumner, Williamson, and Wilson. About half of these counties had rates notably higher than the statewide rate of 4.8 deaths per 100,000 12 to 17-year-olds — including Montgomery County, whose rate was twice that of the statewide rate for this period (Figure 16). (14)
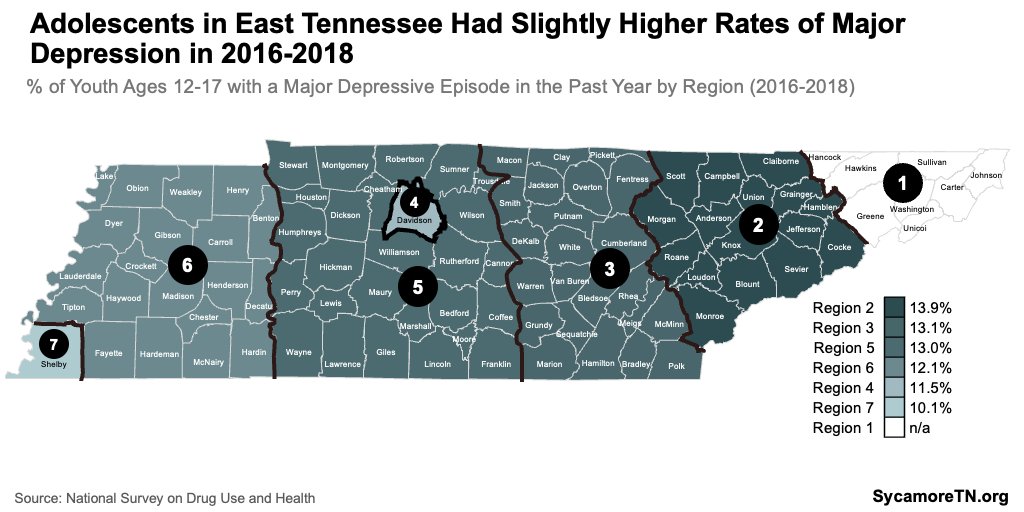
- Major Depressive Episodes — Federal behavioral health data shows how the prevalence of experiencing a major depressive episode varies across seven regions. These data show that a slightly higher share of youth ages 12-17 experienced major depression in East Tennessee than those in Middle and West over the course of 2016-2018 (Figure 17).(16)
Figure 16
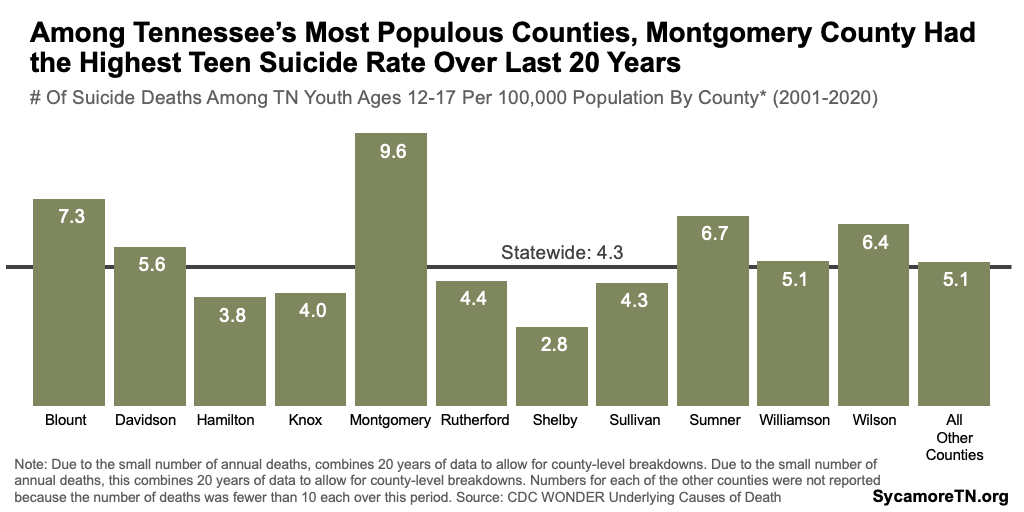
Figure 17
Trends in Adolescent Mental and Behavioral Health
Overall, the symptoms and negative outcomes of poor adolescent mental health have been trending upward since the early-to-mid 2010s.(12)
- Depression — Beginning around 2015, the percentage of high school students reporting symptoms of depression began consistently increasing — largely following the national trend. Girls reported persistently higher rates than boys, but both increased at about the same pace during this period (Figure 18). (12)
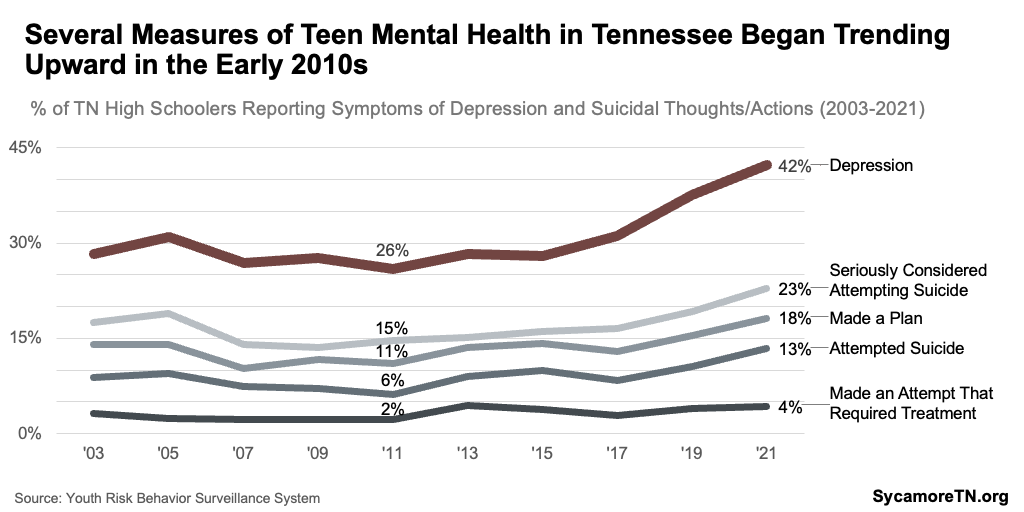
- Suicide — As rates of depressive symptoms trended upward, so did suicidal thoughts, attempts, and deaths (Figures 13 and 19). Rates of suicidal ideation and actions had remained relatively consistent for about a decade but began a to rise quickly in about 2017 (Figure 19). Likewise, youth suicide deaths began increasing rapidly in the early 2010s compared to the prior decade. After a spike in 2017, rates fell, but began to rise again in 2020 (Figure 13). Both the number and rate of suicide deaths among 12 to 17-year-old Tennesseans were at some of their highest levels in 2021 — with a growing gap between males and females in 2020 and 2021 (Figures 9 and 13). (12) (14)
Figure 18
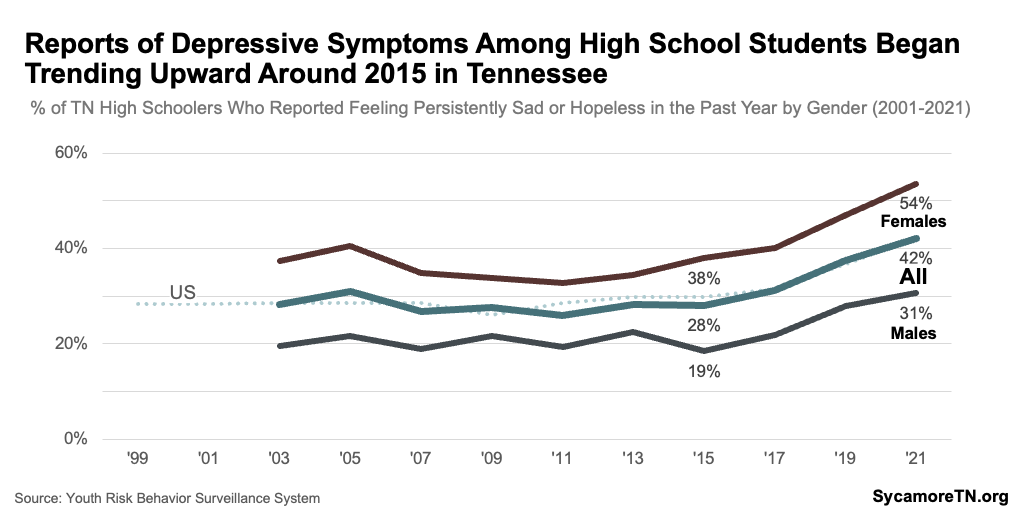
Figure 19
Adolescent Mental Health in Tennessee Compared to Other States
For nearly all available measures of mental health and well-being, Tennessee’s rates are about the same or better than national rates — with the exception of suicide attempts (Figures 7 and 13). High schoolers in Tennessee report poor mental health and depressive symptoms at the same rates as high schoolers nationally. The prevalence of alcohol use and substance use disorders are also about the same, though illicit drug use is lower here. While youth suicide death rates were about the same, 13% of Tennessee high schoolers reported attempting suicide in 2021 — compared to 10% nationally. (12) (14)
Access to Care
Treatment for mental and behavioral health conditions can improve quality of life and reduce the risk of injury or death for those experiencing serious mental or behavioral health crises. Access to treatment can be affected by health insurance coverage, affordability of care, proximity to providers, wait times for treatment, and stigma associated with mental and behavioral health. Studies have also found that access can be limited by a lack of knowledge of where and how to seek treatment. (17) (18) (19) (20)
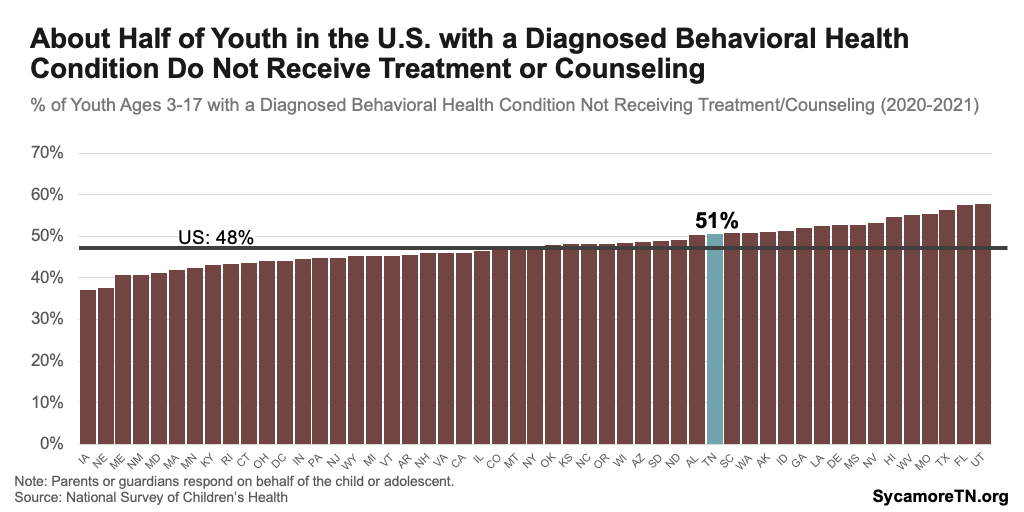
Youth with mental and behavioral health conditions are less likely to receive treatment in Tennessee than most other states, and about half do not receive any specialized treatment. In 2022, about half of youth ages 6-17 diagnosed with at least one of the 11 behavioral health conditions in the Vanderbilt Health Poll were not receiving mental health services (Figure 20). (11) National data similarly showed that about 51% of children 3-17 with a diagnosed mental or behavioral condition in Tennessee did not receive treatment or counseling — the 16th highest rate in the country (Figure 21). (9) Among parents in the Vanderbilt Poll who felt their child had an unmet need for mental health services, the top reasons cited were cost, conflicting work schedules, and providers not accepting their insurance. (11)
Figure 20
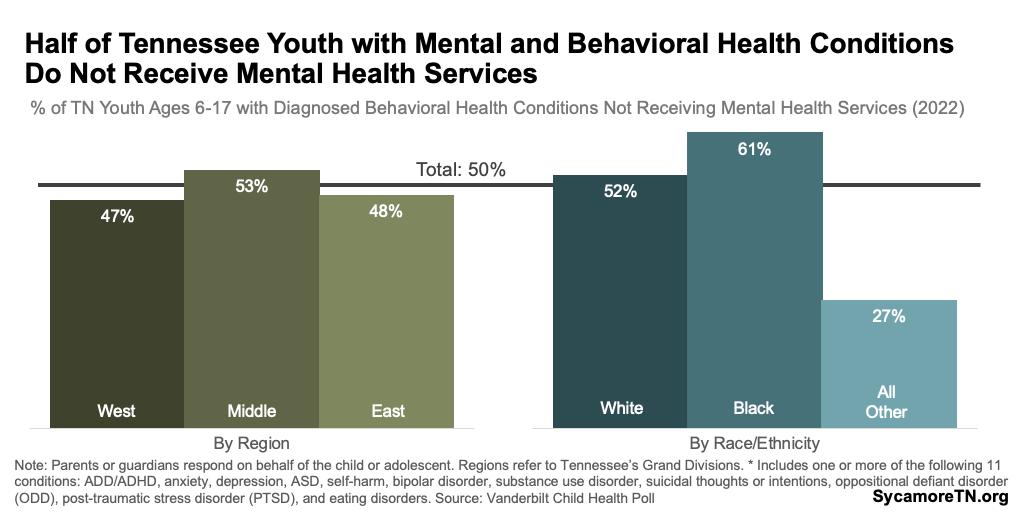
Figure 21
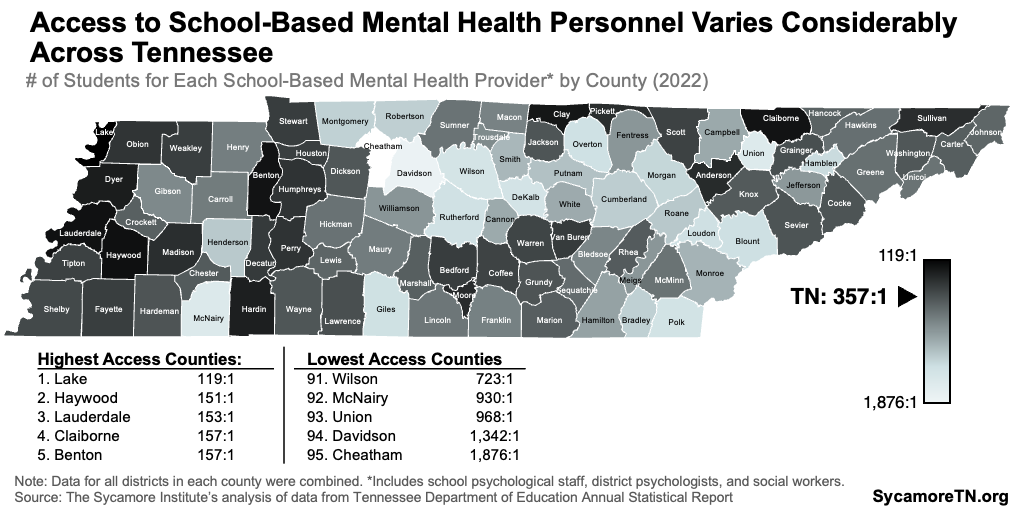
Limited available data also suggest uneven geographic access to mental health providers within Tennessee. Even after accounting for population differences, mental health providers are generally concentrated in the state’s most populous counties (Figure 22). However, this measure includes all mental health providers and not just pediatric specialists. (21) (22) Meanwhile, access to school-based mental health personnel — including psychiatrists and social workers — varies considerably (Figure 23). In Lake County, there were 119 public K-12 students for every provider in the 2021-2022 school year, while Cheatham County had about 1,900 for each of these providers. (23)
Figure 22
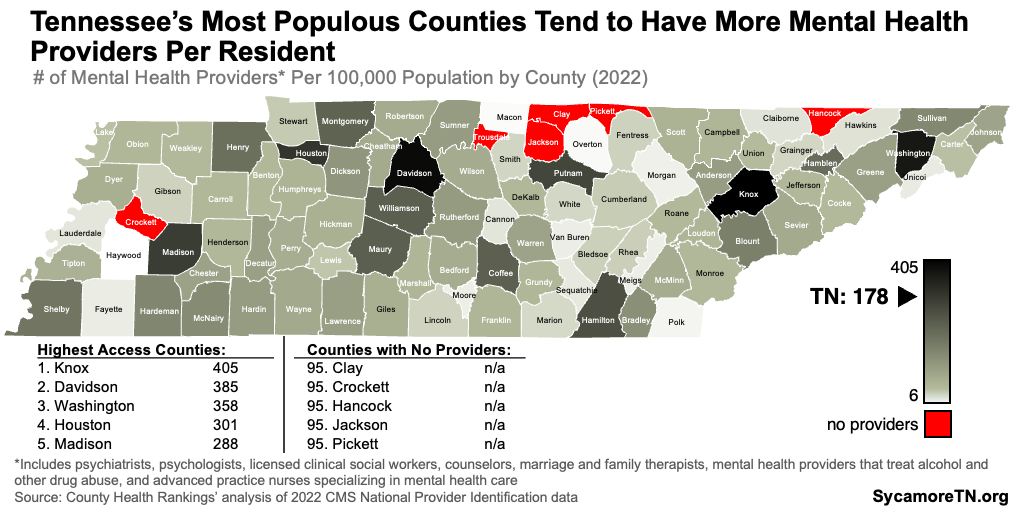
Figure 23
Parting Words
Overall, the data presented in this report give a starting point for understanding the level of need for mental and behavioral health services among youth in Tennessee. It also highlights opportunities to improve data collection on mental and behavioral well-being for certain groups of children and adolescents in the state.
References
Click to Open/Close
References
- Shim, Ruth, Szilagyi, Moira and Perrin, James. Epidemic Rates of Child and Adolescent Mental Health Disorders Requires an Urgent Response. Pediatrics. April 2022. https://publications.aap.org/pediatrics/article/149/5/e2022056611/184904/Epidemic-Rates-of-Child-and-Adolescent-Mental
- U.S. Centers for Disease Control and Prevention (CDC). Children’s Mental Health: Understanding an Ongoing Public Health Concern. February 25, 2022. [Accessed on June 12, 2023.] https://www.cdc.gov/childrensmentalhealth/features/understanding-public-health-concern.html
- Theberath, Monique, et al. Effects of COVID-19 Pandemic on Mental Health of Children and Adolescents: A Systematic Review of Survey Studies. Sage Open Medicine. March 2022. https://www.ncbi.nlm.nih.gov/pmc/articles/PMC8972920/#:~:text=Conclusion%3A,are%20the%20most%20observed%20symptoms
- The U.S. Surgeon General’s Advisory. Protecting Youth Mental Health. U.S. Department of Health and Human Services (HHS). 2021. https://www.hhs.gov/sites/default/files/surgeon-general-youth-mental-health-advisory.pdf
- U.S. Centers for Disease Control and Prevention (CDC). Data and Statistics on Children’s Mental Health. March 8, 2023. [Accessed on June 19, 2023.] https://www.cdc.gov/childrensmentalhealth/data.html
- Bethune, Sophie. Survey: Americans Becoming More Open About Mental Health. American Psychological Association. May 1, 2019. https://www.apa.org/news/press/releases/2019/05/mental-health-survey
- Harvard TH Chan School of Public Health. The Impact of the COVID-19 Pandemic on Children’s Mental Health. Population Mental Health. March 7, 2022. https://www.hsph.harvard.edu/population-mental-health/2022/03/07/the-impact-of-the-covid-19-pandemic-on-childrens-mental-health/
- University of Massachusetts. Behavioral Health Capacity of Massachusetts Schools Districts: Technical Report. Behavioral Health Integrated Resources for Children Project. 2020. https://www.umb.edu/editor_uploads/images/centers_institutes/birch/BIRCh_Technical_Report.pdf
- The Child and Adolescent Health Measurement Initiative. National Survey of Children’s Health (2016-present). Data Resource Center for Child and Adolescent Health supported by the U.S. Health Resources and Services Administration (HRSA) Maternal and Child Health Bureau. Accessed on June 1, 2023 from https://www.childhealthdata.org/browse/survey.
- Kids Count Data Center. Children and Teens with Anxiety or Depression. Child Trends Analysis of Data from the National Survey of Children’s Health. August 2022. Accessed from https://datacenter.aecf.org/data/tables/11429-children-and-teens-with-anxiety-or-depression.
- Vanderbilt Center for Child Health Policy. Vanderbilt Child Health Poll (2020-2023). Vanderbilt University Medical Center. 2023. Accessed from https://www.vumc.org/childhealthpolicy/child-health-poll.
- U.S. Centers for Disease Control and Prevention (CDC). Youth Risk Behavior Surveillance System (YRBSS). 2023. Accessed from https://www.cdc.gov/healthyyouth/data/yrbs/index.htm.
- U.S. Substance Abuse and Mental Health Services Administration (SAMHSA). 2021 NSDUH: Model-Based Estimates for Prevalence for States. January 4, 2023. Accessed from from https://www.samhsa.gov/data/report/2021-nsduh-state-prevalence-estimates.
- U.S. Centers for Disease Control and Prevention (CDC). National Center for Health Statistics, National Vital Statistics System. Underlying Causes of Death (1999-2021). Accessed from http://wonder.cdc.gov/ucd-icd10-expanded.html and https://wonder.cdc.gov/ucd-icd10.html.
- Mayo Clinic Staff. Suicide and Suicidal Thoughts. Mayo Clinic. July 19, 2022. [Accessed on June 16, 2023.] https://www.mayoclinic.org/diseases-conditions/suicide/symptoms-causes/syc-20378048
- U.S. Substance Abuse and Mental Health Services Administration (SAMHSA). 2016-2018 NSDUH Substate Region Estimates By Age Group. National Survey of Drug Use and Health. July 8, 2020. Accessed from https://www.samhsa.gov/data/report/2016-2018-nsduh-substate-region-estimates-age-group.
- Lehigh Center for Clinical Research. The Importance of Seeking Mental Health Treatment. [Accessed on June 16, 2023.] https://www.lehighcenter.com/the-importance-of-seeking-mental-health-treatment/#:~:text=Good%20mental%20health%20can%20also,done%20in%20a%20timely%20manner
- U.S. Government Accountability Office (GAO). Treatment Behavioral Health Conditions in the United States. October 10, 2019. https://www.gao.gov/blog/2019/10/10/treating-behavioral-health-conditions-in-the-united-states#:~:text=Treatment%20for%20behavioral%20health%20conditions,improve%20their%20quality%20of%20life
- Walker, Elizabeth Reisinger, McGee, Robin E and Druss, Benjamin G. Mortality in Mental Disorders and Global Disease Burden Implications. JAMA Psychiatry. April 1, 2016. https://www.ncbi.nlm.nih.gov/pmc/articles/PMC4461039/
- National Council for Mental Wellbeing. Study Reveals Lack of Access as Root Cause for Mental Health Crisis in America. National Council for Mental Wellbeing. [Accessed on June 16, 2023.] https://www.thenationalcouncil.org/news/lack-of-access-root-cause-mental-health-crisis-in-america/
- University of Wisconsin Population Health Institute. Mental Health Providers: Provider-to-Population Ratio. 2022 CMS National Provider Identification Registry via County Health Rankings. 2023. Accessed on June 5, 2023 from https://www.countyhealthrankings.org/explore-health-rankings/tennessee/data-and-resources.
- —. About: Mental Health Providers. County Health Rankings. https://www.countyhealthrankings.org/explore-health-rankings/county-health-rankings-model/health-factors/clinical-care/access-to-care/mental-health-providers?year=2023
- Tennessee Department of Education. 2022 Annual Statistical Report – Tables 3-2, 4-1, 4-2, and 7. 2023. Accessed from https://www.tn.gov/education/districts/federal-programs-and-oversight/data/department-reports/2022-annual-statistical-report.html.
- U.S. Substance Abuse and Mental Health Services Administration (SAMHSA). 2021 NSDUH: Model-Based Estimated Totals For States (In Thousands). March 8, 2023. Accessed from https://www.samhsa.gov/data/report/2021-nsduh-estimated-totals-state.
- —. 2021 NSDUH: Guide to State Tables and Summary of Small Area Estimation Methodology. March 8, 2023. https://www.samhsa.gov/data/report/2021-nsduh-guide-state-tables-and-summary-sae-methodology
- Reinert, Maddy, Nguyen, Theresa and Fritze, Danielle. The State of Mental Health in America 2023. Mental Health America . October 2022. https://mhanational.org/sites/default/files/2023-State-of-Mental-Health-in-America-Report.pdf
- University of Massachusetts. Behavioral Health vs. Mental Health: Breaking Down the Differences. UMassGlobal Psychology. [Accessed on June 9, 2023.] https://www.umassglobal.edu/news-and-events/blog/comparing-behavioral-health-vs-mental-health
- U.S. Centers for Disease Control and Prevention (CDC). Behavior or Conduct Problems in Children. Children’s Mental Health. March 8, 2023. https://www.cdc.gov/childrensmentalhealth/behavior.html