Key Takeaways
- The Tennessee Department of Correction spent about $907 million on incarceration in FY 2023, and our counties spent an estimated $554 million in FY 2022 to operate local jails.
- Capital costs are counted separately. The state spends about $53 million each year on capital, and at least 40 counties have started or completed jail construction or expansion since 2009.
- Tennessee has special rules for how the state budgets for laws that affect incarceration — which were enacted to address prison overcrowding in the 1970s and 1980s.
- Cost projections for incarceration bills are highly sensitive to assumptions and don’t always quantify the full fiscal impact that policymakers must ultimately plan for.
- Inmate numbers and facility needs are the main drivers of incarceration costs. Some recent trends related to these factors include:
- After steady growth through the 2000s and 2010s, Tennessee’s incarcerated population dropped sharply during the COVID-19 pandemic but began to grow again in FY 2022.
- Crime trends since 2001 vary by offense type, but the overall rate of crimes cleared has stayed about the same.
- Sentences and time served have increased over the last two decades for many felonies in Tennessee — trends that may continue as the effects of new laws begin to play out.
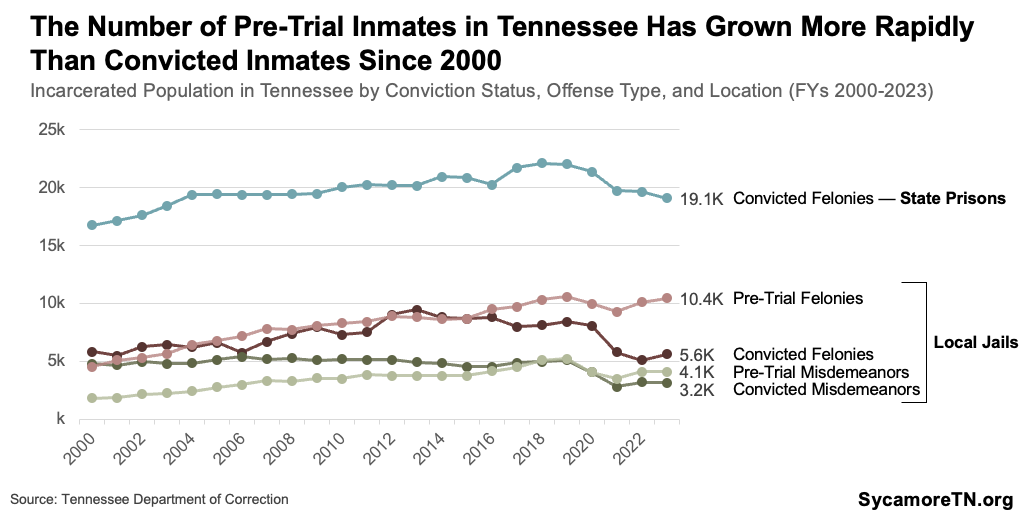
- Pre-trial inmates have become the largest share of the local jail population, increasing more rapidly than the number of convicted inmates.
- State and local facilities in Tennessee have recently struggled with staffing shortages — sometimes with consequences for staff and inmate safety.
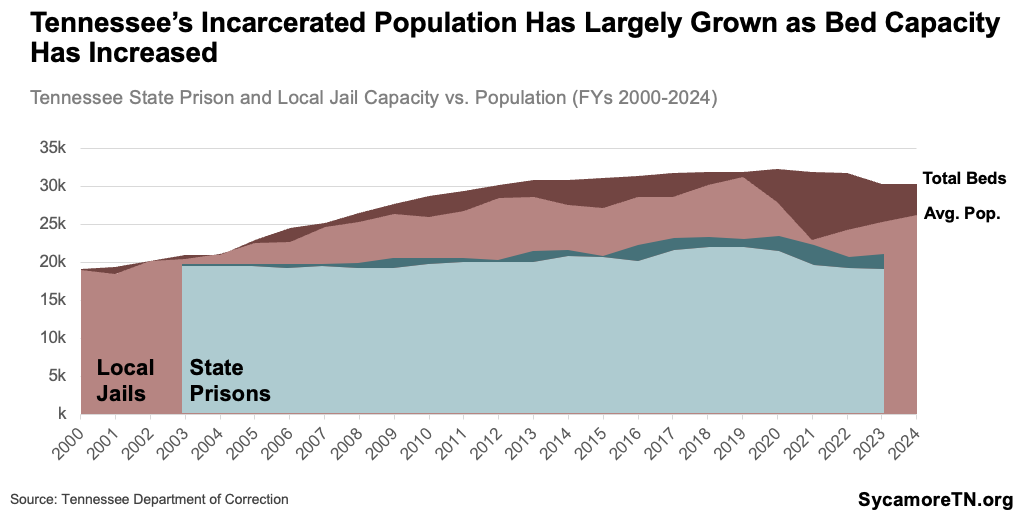
- Both state and local facilities have increased bed capacity over the last two decades, but many facilities are operating at or above capacity.
State and local officials are tasked with protecting public safety and adequately funding incarceration while maintaining a balanced budget. To provide context for related policy deliberations both today and in the future, this report updates our 2019 examination of Tennessee’s state and local incarceration budgets with information on recent trends and policy changes.
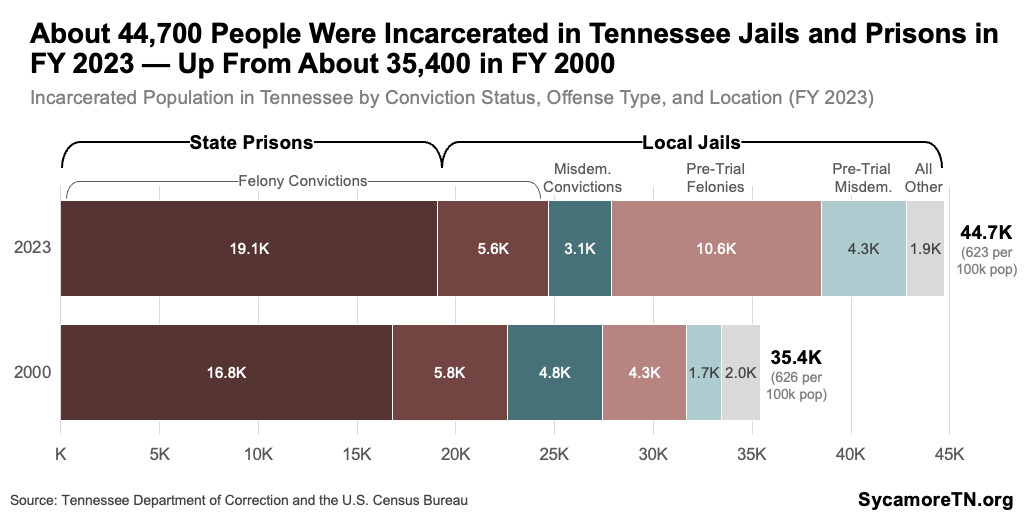
About 44,700 people were incarcerated in state prisons and local jails across Tennessee in FY 2023 (Figure 1). This report explores who pays to incarcerate them, at what cost, how those costs are accounted for in the state budget process, and the factors that drive them.
Figure 1
How Much Does Tennessee Spend on Incarceration?
In Tennessee, state and local governments share incarceration costs depending on the stage of the criminal process, offense type, and facility type. In 2023, about 43% of the state’s incarcerated population were in state prisons — all of them convicted felons. The remaining 57% were in local jails[1] — including some convicted felons, convicted misdemeanor offenders, and pre-trial detainees (i.e., people awaiting trial, conviction, or acquittal) (Figure 1). The state is responsible for all state prison costs and providing a per diem to local governments to house the 23% of convicted felons in local jails. Meanwhile, local governments pick up any remaining local jail costs. (1)
State Spending
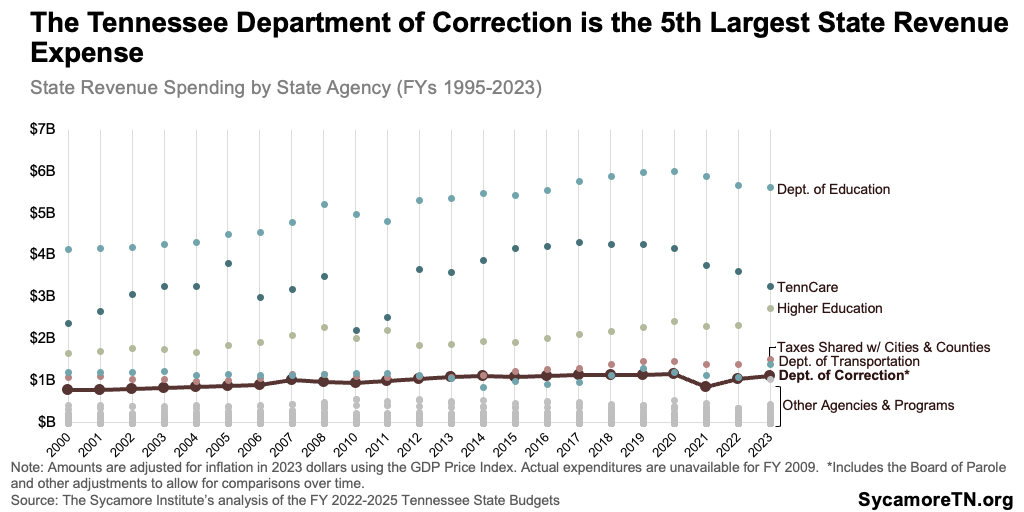
In FY 2023, the Tennessee Department of Correction (TDOC) spent about $907 million on incarceration — excluding capital costs. That’s about 79% of its budget, which is funded mainly by state revenues (Figure 2). (4) The department was the 5th largest state revenue expense that year behind K-12 education, TennCare, higher education, and taxes shared with cities and counties (Figure 3). The capital costs of maintaining, renovating, and constructing facilities are accounted for separately. Since FY 2000, the state budget has included about $1.4 billion after adjusting for inflation to maintain, expand, and build state prisons — an average of about $53 million annually. (4)
Figure 2
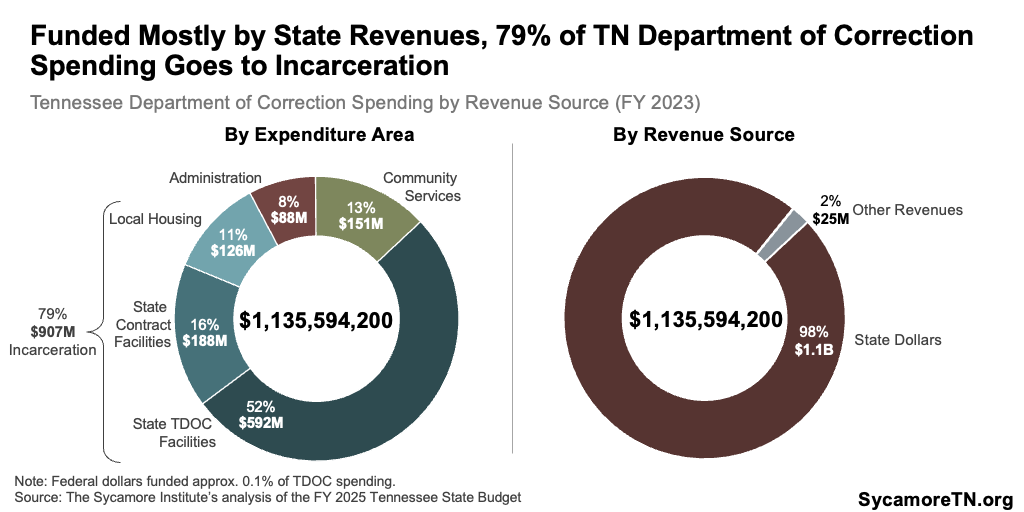
Figure 3
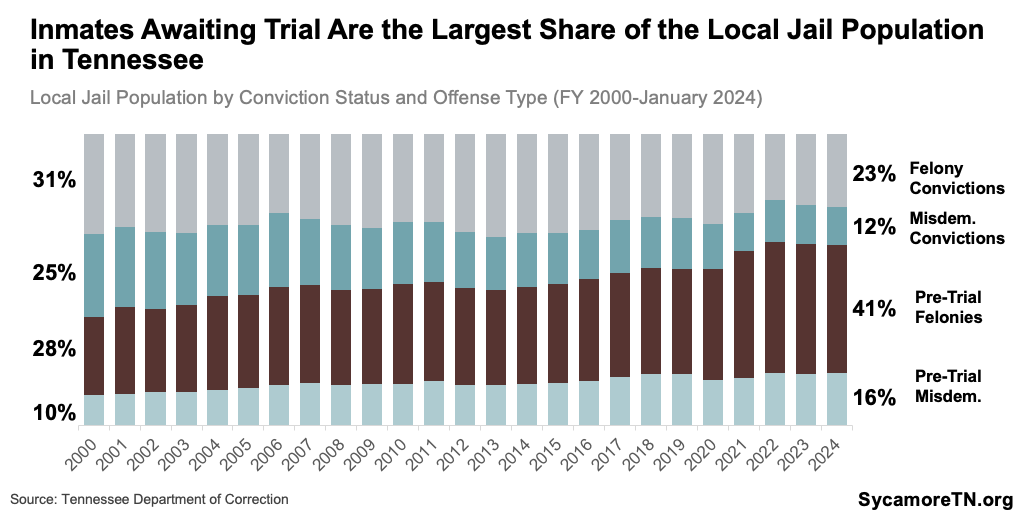
TDOC pays local governments a per diem to house convicted felons. Each year’s state funding bill caps that amount. Almost every county gets a max of $41 per prisoner per day in FY 2024. (2) Local jails providing access to evidence-based programming for improving outcomes can be certified by the Tennessee Corrections Institute and receive up to an additional $6 per inmate per day. Several counties contract with the state and negotiate separate rates — some lower and some higher than the state rate. (3) Local governments are only reimbursed for sentenced felons — not inmates awaiting trial, which are the largest share of the local jail population (Figure 4). (3)
Figure 4
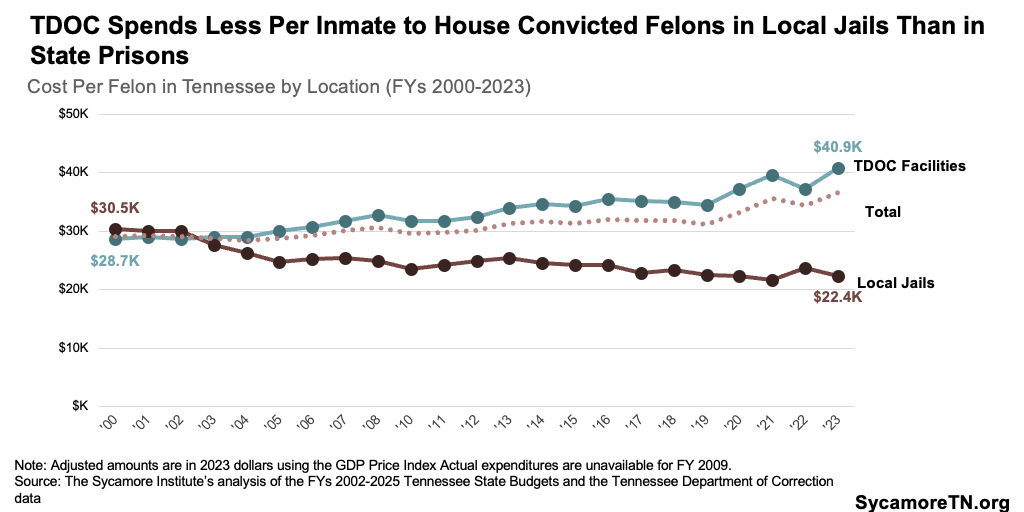
TDOC spends less to house convicted felons in local jails than state prisons, and those reimbursements may not cover local governments’ actual costs. In FY 2024, for example, the estimated average daily cost to house a prisoner in a TDOC facility is $106 (ranging from $69 to $252 per day, depending on the facility). (4) That is over twice the standard max per diem of $41 — a difference reflected in TDOC’s annual per-inmate spending on state prisons versus local jail reimbursement (Figure 5). Since FY 2000, TDOC’s annual per-inmate spending for local jails has decreased about 26% after adjusting for inflation — compared to an increase of 43% for those in state prisons. Counties have long said the state’s reimbursements do not cover their total costs. (5)
Figure 5
Local Spending
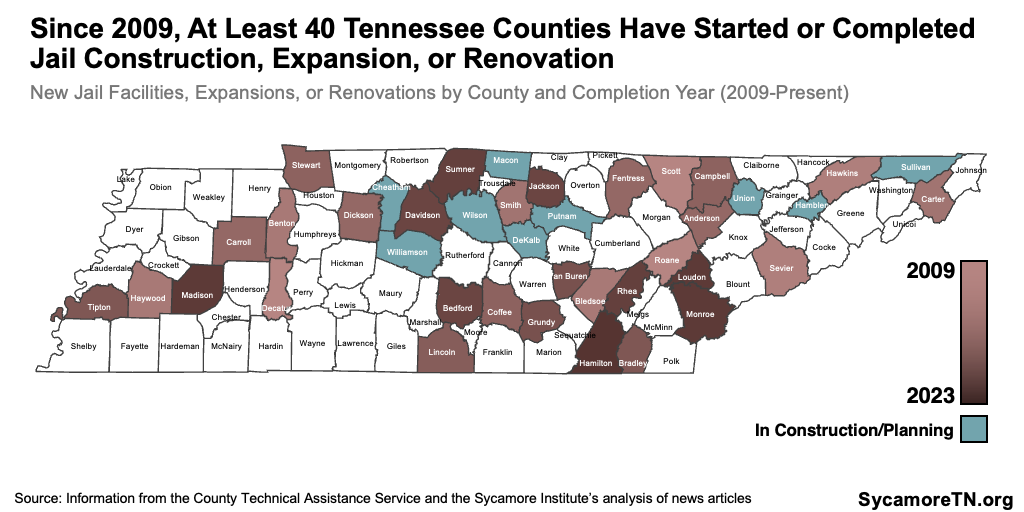
Tennessee counties spent an estimated $554 million in FY 2022 to operate local jails — including reimbursements from the state but excluding capital costs (Figure 6).[2] (6) (7) (8) (9) (10) This amounted to an average of about 4% of each county’s total expenditures (Figure 7). Not included in these costs are capital spending to maintain, expand, and build local jails — which are often accounted for in capital and debt service line items that are not broken down into this level of detail. However, since 2009, at least 40 counties have started or completed major jail construction, expansion, or renovation projects (Figure 8).(11) (12) (13) (14) (15) (16) (17) (18) (19) (20) Montgomery and Shelby Counties have also recently raised the need for major construction. (21) (22)
Figure 6
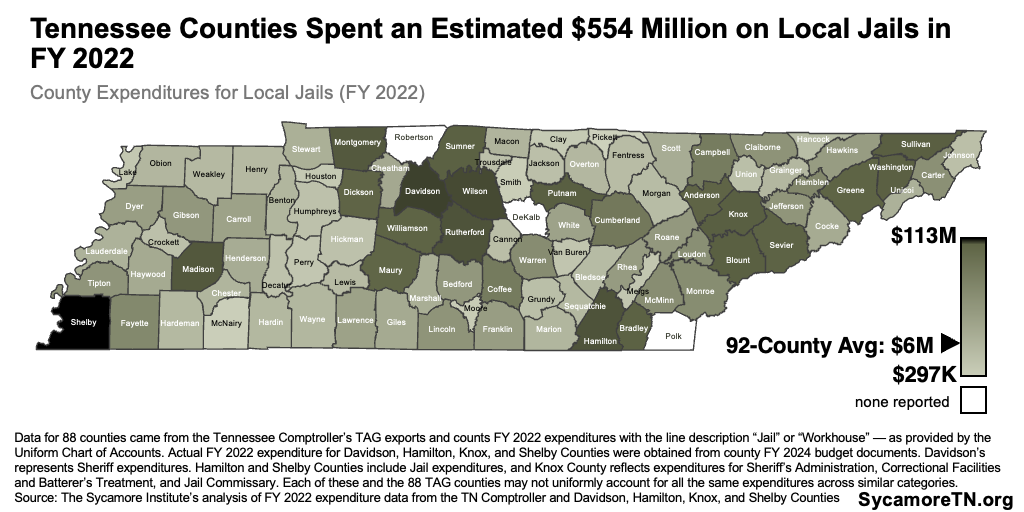
Figure 7
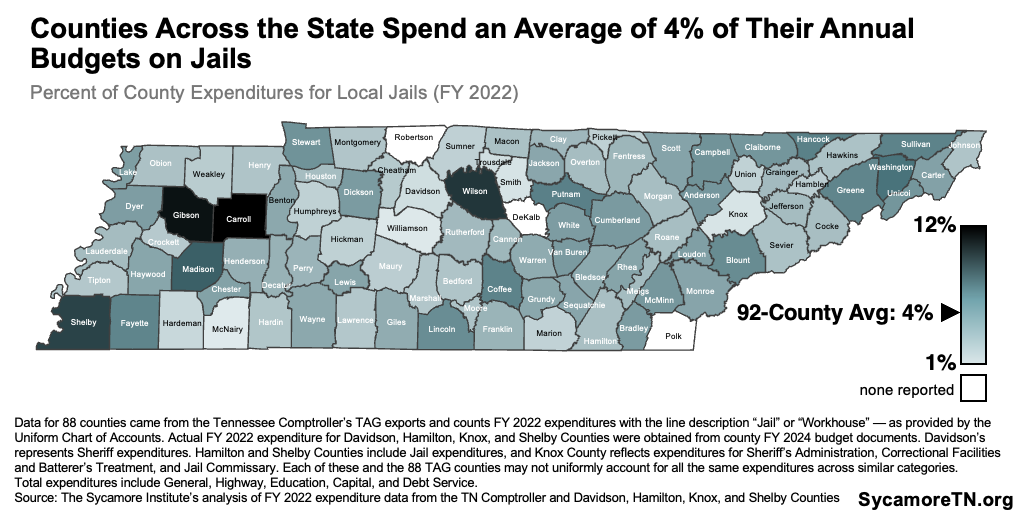
Figure 8
In addition to state reimbursements, local governments use many tools to fund their jails — including general fund dollars and fees and other levies. (27) (24) (25) (26) (27) For example, counties can charge inmates a daily housing fee and fees for booking, bail bonds, transportation, medical services, and educational testing — fees that can come with trade-offs for both counties and offenders. Counties may also levy special litigation taxes to pay for jail construction. Most recently, some in Shelby County have suggested increasing its local option sales tax to pay for a new jail. (22)
How is Incarceration Funding Appropriated?
Tennessee has special rules for how the state budgets for laws that affect incarceration. For context, Tennessee must have a balanced budget, and under the state constitution, any new law without its first-year cost funded in the budget becomes void. (28) Under a separate law, the budget must pre-fund bills expected to raise incarceration rates at the highest-cost year expected over a 3-year period. Those costs are limited to operating costs — not capital costs (i.e., facility upgrades or a new state prison). (29) (30)
Before 2022, these rules were stricter and dedicated funds to pay for capital costs. Before the law changed in 2021 and again in 2022, the budget had to pre-fund any additional expenses equal to the highest-cost year expected over a 10-year period. While those cost projections were limited to operating needs, TDOC could only use the money to pay for capital costs — providing a dedicated source of revenue for any needed capacity expansions. Under current requirements, TDOC can only use the required dollars for operating costs. (31) (32)
These rules were originally put in place to help with budgeting the funds necessary to prevent prison overcrowding — an issue that afflicted the state throughout the 1970s and 1980s. Several sentencing laws were enacted in the late 1970s and early 1980s that resulted in increased incarceration, but formal projections of their long-term impact did not accompany the legislation. Without the funding to accommodate this expansion of the prison population and limited flexibility to manage inmate releases, Tennessee’s prisons became under-resourced and overcrowded. This combination led to federal lawsuits, federal supervision, and riots throughout the system in 1985. The General Assembly called a special session in the same year and passed reforms to address the issues — including the new rules outlined above on budgeting for incarceration costs. (5) (33) (34) (35) (36) (37) (38) (39)
The General Assembly Fiscal Review Committee’s staff determines fiscal note estimates that forecast costs and required appropriations. The law requires Fiscal Review staff to issue cost estimates for every piece of introduced legislation that could impact revenue or expenditures. (40) All fiscal note estimates affecting incarceration are built on data and assumptions about:
- Current admissions, average sentence length, and time served for relevant offenses.
- The law’s effects on the amount of time served in state prisons and local jails — both for current and future inmates.
- When any effects might begin.
- How state and local officials may use any discretion afforded under a law (e.g., sentencing).
- How new incarcerations are distributed across state prisons and local jails.
- The daily cost of housing an inmate in a state prison or local jail.
- How many current and future offenders a law might apply to, which may require assumptions about recidivism rates and many of the factors above.
The funding requirements for legislation that affects incarceration can be highly sensitive to these assumptions and the applicable time window. In 2022, for example, Fiscal Review and TDOC estimated significantly different costs for the Truth in Sentencing proposal because they used different data definitions and assumptions. For one iteration of the legislation, TDOC estimated an $845 million 10-year impact that would have required a $96 million appropriation in that budget cycle. Fiscal Review’s 10-year estimate was $256 million with a required $41 million first-year appropriation. (41) The final fiscal note projected the bill would increase state spending by $25.4 million in its highest-cost year over the 10-year window. The highest-cost year of a 3-year window would have been less than half that at $12.0 million. (42)
Although these factors can affect the proposal’s viability in the legislative process, fiscal notes may not quantify the total fiscal impact that policymakers must ultimately plan for. For example:
- Fiscal notes may not capture the long-term effects since new costs — particularly those associated with offenses with lengthy sentences — often won’t materialize for many years.
- Fiscal notes don’t always include capital cost estimates associated with the need for additional bed capacity and facilities. (42)
- Fiscal Review staff may be unable to estimate a reliable cost because there are too many unknowns. For example, a recent fiscal note for legislation ending certain sentencing reduction credits concluded: “There will be a significant increase in state expenditures to accommodate longer incarceration times and parolees being supervised for longer periods of times; however the extent and timing of any fiscal impact to state expenditures associated with a change in sentence reduction credits results from the proposed legislation cannot be quantified.” (43)
- A recent fiscal note for legislation proposing a constitutional change to remove the right to bail for certain offenses focused on the procedural costs of amending the constitution and not the substantive impact of the proposal. (44)
What Drives Incarceration Costs?
Two main factors drive the costs of incarceration — the number of inmates housed and the safe operation of facilities and programs for those inmates. Many variables influence each of these drivers. The following sections provide additional data and context on recent trends in Tennessee for some of the factors listed below over the last two decades.
Inmates – The number of inmates is influenced by:
- Crimes committed and the nature of those crimes, which influence many of the other factors listed below.
- Arrests (i.e., clearance rates) and convictions made.
- How convicted individuals are sentenced, including required statutory penalties.
- How much each inmate serves of their sentence as determined by an inmate’s behavior, statutory requirements, and parole board practices.
- Recidivism, meaning the rate at which former inmates reoffend.
- Rates of pre-trial detention, which things like bail practices and court backlogs can influence.
Operations – Operations costs are determined by:
- Facility needs, including available and existing bed capacity, facility age, and security requirements.
- Staffing needs and costs.
- Where inmates reside.
- Health services, which the U.S. Constitution requires.
- Any additional rehabilitative or educational services — often aimed at reducing recidivism.
- The costs associated with meeting any statutory or accreditation requirements.(45)
Number of Inmates
After steady growth through the 2000s and 2010s, Tennessee’s incarcerated population dropped sharply during the COVID-19 pandemic but began to grow again in FY 2022 (Figure 9). Between FYs 2000 and 2019, the number of inmates in state prisons and local jails climbed by 17,500 people, or 25%. The rate grew by about 153 inmates per 100,000 Tennesseans, or 24%. To contain the spread of COVID-19, incarcerated populations fell during 2020 and 2021. Until this drop, both jails and prisons across the state were at close to capacity (Figure 10). (50) (1) The number of inmates began to grow again in FY 2022. As of FY 2023, about 8,700 more people were incarcerated than in FY 2000 — still about 8,800 below pre-pandemic levels. The FY 2023 rate of incarceration was 623 inmates per 100,000 Tennesseans — about the same as the FY 2000 rate of 626 and lower than FY 2019 rate of 779. (1) (2) (3)
Figure 9
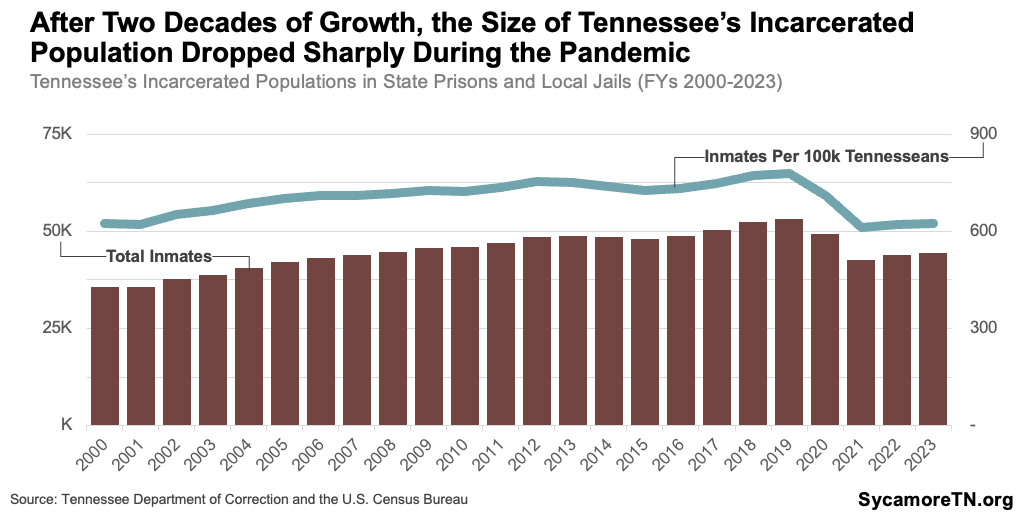
Figure 10
Crimes and Clearance Rates
From 2001 to 2022, property crime rates in Tennessee fell, societal crime rose, and violent crime rates were about the same — but crime clearance rates stayed about the same (Figure 11). Changes in crime rates varied by offense type over the last two decades — as did the clearance rates, which measure the number of crimes with arrests. Across crime types, property crimes were most common, followed by drug and other societal crimes, and then violent crimes. (46)
- Property Crime: Tennessee’s property crime rate in 2022 was about 36.7 offenses per 1,000 Tennesseans — 44% lower than in 2001. Property crime rates declined significantly over the last two decades, reaching their lowest point in 2021. Most of these crimes don’t get cleared, so the related rate of arrests only fell slightly over this period.
- Societal Crime: Societal crime rates for things like drug offenses increased most this period The societal crime rate in 2022 was 14.3 offenses per 1,000 people — 66% higher than in 2021. The number and rate of these crimes peaked in 2018. While fewer of these cases were cleared in recent years, the rate of societal crimes cleared per 1,000 people was higher than two decades prior.
- Violent Crime: Tennessee’s violent crime rate in 2022 was about 6.2 offenses per 1,000 Tennesseans, which was about the same as it was in 2001. Over those two decades, there were dips and jumps — 2013 was the lowest rate year, and 2021 was the highest. In 2022, law enforcement cleared fewer violent crimes than in any other year since 2001.
Figure 11
Sentences and Time Served
Sentences and time served have gotten longer over the last two decades for many felonies in Tennessee. TDOC stopped reporting on sentences for admissions and time served in FY 2019, but trends through FY 2018 for the most common primary offenses among inmates include: (47)
- Non-Cocaine Drug Offenses accounted for about 16% of convicted felons in FY 2022. Between FYs 2003 and 2018, the average sentence of those entering incarceration (i.e., admissions) increased by 63%, and the average time served of those released grew by 58%.
- Murder accounted for about 16% of inmates. Both average sentence of admissions and time served for releases increased between FYs 2003 and 2018, but they may not paint an accurate picture of sentence length because they exclude those sentenced to life or life without parole.
- Aggravated Assault was the primary offense for about 14% of inmates. Between FYs 2003 and 2018, the average sentence of new admissions declined by 7%, and the average time served of those released fell by 9%.
- Forcible Sex Offenses accounted for about 11% of inmates. Between FYs 2003 and 2018, the average sentence of new admissions increased by 18%, and the average time served of those released rose by 32%.
- Burglary accounted for about 8% of inmates. Between FYs 2003 and 2018, the average sentence of new admissions increased by 12%, while the average time served of those released declined by 15%.
- Aggravated Robbery accounted for about 7% of inmates. Between FYs 2003 and 2018, the average sentence of new admissions grew by 8%, and the average time served of those released increased by 19%.
- Theft/Larceny accounted for about 5% of inmates. Between FYs 2003 and 2018, the average sentence of new admissions increased by 26%, and the average time served of those released rose by 24%.
- Cocaine Offenses accounted for about 4% of inmates. Between FYs 2003 and 2018, the average sentence of new admissions increased by 48%, and the average time served of those released increased by 45%.
These trends will likely continue for many offense types as the effects of new laws begin to play out. For example, 2022’s Truth in Sentencing law requires people convicted of eight specific offenses to serve 100% of their sentence and limits the use of sentence reduction credits for about 20 others. The average time served for the affected offenses ranged from 1.2 to 15 years. This means that the full impact of the new legislation on time served and incarceration costs won’t fully materialize for many years.
Pre-Trial Detainees
The number of pre-trial inmates has grown more rapidly than the number of convicted inmates (Figures 12 and 13). From 2000 to 2023, the pre-trial inmate population rose by 129%— while the convicted inmate population grew only 2% bigger. Before COVID-related declines, the pre-trial population was about 149% larger, while the convicted population was up about 30%. (47)
The causes and consequences of pre-trial detentions — including fiscal ones — are multifaceted, but good data are not available to fully understand them in Tennessee. For example, the extent to which bail practices drive pre-trial detention is unclear due to a lack of publicly available data. Consequences may also include longer sentences, higher rates of recidivism, and long-term economic success — even after controlling for factors that could influence these outcomes. (48) (49) (50) (51) Because the state does not reimburse for housing felony pre-trial detainees, local governments may be covering costs for sentences served in full or in part before conviction that the state would otherwise pay.
Figure 12
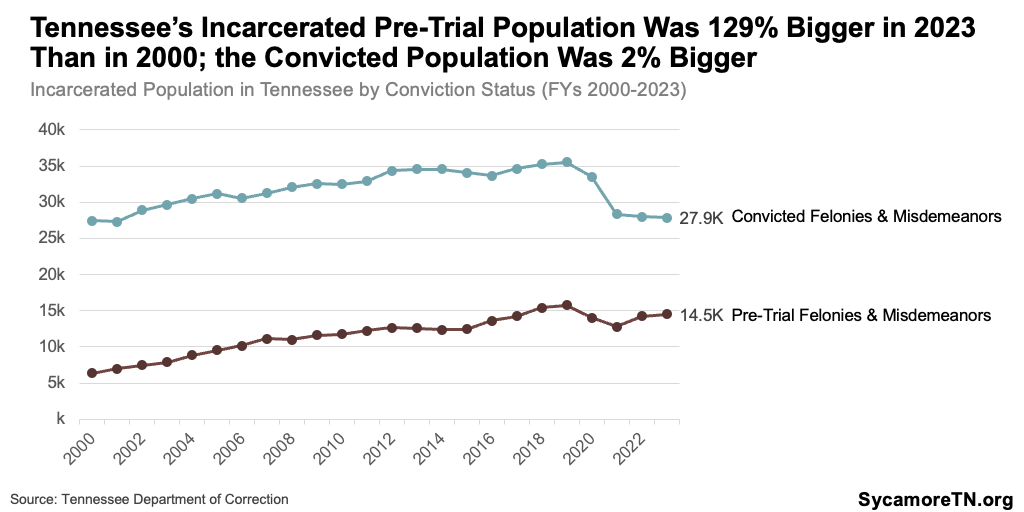
Figure 13
Facility Staffing and Security
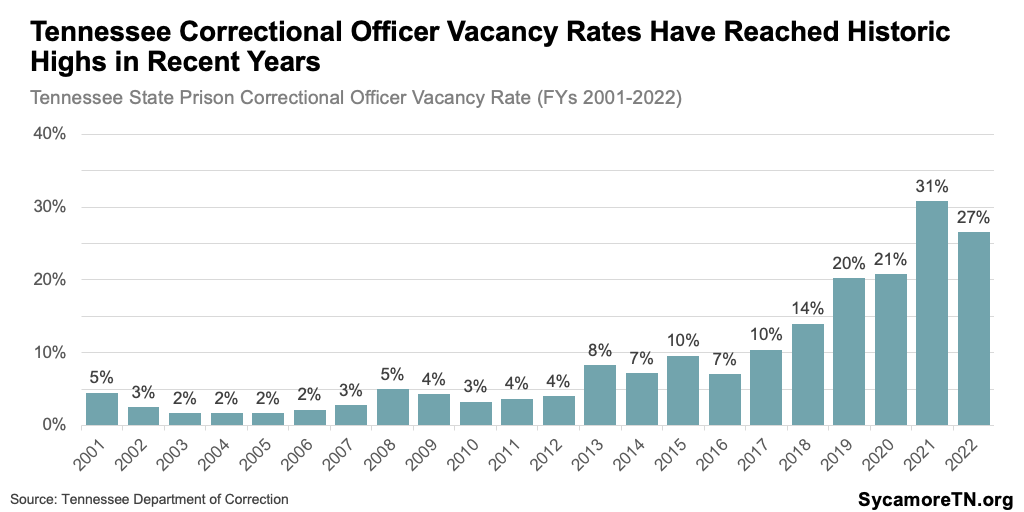
State and local facilities in Tennessee have struggled with staffing shortages in recent years — sometimes with safety consequences. State correctional officer vacancy rates have surged recently due to the COVID-19 pandemic and related labor market shifts (Figure 14). A December 2023 state audit of TDOC reported individual facility vacancy rates as high as 61%. It also found that state prisons continue to face the “ongoing and deeply rooted challenge of attrition within their ranks,” which has caused “serious safety concerns” and limited capacity to provide rehabilitative services. (53) Local jails across the state have also reportedly faced similar issues. (50) (51) (52) (53) (54) (55) (56) (57) (58) (59)
Figure 14
Bed Capacity
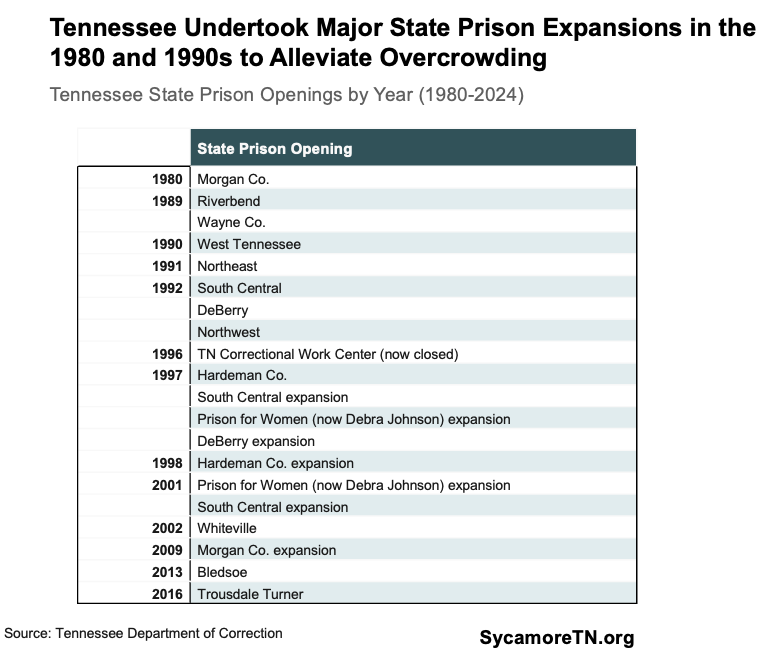
The state has increased prison capacity by about 3,700 beds since 2001 — a 2% decline of beds per 1,000 Tennesseans (Figure 15) — and several prisons are operating at capacity (Figure 16). Of Tennessee’s 16 state prisons, three were operating at or above capacity, and another four were at 90% or above. Most of Tennessee’s major state prison expansions took place in the 1980s and 1990s to alleviate the overcrowding issues of the 1970s and 1980s (Table 1).
Figure 15
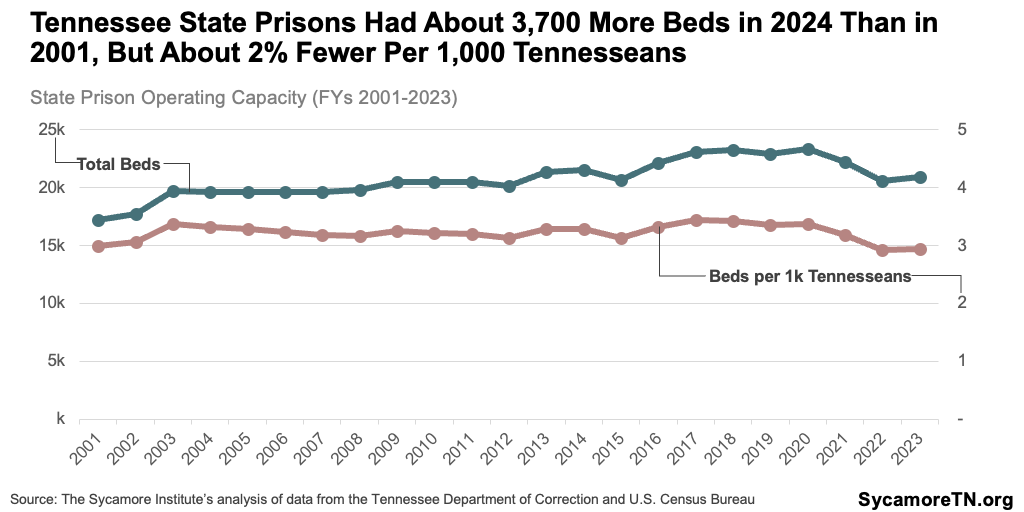
Figure 16
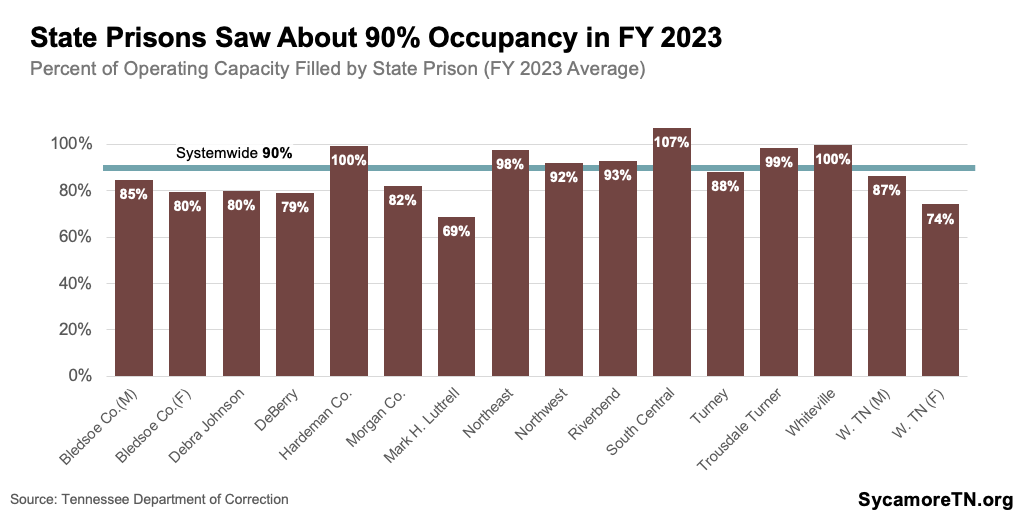
Table 1
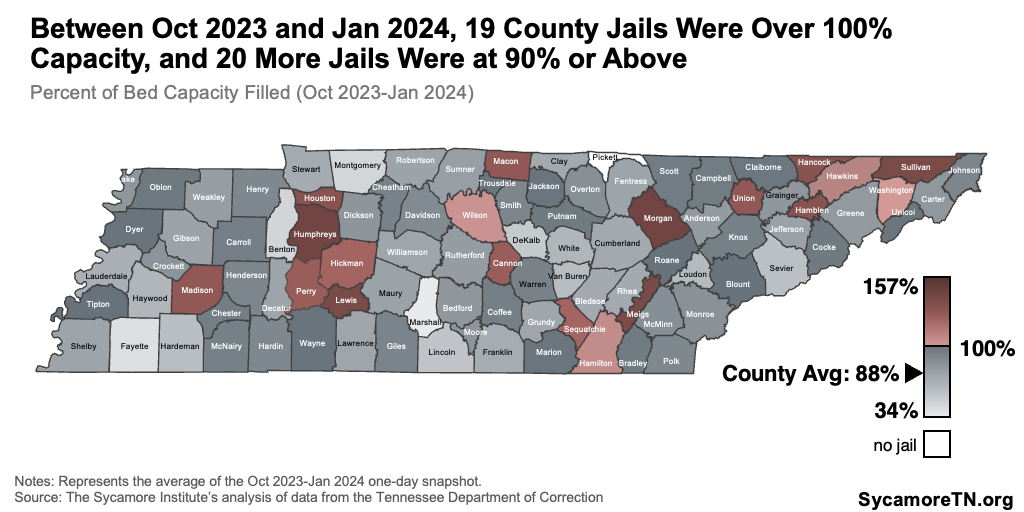
Since 2001, 79 counties have increased the number of jail beds available per 1,000 residents (Figure 17), but many counties’ jails are operating at or above capacity (Figure 18). Between October 2023 and January 2024, jails in 19 counties were over 100% capacity, and another 20 were at 90% or above. Across the state, the number of jail beds increased by 0.9 per 1,000 Tennesseans — a 24% increase, and between October 2023 and January 2024, about 82% of jail beds across the state were filled. (48) (60) (65)
Figure 17
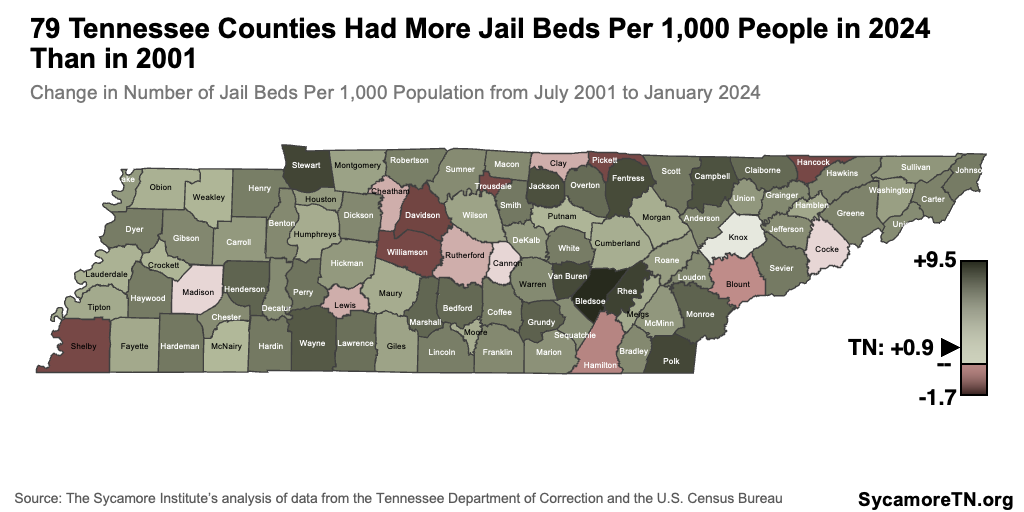
Figure 18
Parting Words
State policymakers face a complex set of considerations when weighing policies that could increase the state’s incarcerated population. They must consider their duty to protect public safety, to their constitutional responsibilities, and to create a safe environment for inmates. This report provides context for recent and proposed changes that must balance these considerations.
[1] Throughout, we use the term prison to refer to state facilities, and jails for local jails, correctional and detention facilities, and workhouses.
[2] Data for 88 counties came from the Tennessee Comptroller’s TAG exports and counts FY 2022 expenditures with the line description “Jail” or “Workhouse” — as provided by the Uniform Chart of Accounts. Nothing was reported in these categories for DeKalb, Polk, and Robertson Counties. Actual FY 2022 expenditure for Davidson, Hamilton, Knox, and Shelby Counties were obtained from county FY 2024 budget documents. Davidson’s represents relevant program lines from Sheriff expenditures. Hamilton include Jail expenditures, Shelby includes Jail and Corrections expenditures, and Knox County reflects expenditures for Sheriff’s Administration, Correctional Facilities and Batterer’s Treatment, and Jail Commissary. Each of these and the 88 TAG counties may not uniformly account for all the same expenditures across similar categories.
References
Click to Open/Close
References
- State of Tennessee. Tennessee State Budgets for FY 1997 through FY 2019. [Online] Accessed from https://www.tn.gov/finance/fa/fa-budget-information/fa-budget-archive.html.
- —. Public Chapter No. 418 (2023). [Online] 2023. https://publications.tnsosfiles.com/acts/113/pub/pc0418.pdf.
- Tennessee Advisory Commission on Intergovernmental Relations. Housing Tennessee’s Convicted Felons: Improving Outcomes while Balancing State and County Needs. [Online] 2017. [Cited: January 18, 2018.] https://www.tn.gov/content/dam/tn/tacir/documents/2017HousingTNConvictedFelons.pdf.
- State of Tennessee. FY 2025 Tennessee State Budget. [Online] 2024. https://www.tn.gov/finance/fa/fa-budget-information/fa-budget-archive/fa-budget-publication-2018-2019.html.
- Tennessee Advisory Commission on Intergovernmental Relations (TACIR). Housing Tennessee’s Convicted Felons: Improving Outcomes while Balancing State and County Needs. [Online] August 2017. https://www.tn.gov/content/dam/tn/tacir/documents/2017HousingTNConvictedFelons.pdf.
- Tennessee Comptroller of the Treasury. TAG Exports: FY 2022 Expenditures. Downloaded from https://comptroller.tn.gov/office-functions/la/e-services/tag-tableau/tag-exports.html. [Online] [Cited: March 8, 2024.]
- Metro Nashville-Davidson County. FY 2023-2024 Operating Budget Book – Program Detail for Sheriff. [Online] July 2023. https://www.nashville.gov/sites/default/files/2023-09/FY24_30SheriffPrograms.pdf?ct=1695844975.
- Knox County, Tennessee. Adopted FY 2024 Budget. [Online] 2023. https://www.knoxcounty.org/finance/pdfs/2023_2024_budget/FY24_Adopted_Budget.pdf.
- Hamilton County, Tennessee. Budget for FY Ending June 30, 2024 . [Online] 2023. https://www.hamiltontn.gov/PDF/FY%202024%20Proposed%20Budget.pdf.
- Shelby County, Tennessee. Adopted Budget: FY 2024. https://shelbycountytn.gov/ArchiveCenter/ViewFile/Item/13514. [Online] 2023.
- Information provided. Information compiled by County Technical Assistance Services and provided to the Sycamore Institute by the County Services Administration. February February 2024.
- Davidson County Sheriff’s Office. Downtown Detention Center (DDC). [Online] https://sheriff.nashville.gov/downtown-detention-center/.
- Justice, Brian. Jail Expansion To Be Done By October . Franklin County Herald Chronicle. [Online] May 30, 2020. https://www.heraldchronicle.com/news/local/jail-expansion-to-be-done-by-october/article_69aaa8cc-9f9f-11ea-bf35-0f60cbb90f59.html.
- Lee, Tena. Staffing Shortages Delay Opening of Jail Addition . Hendersonville Standard. [Online] August 14, 2021. https://mainstreetmediatn.com/articles/hendersonvillestandard/staffing-shortages-delay-opening-of-jail-addition/.
- Yesterday in Dayton. Rhea County Jail History. [Online] August 6, 2021. https://yesterdayindayton.net/rhea-county-jail-history/.
- Floyd, David. Silverdale Jail Construction Project Adds Beds and Offices, Upgrades Security and More. Chattanooga Times Free Press. [Online] February 4, 2023. https://www.timesfreepress.com/news/2023/feb/04/silverdale-jail-construction-tfp/.
- Salazar, Deven. Making Progress: Justice Center on Pace for May 2024 Opening . Citizen Tribune. [Online] May 24, 2023. https://www.citizentribune.com/news/local/making-progress-justice-center-on-pace-for-may-2024-opening/article_b9b59852-fa5c-11ed-8f99-bbd36710d68d.html.
- Vásquez Russell, Melanie . Union County Jail Overcrowding Contributed to 5 Inmates’ Escape, Officials Say. WATE Channel 6. [Online] September 19, 2023. https://www.wate.com/news/union-county-news/union-county-jail-overcrowding-contributed-to-5-inmates-escape-officials-say/.
- Page, Dwayne. Commission Gets Sobering Report from Architect and Contractor on Jail/Judicial Center Construction Costs. WJLE. [Online] February 28, 2024. https://www.wjle.com/news/commission-gets-sobering-report-from-architect-and-contractor-on-jail-judicial-center-construction-costs-view-video-here/.
- Keafer, Tori. County Officially Kickstarts $281 Million JJJ Project . Williamson Herald. [Online] September 14, 2021. https://www.williamsonherald.com/news/local_news/county-officially-kickstarts-281-million-jjj-project/article_a9e69dec-150a-11ec-be91-5bcf47ccb6d3.html.
- Clark, Alexis. Montgomery County Sheriff’s Office is in Need of Jail Renovations, Patrol Cars and More Employees. Leaf Chronicle. [Online] April 25, 2022. https://www.theleafchronicle.com/story/news/local/clarksville/2022/04/26/montgomery-county-sheriffs-office-need-jail-renovations-patrol-cars/7387986001/.
- Hardiman, Samuel. Hike in Sales Tax Could Pay for New Shelby County Jail . The Daily Memphian. [Online] March 1, 2024. https://dailymemphian.com/article/42192/hike-in-sales-tax-could-pay-for-new-shelby-county-jail.
- County Technical Assistance Services (CTAS). County Litigation Taxes (CTAS-1641). E-LI: Electronic Library. [Online] https://www.ctas.tennessee.edu/node/1641.
- County Technical Assistance Service (CTAS). Duty to Build and Maintain Jail (CTAS-1334). E-LI: Electronic Library. [Online] https://www.ctas.tennessee.edu/eli/duty-build-and-maintain-jail.
- —. Jail Fees – Workhouses (CTAS-1465). E-LI: Electronic Library. [Online] https://www.ctas.tennessee.edu/eli/jail-fees-workhouses.
- County Technical Assistance Center (CTAS). Jailer’s Fees (CTAS-1332). [Online] https://www.ctas.tennessee.edu/eli/jailers-fees.
- County Technical Assistance Service (CTAS). Jail Fees (CTAS-1426). E-LI: Electronic Library. [Online] https://www.ctas.tennessee.edu/eli/jail-fees.
- State of Tennessee. State Constitution Article II Section 24. [Online] http://www.capitol.tn.gov/about/docs/TN-Constitution.pdf.
- —. Public Chapter No. 412 (2021). [Online] May 12, 2021. https://publications.tnsosfiles.com/acts/112/pub/pc0412.pdf.
- —. Public Chapter No. 1007 (2022). [Online] April 21, 2022. https://publications.tnsosfiles.com/acts/112/pub/pc1007.pdf.
- —. Tennessee Code Annotated Sec. 9-4-210. [Online] 2020.
- —. pB-260 of the FY 2023 Tennessee State Budget Document. [Online] 2022. https://www.tn.gov/content/dam/tn/finance/budget/documents/2023BudgetDocumentVol1.pdf.
- Tennessee Department of Correction (TDOC). TDOC Historical Timeline. [Online] https://www.tn.gov/content/dam/tn/correction/documents/HistoricalTimeline.pdf.
- The New York Times. Tennessee Governor Signs 6 Bills Aimed at Reforming State Prisons. [Online] December 12, 1985. https://www.nytimes.com/1985/12/12/us/tennessee-governor-signs-6-bills-aimed-at-reforming-state-prisons.html.
- Tennessee State Library and Archives. Grubbs Lawsuit Records: Tennessee Department of Correction (1960-1994). [Online] December 21, 2004. /https://sos-tn-gov-files.s3.amazonaws.com/forms/DEPARTMENT_OF_CORRECTION_GRUBBS_LAWSUIT_RECORDS_1960-1994.pdf.
- United Press International. Inmate Killed After Tennessee Prison Riots End . Los Angeles Times. [Online] July 3, 1985. https://www.latimes.com/archives/la-xpm-1985-07-03-mn-10225-story.html.
- —. Authorities Today Quelled a 14-Hour Riot by 450 Convicts. [Online] July 2, 1985. https://www.upi.com/Archives/1985/07/02/Authorities-today-quelled-a-14-hour-riot-by-450-convicts/1547489124800/.
- Tennessee Secretary of State. 2005-2006 Tennessee Blue Book: Corrections. [Online] Accessed from https://sos.tn.gov/publications/services/2005-2006-tennessee-blue-book.
- Tennessee Department of Correction (TDOC). FY 1985-86 Annual Report. [Online] April 1987. Accessed from https://ojp.gov/pdffiles1/Digitization/110197NCJRS.pdf.
- State of Tennessee. Tenn. Code Ann. § 3-2-107. [Online] 2024. Accessed via Lexis.
- Tennessee General Assembly. Testimony and Materials Presented to the House Appropriations Subcommittee. [Online] April 11, 2022. Video available from https://wapp.capitol.tn.gov/apps/videowrapper/default.aspx?CommID=801000.
- Fiscal Review Committee Staff. Fiscal Memorandum: SB 2248-HB 2656. [Online] April 20, 2022. https://www.capitol.tn.gov/Bills/112/Fiscal/FM2871.pdf.
- —. Fiscal Note: SB 2044-HB 2188. Tennessee General Assembly. [Online] February 10, 2024. https://www.capitol.tn.gov/Bills/113/Fiscal/SB2044.pdf.
- —. Fiscal Note: HJR 859. Tennessee General Assembly. [Online] February 7, 2024. https://www.capitol.tn.gov/Bills/113/Fiscal/HJR0859.pdf.
- County Technical Assistance Service (CTAS). Jail Policies and Procedures (CTAS-2187). E-LI: Electronic Library. [Online] https://www.ctas.tennessee.edu/eli/jail-policies-and-procedures.
- Tennessee Bureau of Investigation (TBI). TIBRS Crime Data. Crime Insight. [Online] https://crimeinsight.tbi.tn.gov/public/Browse/browsetables.aspx.
- Tennessee Department of Correction (TDOC). Annual Reports and Annual Statistical Abstracts. [Online] https://www.tn.gov/correction/statistics/annual-reports.html.
- Lowenkamp, Christopher T., VanNostrand, Marie and Holsinger, Alexander. The Hidden Costs of Pretrial Detentio. National Institute of Corrections. [Online] November 2013. https://nicic.gov/resources/nic-library/all-library-items/hidden-costs-pretrial-detention.
- —. Investigating the Impact of Pretrial Detention on Sentencing Outcomes. National Institute of Corrections. [Online] November 2013. https://nicic.gov/resources/nic-library/all-library-items/investigating-impact-pretrial-detention-sentencing-outcomes.
- Dobbie, Will and Yang, Crystal S. The Economic Costs of Pretrial Detention. Cato Research Briefs. [Online] January 19, 2022. https://www.cato.org/sites/cato.org/files/2022-01/RB283.pdf.
- Dobbie, Will, Goldin, Jacob and Yang, Crystal S. The Effects of Pretrial Detention on Conviction, Future Crime, and Employment. The American Economic Review. [Online] February 2018. https://www.jstor.org/stable/26527904.
- Tennessee Department of Correction (TDOC). Jail Summary Reports. [Online] https://www.tn.gov/correction/statistics/jail-summary-reports.html.
- Tennessee Comptroller of the Treasury. Performance Audit Report: Department of Correction. Division of State Audit. [Online] December 2023. https://comptroller.tn.gov/content/dam/cot/sa/advanced-search/2023/pa23025.pdf.
- Gessner, Tori. Sumner County Sheriff’s Office Faces Critical Jail Staff Shortage. Yahoo News. [Online] October 20, 2023. https://news.yahoo.com/sumner-county-sheriff-office-faces-215341066.html.
- Webster, Dominic. Knox County Sheriff’s Office Facing Major Staff Shortage. WATE – Channel 6. [Online] November 16, 2022. https://www.wate.com/news/knox-county-news/knox-county-sheriffs-office-facing-major-staff-shortage/.
- WSMV – Channel 4. Staffing Shortage Impact Jail Operations. [Online] August 31, 2023. https://www.wsmv.com/video/2023/09/01/staffing-shortage-impact-jail-operations/.
- Bobo, Jeff. Hawkins County Jail in “Crisis Mode” Due to Staff Shortage. The Rogersville Review. [Online] April 20, 2022. https://www.therogersvillereview.com/video_8e8078ff-7056-5812-9df4-804d6ad02ccb.html.
- Hawkins, Sydney. Shelby County Jails Significantly Understaffed, Actively Hiring Jailers . Action News 5. [Online] November 24, 2023. https://www.actionnews5.com/2023/11/24/shelby-county-jails-significantly-understaffed-actively-hiring-jailers/.
- Pirsos, John. Knox County Sheriff Hoping to Raise Salaries, Prevent Staffing Shortages . WVLT – Channel 8. [Online] April 3, 2023. https://www.wvlt.tv/2023/04/03/knox-county-sheriff-hoping-raise-salaries-prevent-staffing-shortages/.
- Hyde, Adria. Hiring Shortage More Complicated for Sheriff’s Office, Police Department . Clarksville Now. [Online] June 10, 2022. https://clarksvillenow.com/local/hiring-shortage-more-complicated-for-sheriffs-office-police-department/.
- WSMV – Channel 4. Sheriff Warns of Extreme Staff Shortage in Stewart County . [Online] March 20, 2023. https://www.wsmv.com/video/2023/03/21/sheriff-warns-extreme-staff-shortage-stewart-county/.
- Scurry, Jayonna. Sullivan Co. Sheriff and Commissioners Meet, Discuss Potential Employee Pay Raise. WJHL – Channel 11. [Online] July 8, 2023. https://www.wjhl.com/news/local/sullivan-co-sheriff-and-commissioners-meet-discuss-potential-employee-pay-raise/.
- Haggard, Zoë. County’s Need for Corrections Officers Grows. Shelbyville Times-Gazette. [Online] February 1, 2022. https://www.t-g.com/stories/countys-needfor-correctionsofficers-grows,63804.
- U.S. Census Bureau. County Intercensal Tables: 2000-2010. [Online] Downloaded from https://www.census.gov/data/tables/time-series/demo/popest/intercensal-2000-2010-counties.html.
- —. State Population by Characteristics: 2020-2023. [Online] Downloaded from https://www.census.gov/data/tables/time-series/demo/popest/2020s-state-detail.html.
- Tennessee Department of Correction (TDOC). Bed Space & Capacity Reports. [Online] https://www.tn.gov/correction/statistics/bed-space—capacity-reports.html.