
Key Takeaways
- Inflation, which measures price increases and purchasing power, hit a 40-year high in recent months. It often climbs when demand outstrips supply or when production costs rise.
- Inflation increases operating costs in the private sector and at every level of government – including employee wages, borrowing costs, and long-term pension liabilities.
- The recent jump in inflation likely stems from a potent mix of overlapping factors – including increased consumer demand, supply chain issues, higher wages, and federal policy.
- Reliance on sales tax means state revenues may keep up with inflation better than those of local governments, which depend primarily on property tax.
- Recent decisions to bolster Tennessee’s rainy day and pension funds and put off some recurring spending have helped to brace the state for uncertainties created by high inflation.
Tennessee’s state and local leaders have navigated uncertain economic waters for over two years. Now, high inflation and its consequences pose new challenges. This report breaks down what’s going on, its effect on Tennessee’s state and local budgets, and what may be driving current conditions.
What is Inflation?
Inflation measures price increases. (1) There are several different official measures of inflation, but the most prominent – the Consumer Price Index for Urban Consumers (CPI-U) – tracks changes in the cost of a “market basket” of hundreds of specific common goods and services in dozens of categories. These include things like housing, food, transportation, fuel and energy, and health care. (2) (3) (4)
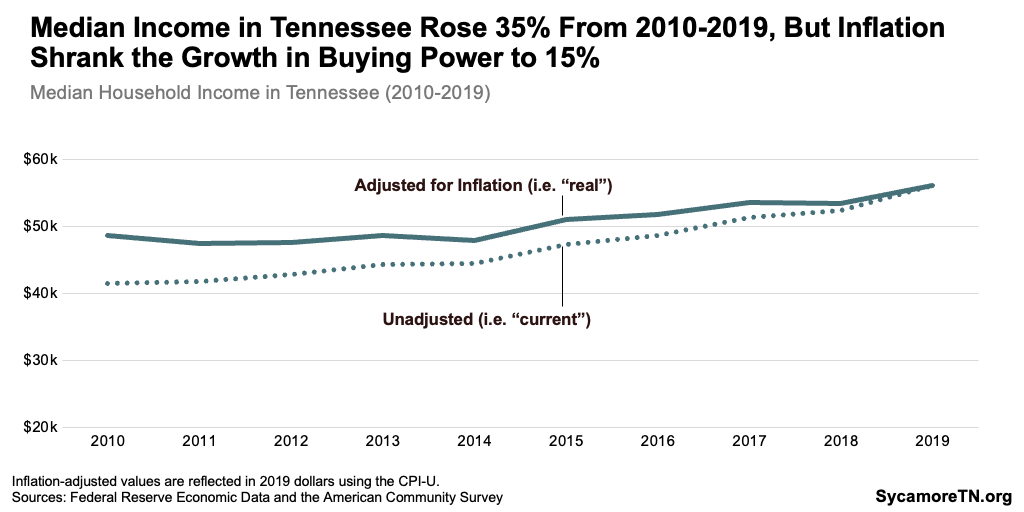
Inflation is also a measure of purchasing power. For example, an annual inflation rate of 5% means that a gallon of milk costs about 5% more than it did the year before. Due to that price increase, a dollar can buy 5% less than what it could buy before. For instance, median household income in Tennessee increased by 35% between 2010 and 2019. After accounting for inflation, however, the buying power of median household income increased by more like 15% (Figure 1). (5) (6)
Figure 1
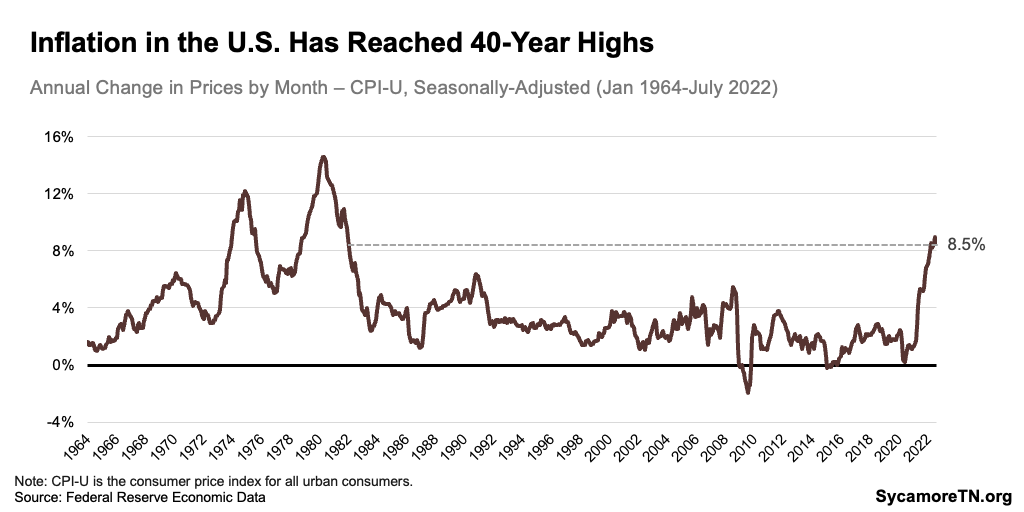
Inflation hit 8.5% in July – levels not reached since the early 1980s (Figure 2). Price increases slowed in the early months of the COVID-19 pandemic as consumer spending bottomed out. Since May 2020, however, prices have grown at a rate not seen in four decades. (5)
Figure 2
How Does Inflation Affect Tennessee’s State & Local Governments?
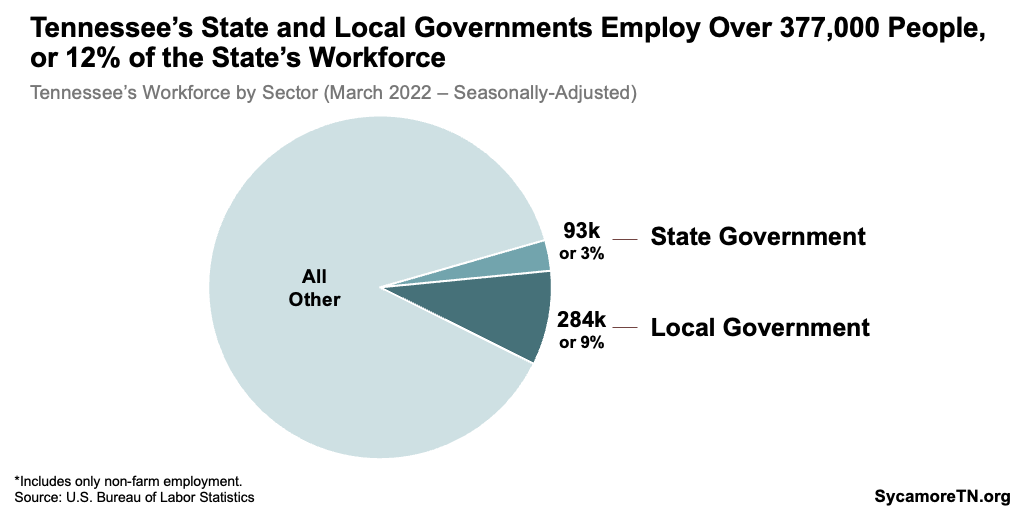
Inflation increases the short- and long-term costs of doing government business at both the state and local levels. The cost of both service delivery and capital projects increases with inflation. Because state and local governments comprise one of the largest employment sectors in Tennessee (Figure 3), they must also contend with a tight labor market and a demand for higher wages. (7) (8) Higher public worker wages also come with increased long-term retiree costs, which are tied to salary levels. (9) (10)
Figure 3
Federal policymakers often respond to inflation by raising interest rates to make debt more expensive – likely affecting Tennessee’s local governments more so than state. State and local governments in Tennessee often borrow money using bonds to fund capital projects like the construction of roads and schools. On average, our local governments rely more on bonds than the state does. The state had about $1.8 billion in outstanding bonds at the end of FY 2021 – which is about as large as 9% of total expenditures that year. (12) Meanwhile, the combined bond balance for the 91 smallest county governments audited by the state equaled about 45% of combined expenditures, and Metro Nashville’s totaled $3.7 billion – more than twice the city’s expenditures that year. (13) (14) Any new debt state or locals take on in the coming year will come with higher long-term interest costs. (8)
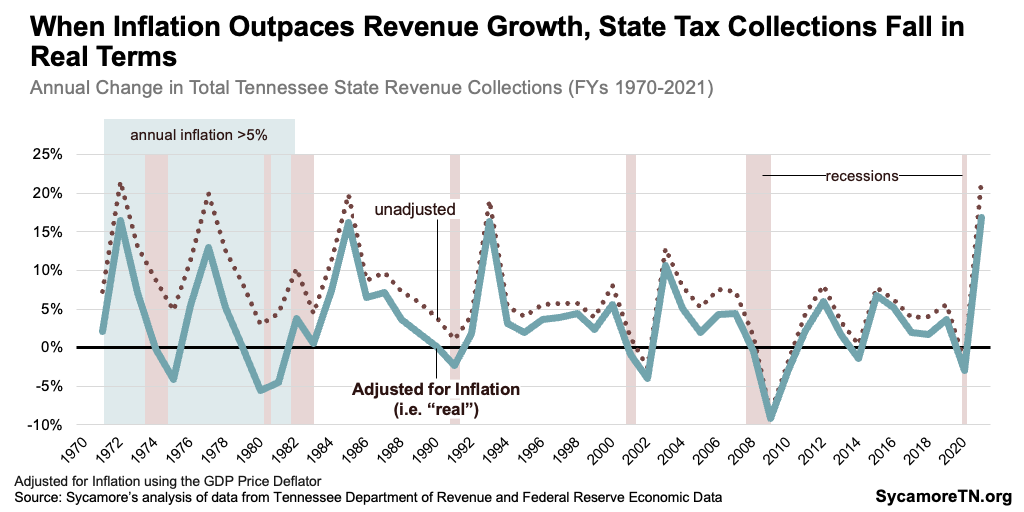
Inflation reduces the value of revenue collections, which makes it harder for policymakers to budget. Lawmakers typically build government budgets around projections of future revenue. When inflation grows faster than expected, officials may have to revise those plans and/or shortchange certain priorities. In eight of the last 50 years, for example, inflation outpaced the nominal (i.e. unadjusted) increase in state tax collections. In other words, tax revenues in those years actually fell in real terms (Figure 4). (15) (16) (17)
Figure 4
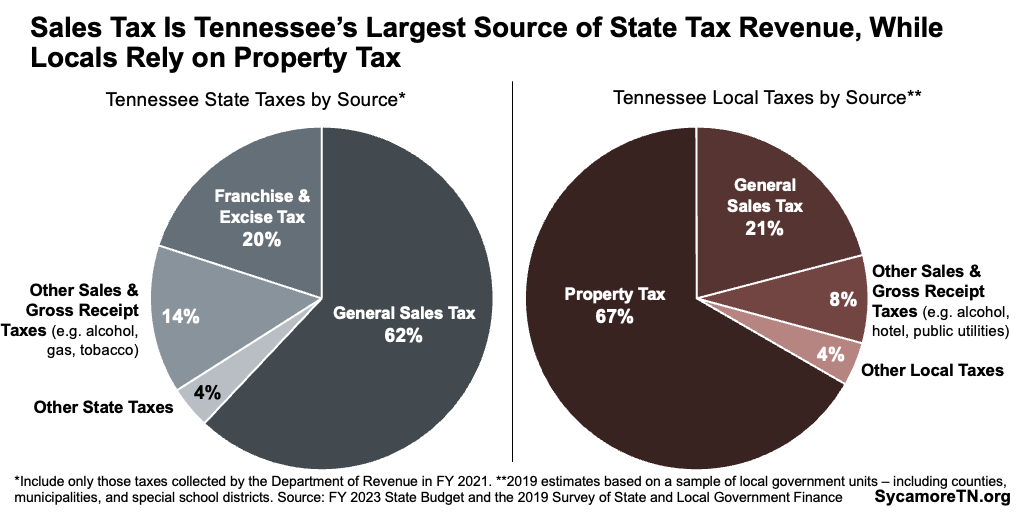
The state’s reliance on sales tax means its revenues may keep up with inflation better than those of local governments, which depend primarily on property tax. Here’s how the impact varies.
- Sales Tax: Sales tax is the state’s largest source of tax revenue and local governments’ second largest (Figure 4). Sales taxes are responsive to inflation because revenue goes up as prices rise. This means sales tax revenues generally keep pace with prices and consumer spending. Tennessee collects a 5% sales tax on groceries and 7% on all other goods and services, and local governments collect an additional 1.5-2.75% in local option sales tax.
- Property Tax: Property taxes are local governments’ largest tax revenue source (Figure 5). While property taxes can be responsive to housing price inflation, Tennessee’s rules for property tax collection increases may limit that response in practice. Under a state “truth in taxation” law, rising or falling property values trigger automatic rate changes to keep total property tax collections stable. (20) (21) If local officials wish to generate additional tax revenue from rising property values, they must vote to raise the rate – a move that may be politically difficult. (22)
Figure 5
At the same time, state and local spending decisions could potentially contribute to rising costs in specific areas or industries. (23) For example, Tennessee plans to spend billions on capital projects and infrastructure needs using large state surpluses and federal relief dollars. These historic investments could increase competition for construction services and drive up prices in the already booming industry in at least some parts of the state. (24)
Meanwhile, federal policy responses and consumer sentiment could contribute to a recession – which often boosts demand for public services and slows or shrinks tax collections. In addition to reducing inflation, declines in consumer spending and/or Federal Reserve interest rate hikes could even cause prices to fall. (25) (26) (27) That could shrink the nation’s economy and start a recession. Government budgets are countercyclical, meaning the demand for public services often increases when the economy takes a dip.
How Have Tennessee’s Governments Prepared?
Recent budget decisions have helped to brace the state for these uncertainties by bolstering the rainy day and pension funds and putting off some recurring spending. Under a balanced budget, each of these choices come with trade-offs. Being prepared for the consequences of historically high inflation, however, could potentially head off more difficult policy choices like tax hikes or service cuts. (8)
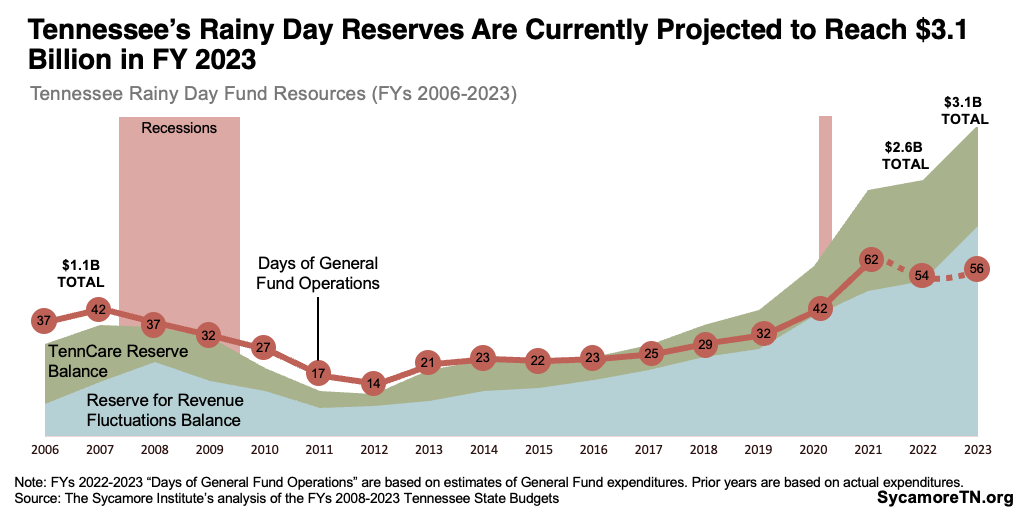
- Rainy Day Reserves: The state’s two main rainy day funds combined are on track to total $2.6 billion by the end of FY 2022 and $3.1 billion in FY 2023. Both figures are historically high and provide more cushion than the state had going into the Great Recession (Figure 6).
- Retiree Benefit Funds: The budget deposits $650 million in the trust funds that help pay for state employee retirement benefits.
- Delayed Recurring Spending: Due to fears that recent revenue gains may not last, the approved FY 2023 budget also uses about $1.4 billion of new recurring money for one-time expenses.
Figure 6
Data limitations make it difficult to assess local governments’ recession readiness, but the state comptroller recommends that local governments prepare for economic uncertainty. The comptroller’s office provides oversight of local government finance. The office encourages local governments to create rainy day funds, adopt policies for replenishing them, and maintain unrestricted fund balances large enough to cover at least two months of operations. (28) However, data on how often local officials adopt these practices are not readily available.
What Causes Inflation?
Supply and demand are central to the forces that drive prices and inflation. Demand is the desire for goods and services (including labor) in the economy, and supply is the total number of goods and services available in the economy. Prices help us allocate scarce resources. For example, a readily available product (i.e. high supply) that few people want (i.e. low demand) generally has a low price due to the lack of competition for it.
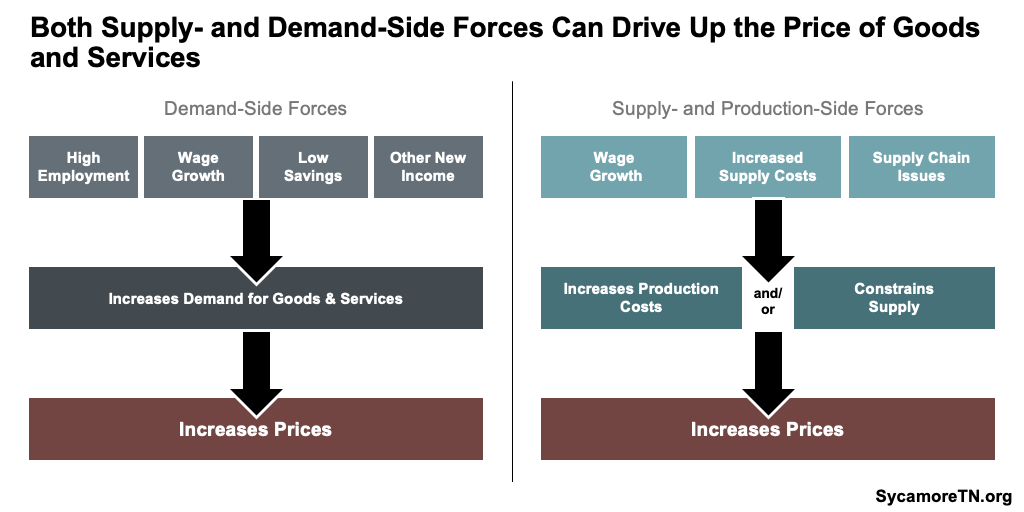
Prices often rise when 1) demand increases faster than supply or 2) it gets more expensive to produce goods and services (Figure 7). (29) (30) For example, growing demand without boosting supply increases competition and pulls up prices – known as demand-pull inflation. Likewise, cost-push inflation occurs when an increase in production costs drives up prices for a good or service.
Figure 7
Expectations about price increases can also fuel decisions that cause inflation. (30) For example, when people expect gasoline prices to spike, many rush to fill up their tanks – causing a shortage that drives up prices (i.e. demand-pull inflation). Uncertainty about price increases can also push up costs by leading people to negotiate for higher wages (i.e. cost-push inflation).
Increases in demand and production costs that drive inflation can be influenced by many factors. (29) (30) For example, demand for goods and services often grows when people have more money and/or are more willing to spend their money. This might result from a rise in employment or increases in wages or income. Meanwhile, production costs rise when the labor and materials needed to produce a good or service go up. Examples include higher wages or more expensive or limited raw materials. These forces can also create a self-reinforcing cycle of rising inflation in which wage increases boost prices, workers demand higher wages, production costs increase, and so on. This is known as wage-price spiral inflation.
How Does Public Policy Affect Inflation?
Governments’ fiscal and monetary policies can play an important role in influencing supply and demand.
- Fiscal policy includes taxes and spending. Federal, state, and local governments’ choices about taxing and spending can either limit or increase how much money people and businesses have to spend.(23)
- Monetary policy includes the actions of the Federal Reserve, which is the central bank of the United States. The Fed manages the amount of money in circulation and can also influence interest rates when it wants the cost of borrowing to rise or fall. (31) (32) (33) Business and consumer spending (i.e. demand) often increases when there is more money in circulation and when interests rates are low (i.e. savings are less “valuable”) (Figure 8). (34) Figure 9 shows how interest rates and inflation have interacted over the last 40 years. (5) (35)
Figure 8
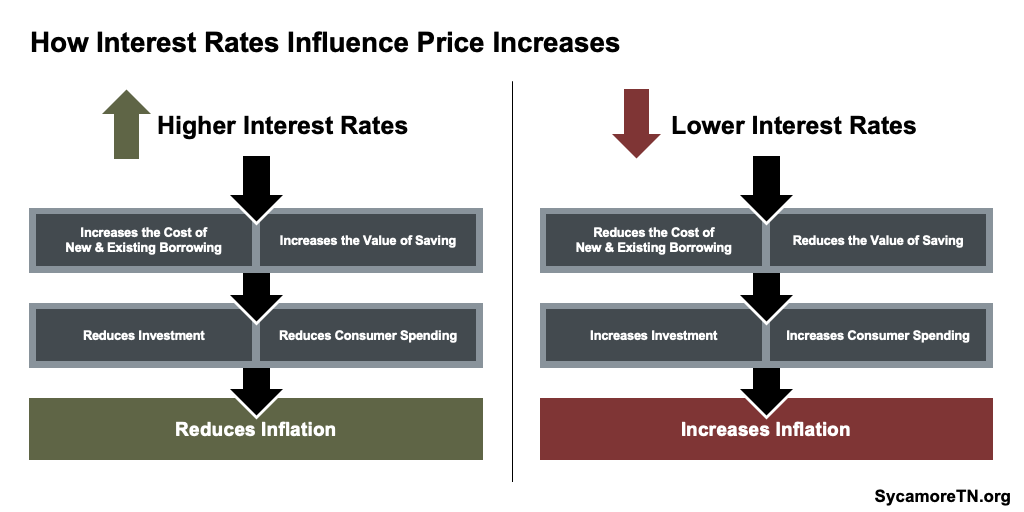
Figure 9
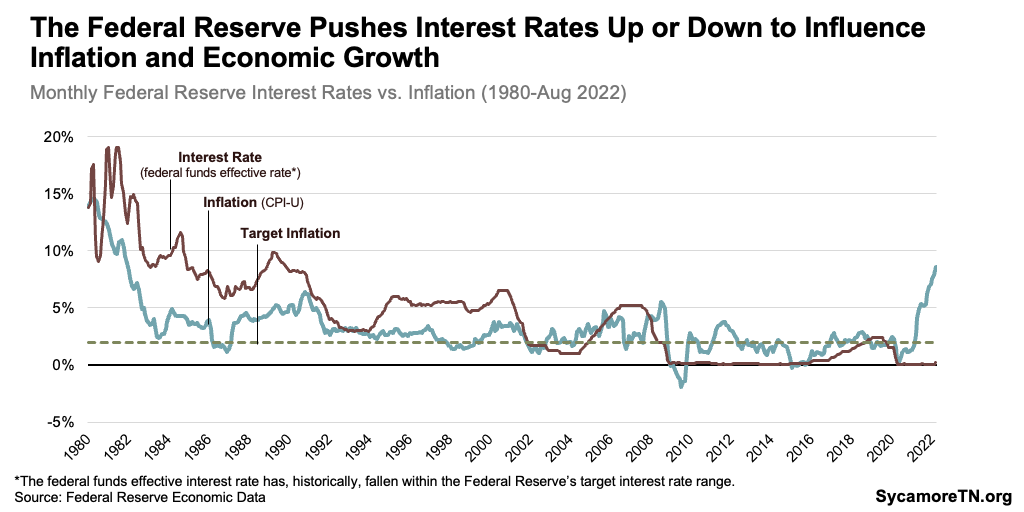
Economists widely accept 2% annual inflation as the “goldilocks zone,” and the Federal Reserve uses its monetary policy tools to try and hold inflation near that level. (1) Inflation rates that outpace wages reduce purchasing power, increase the cost of living, and sometimes over-burden households. Meanwhile, sluggish inflation rates can stunt the growth of business – creating higher unemployment or stagnant wages. The low interest rates that often follow low inflation can slow the investment and borrowing necessary for a healthy, growing economy. In addition, inflation rates that are too volatile can make it hard for businesses and consumers to plan future spending and investment. (36)
What’s Happening with Inflation Right Now?
A potent mix of overlapping inflationary challenges appear to be driving the recent and ongoing trend of rising prices. (37) (38) (39) (26) (40) (41) (42)
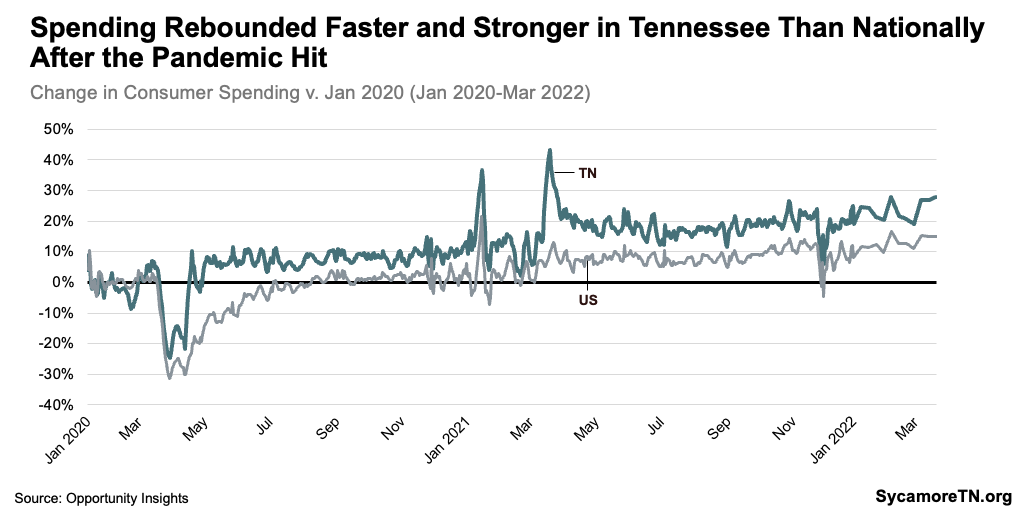
- Consumer Spending Changes and Increases: During the COVID-19 pandemic, consumer spending went down overall but also shifted away from services to goods. As the pandemic has waned, pent-up demand for both goods and services has surged. Meanwhile, people have more money to spend due to low unemployment and multiple rounds of federal aid. Figure 10 shows swift declines in consumer spending during the early months of the pandemic followed by a faster and stronger rebound in Tennessee than the country as a whole.(43)
Figure 10
- Supply Chain Issues: As demand has grown, businesses have struggled to keep up. Work in many industries around the world slowed or halted at various times during the pandemic, which had cascading effects on the supply of materials needed to make many products. Even as production ramps back up, lingering supply chain issues create delays and constrain the supply of goods available.
- Demand for Higher Wages: Workers are demanding higher wages as the result of both price increases and the jump in employee turnover known as “the Great Resignation.” (44) Those higher wages increase costs for producers, which drives prices up.
- Federal Fiscal Policy: While rapid inflation is currently a worldwide phenomenon, many experts agree that U.S. fiscal policy made things worse here. (45) (39) Since March 2020, the federal government has enacted six laws pitched as pandemic relief at a cost of $5.1 trillion plus an infrastructure bill with another $550 million in new spending – almost all of it funded by increasing the national debt. (46) (47) (48) This spending represents new money in the economy. For example, stimulus checks and enhanced unemployment benefits – which sometimes exceeded the wages they replaced – increased recipients’ purchasing power. Much of this expansionary fiscal policy was meant to alleviate the burdens of lost income during the pandemic, but one side effect has been additional inflation.
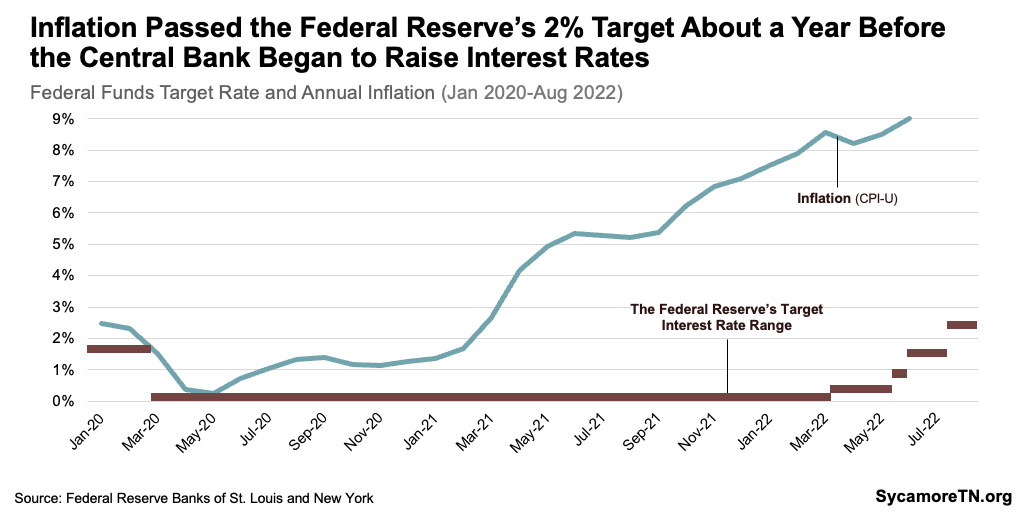
- Federal Monetary Policy: Some experts and economists believe the Federal Reserve overstimulated business and consumer spending during the pandemic by keeping interest rates too low for too long and the money supply too high (Figure 11). (49) (50) (33) (26) (27) As COVID-19 began to take hold in the U.S., the Fed dropped its benchmark interest rate to 0-0.25% to help the economy weather the economic effects of the pandemic. (51) It stayed at that level for two years until March 16, 2022, when the Fed made the first of four rate hikes so far this year. (52) The current federal funds target rate is 2.25-2.5%, and the more increases are likely as the central bank tries to bring inflation back down to its 2% target. (53)
Figure 11
- COVID and Conflict Around the Globe: The ongoing effects of the pandemic and new international conflicts have exacerbated supply issues in recent months – both in the U.S. and abroad. Continued pandemic lockdowns in China have prolonged the global supply chain issues created by COVID-19, and tensions over the status of Taiwan could further disrupt global trade. (54) Meanwhile, Russia’s invasion of Ukraine has affected the supply of food commodities, oil, and other critical resources. (53)
- Uncertainty: As countries around the world struggle to regain their pre-pandemic footing and deal with new conflicts, uncertainty over the future may add to inflationary pressures. While aspects of daily life have returned to previous norms, many economic changes – e.g. the growth of remote work, the fall in labor force participation, reshoring of supply chains, much higher housing costs – could have long-lasting effects that are not yet fully known.
There is reason to believe that current conditions have or could spark a recession. Rapid and significant drops in business and consumer spending could cause prices to fall and the economy to contract. The factors behind these spending decreases may vary, however. For example, consumers may spend less and save more when their confidence in the economy is low – as it is right now. (25) Meanwhile, the Federal Reserve risks curbing economic activity more than desired as it raises interest rates to fight inflation. (26) (27) While stock markets are not the most reliable economic indicator, recent declines could also dampen household and consumer spending. (55) (56) (57)
What is a recession?
NBER knows one when it sees it (eventually).
Recessions happen when economic activity shrinks, but how much and how long? A common rule of thumb is “two consecutive quarters of negative GDP, adjusted for inflation.” Officially, however, a recession in the U.S. is whatever the National Bureau of Economic Research’s (NBER) Business Cycle Dating Committee says it is.
This panel of eight economists determines start and end dates based on the combined “depth, diffusion, and duration” of economic decline, which they monitor using data on personal income, employment numbers, consumer spending and retail sales, production, and gross domestic product. Even within these parameters, they have “no fixed rule about what measures contribute information to the process or how they are weighted in our decision.” (60) (61) It often takes the NBER panel a year or more after the fact to make their decision.
Parting Words
For over two years, policymakers have had to contend with one of the most uncertain economies in recent history. Now, they will also need to factor high inflation into future budget decisions – with the knowledge that inflation may affect state and local governments’ revenue sources and fiscal constraints in different ways.
References
Click to Open/Close
- Board of Governors of the Federal Reserve System. What is Inflation and How Does the Federal Reserve Evaluate Changes in the Rate of Inflation. [Online] September 9, 2016. [Cited: June 14, 2022.] https://www.federalreserve.gov/faqs/economy_14419.htm
- Salwati, Nasiha and Wessel, David. How Does the Government Measure Inflation? Brookings. [Online] June 28, 2021. https://www.brookings.edu/blog/up-front/2021/06/28/how-does-the-government-measure-inflation/
- Desilver, Drew. As Inflation Soars, A Look At What’s Inside the Consumer Price Index. Pew Research Center. [Online] January 24, 2022. https://www.pewresearch.org/fact-tank/2022/01/24/as-inflation-soars-a-look-at-whats-inside-the-consumer-price-index/
- Bullard, James. President’s Message: CPI vs. PCE Inflation: Choosing a Standard Measure. Federal Reserve Bank of St. Louis. [Online] July 1, 2013. https://www.stlouisfed.org/publications/regional-economist/july-2013/cpi-vs-pce-inflation–choosing-a-standard-measure
- U.S. Bureau of Labor Statistics. Consumer Price Index for All Urban Consumers: All Items in U.S. City Average (CPIAUCSL). [Online] [Cited: August 9, 2022.] Retrieved from FRED, Federal Reserve Bank of St. Louis via https://fred.stlouisfed.org/series/CPIAUCSL
- U.S. Census Bureau. S1903: Median Income in the Past 12 Months. American Community Survey 1-Year Estimates for 2010-2019. [Online] [Cited: May 4, 2022.] Retrieved from http://data.census.gov
- Farmer, Liz. The Great Resignation’s Impact on Local Government. Insurance Advocate. [Online] January 24, 2022. https://www.insurance-advocate.com/2022/01/24/the-great-resignations-impact-on-local-government/
- Tax Policy Center. The Prescription: Fiscal Policy for Today’s Economy with Brian Sigritz. Urban Institute and Brookings. [Online] May 5, 2022. https://www.youtube.com/watch?v=T3SloI_Fh7Y
- Greenblatt, Alan. What Inflation Means for State and Local Budgets. Governing. [Online] April 25, 2022. https://www.governing.com/finance/what-inflation-means-for-state-and-local-budgets
- The Volcker Alliance. Special Briefing on Inflation and Recession Risks for States and Cities. [Online] April 21, 2022. https://www.volckeralliance.org/events/special-briefing-inflation-and-recession-risks-states-and-cities
- U.S. Bureau of Labor Statistics. State and Area Employment, Hours, and Earnings (March 2022). [Online] [Cited: May 10, 2022.] Accessed via https://www.bls.gov/data/
- State of Tennessee. Annual Comprehensive FInancial Report for FY 2021. [Online] December 2021. https://www.tn.gov/content/dam/tn/finance/acfr/ACFR_fy21.pdf
- The Metropolitan Government of Nashville and Davidson County. FY 2022-23 through FY 2027-28 Mayor’s Draft. [Online] May 14, 2022. https://www.nashville.gov/sites/default/files/2022-05/FY23_CIB_MayorsDraft.pdf?ct=165257836
- —. Annual Comprehensive Financial Report for FY 2021. [Online] 2021. https://comptroller.tn.gov/content/dam/cot/la/advanced-search/2021/other/1464-2021-cn-davidsonco-rpt-cpa284-1-20-22-rev1.pdf
- Tennessee Department of Revenue. Historic Collections Data. [Online] [Cited: August 9, 2022.] Downloaded from https://www.tn.gov/revenue/tax-resources/statistics-and-collections/additional-resources-for-researchers.html
- —. Monthly Collections Spreadsheets for June 2020 and June 2021. [Online] [Cited: August 9, 2022.] Downloaded from https://www.tn.gov/revenue/tax-resources/statistics-and-collections/monthly-collections-spreadsheets.html
- U.S. Bureau of Economic Analysis. Gross Domestic Product: Implicit Price Deflator [GDPDEF]. [Online] [Cited: August 9, 2022.] retrieved from FRED, Federal Reserve Bank of St. Louis at https://fred.stlouisfed.org/series/GDPDEF
- State of Tennessee. FY 2023 Tennessee State Budget. [Online] February 2022. Available via https://www.tn.gov/finance/fa/fa-budget-information/fa-budget-archive.html
- U.S. Census Bureau. State and Local Government Finances by Level of Government and State: 2019. [Online] 2021. Data retrieved from https://www.census.gov/data/datasets/2019/econ/local/public-use-datasets.html
- State of Tennessee. Tenn. Code Ann. § 67-5-1701. [Online] Retrieved from LexisNexis on August 9, 2022.
- Tennessee Comptroller of the Treasury. Property Tax Reappraisal and Certified Tax Rate. [Online] June 14, 2022. https://comptroller.tn.gov/boards/state-board-of-equalization/sboe-resources/certified-tax-rate.html
- The Tennessee Advisory Commission on Intergovernmental Relations (TACIR). The Local Property Tax in Tennessee. [Online] February 2002. https://www.tn.gov/content/dam/tn/tacir/documents/LOCAL_PROPERTY_TAX.pdf
- Cassella, Megan. States Could Drive Rising Prices Even Higher. Here’s How. Barron’s. [Online] January 7, 2022. https://www.barrons.com/articles/inflation-risk-states-stimulus-51641431634
- ENR Southeast. Nashville City Scoop: Construction Starts Stay Steady. [Online] January 14, 2022. https://www.enr.com/articles/53434-nashville-city-scoop-construction-starts-stay-steady
- Cox, Jeff. Strong Inflation, Anxious Consumers Add Up to More Worries That Recession Has Already Arrived. CNBC. [Online] June 10, 2022. https://www.cnbc.com/2022/06/10/inflation-consumer-woe-add-to-worries-that-recession-is-already-here.html
- Carlsson-Szlezak, Philipp, Swartz, Paul and Reeves, Martin. Assessing the Current Risks to the U.S. Economy. Harvard Business Review. [Online] March 14, 2022. https://hbr.org/2022/03/assessing-the-current-risks-to-the-u-s-economy
- White, Ben. 8/9. That’s the Fed’s Record on Triggering a Recession While Trying to Fix Inflation. Politico. [Online] March 29, 2022. https://www.politico.com/news/2022/03/29/federal-reserve-recession-inflation-rates-00021119
- Tennessee Comptroller of the Treasury. Tennessee Budget Manual for Local Governments. [Online] June 2021. https://comptroller.tn.gov/office-functions/lgf/budgets/budget-manual-and-schedules.html
- Federal Reserve Bank of San Francisco. What Are Some of the Factors that Contribute to a Rise in Inflation? [Online] October 2002. https://www.frbsf.org/education/publications/doctor-econ/2002/october/inflation-factors-rise/
- Congressional Research Service (CRS). Introduction to U.S. Economy: Inflation. [Online] November 22, 2021. https://crsreports.congress.gov/product/pdf/IF/IF10477
- Board of Governors of the Federal Reserve System. What Is the Difference Between Monetary Policy and Fiscal Policy, and How Are They Related? [Online] August 9, 2017. [Cited: June 14, 2022.] https://www.federalreserve.gov/faqs/money_12855.htm
- Ihrig, Jane and Wolla, Scott A. The Fed’s New Monetary Policy Tools. Fedearl Reserve Bank of St. Louis. [Online] August 2020. https://files.stlouisfed.org/files/htdocs/publications/page1-econ/2020/08/03/the-feds-new-monetary-policy-tools_SE.pdf
- Labonte, Marc. The Federal Reserve and Inflation. Congressional Research Service. [Online] March 21, 2022. https://crsreports.congress.gov/product/pdf/IN/IN11868
- Board of Governors of the Federal Reserve System. Why Do Interest Rates Matter? [Online] September 9, 2016. [Cited: June 14, 2022.] https://www.federalreserve.gov/faqs/why-do-interest-rates-matter.htm
- —. Effective Federal Funds Rate. [Online] [Cited: August 9, 2022.] Retrieved from Federal Reserve Bank of New York via https://www.newyorkfed.org/markets/reference-rates/effr
- —. Why Does the Federal Reserve Aim for Inflation of 2 Percent Over the Longer Run? [Online] August 27, 2020. [Cited: June 14, 2022.] https://www.federalreserve.gov/faqs/economy_14400.htm
- McCausland, Phil. What Is Causing Inflation? Economists Point Fingers At Different Culprits. CBS News. [Online] February 16, 2022. https://www.nbcnews.com/business/business-news/whats-causing-inflation-economists-point-fingers-different-culprits-rcna16156
- Labonte, Marc and Weinstock, Lida R. Inflation in the Wake of COVID-19. Congressional Research Service. [Online] September 1, 2021. https://crsreports.congress.gov/product/pdf/R/R46890
- Smialek, Jeanna and Swanson, Ana. Rapid Inflation Fuels Debate Over What’s to Blame: Pandemic or Policy. The New York Times. [Online] January 22, 2022. https://www.nytimes.com/2022/01/22/business/economy/inflation-biden-pandemic.html
- Edelberg, Wendy and Barnes, Mitchell. Inflation-Related Updates to ‘Recession Remedies’. Brookings. [Online] May 18, 2022. https://www.brookings.edu/blog/up-front/2022/05/18/inflation-related-updates-to-recession-remedies-lessons-learned-from-the-u-s-economic-policy-response-to-covid-19/
- Boyd Center for Business and Economic Research (CBER). An Economic Report to the Governor of the State of Tennessee: The State’s Economic Outlook. University of Tennessee Haslam College of Business. [Online] January 2022. https://haslam.utk.edu/wp-content/uploads/2021/12/ERG2022.pdf
- Scott, Amy and McHenry, Sean. Why It’s So Hard to Agree on the Causes of Inflation. Marketplace. [Online] April 4, 2022. https://www.marketplace.org/2022/04/04/why-its-so-hard-to-agree-on-the-causes-of-inflation/
- Chetty, Raj, et al. Data from Affinity compiled by Opportunity Insights. Opportunity Insights. [Online] [Cited: May 4, 2022.] Accessed via https://tracktherecovery.org
- Faccini, Renato, Melosi, Leonardo and Miles, Russell. The Effects of the “Great Resignation” on Labor Market Slack and Inflation. Federal Reserve Bank of Chicago. [Online] February 2022. https://www.chicagofed.org/publications/chicago-fed-letter/2022/465
- Desilver, Drew. Inflation Has Risen Around the World, But the U.S. Has Seen One of the Biggest Increases. Pew Research Center. [Online] November 24, 2021. https://www.pewresearch.org/fact-tank/2021/11/24/inflation-has-risen-around-the-world-but-the-u-s-has-seen-one-of-the-biggest-increases/
- Congressional Budget Office. The Budgetary Effects of Laws Enacted in Response to the 2020 Coronavirus Pandemic, March and April 2020. [Online] June 2020. https://www.cbo.gov/system/files/2020-06/56403-CBO-covid-legislation.pdf
- —. The Budgetary Effects of Major Laws Enacted in Response to the 2020-2021 Coronavirus Pandemic, December 2020 and March 2021. [Online] September 2021. https://www.cbo.gov/system/files/2021-09/57343-Pandemic.pdf
- Sprunt, Barbara, Kim, Caitlyn and Shivara, Deepa. Biden Says Final Oassage of $1 trillion Infrastructure Plan is a Big Step Forward . NPR. [Online] November 6, 2021. https://www.npr.org/2021/11/05/1050012853/the-house-has-passed-the-1-trillion-infrastructure-plan-sending-it-to-bidens-des
- The Economist. Why the Federal Reserve Has Made a Historic Mistake on Inflation. [Online] June 9, 2022. https://www.economist.com/leaders/2022/04/23/why-the-federal-reserve-has-made-a-historic-mistake-on-inflation
- Lynch, David J. Inflation Has Fed Critics Pointing to Spike in Money Supply. The Washington Post. [Online] February 6, 2022. https://www.washingtonpost.com/business/2022/02/06/federal-reserve-inflation-money-supply/
- The Federal Reserve. Press Release: March 15, 2020. [Online] March 15, 2020. https://www.federalreserve.gov/monetarypolicy/files/monetary20200315a1.pdf
- —. FOMC Statement: March 16, 2022. [Online] March 16, 2022. https://www.federalreserve.gov/newsevents/pressreleases/monetary20220316a.htm
- —. FOMC Statement: July 27, 2022. [Online] July 27, 2022. https://www.federalreserve.gov/newsevents/pressreleases/monetary20220727a.htm
- Langley, William, Ho-him, Chan and Hale, Thomas. How Rising Tensions Across the Taiwan Strait Could Threaten Global Trade. Financial Times. [Online] August 7, 2022. https://www.ft.com/content/68871ec9-6741-4e0a-8542-940152df4e36
- Conerly, Bill. Why the Stock Market Drop Does Not Predict Recession. Forbes. [Online] May 21, 2022. https://www.forbes.com/sites/billconerly/2022/05/21/why-the-stock-market-drop-does-not-predict-recession
- Lachman, Desmond. The Bear Market Could Drive the Economy Straight Into Recession. American Enterprise Institute. [Online] June 14, 2022. https://www.aei.org/op-eds/the-bear-market-could-drive-the-economy-straight-into-recession/
- Hadi, Mohammed and Smialek, Jeanna. Bear Market Sends Grim Signal of Economic Fears. The New York Times. [Online] June 13, 2022. https://www.nytimes.com/2022/06/13/business/stocks-bonds-crypto.html
- State of Tennessee. Public Chapter No. 591 (2021). [Online] 2021. https://publications.tnsosfiles.com/acts/112/pub/pc0591.pdf
- Tennessee Comptroller of the Treasury. The Sycamore Institute’s analysis of TAG – FY 2021 County Data on Expenditures and Debt. [Online] [Cited: May 9, 2022.] Downloaded from rom https://comptroller.tn.gov/office-functions/la/e-services/tag-tableau/tag-exports.html
- National Bureau of Economic Research. Business Cycle Dating Procedure: Frequently Asked Questions . [Online] July 19, 2021. https://www.nber.org/business-cycle-dating-procedure-frequently-asked-questions
- Matthews, Steve. There’s No US Recession Until an Obscure Panel of ‘Eggheads’ Says It Is So . Bloomberg. [Online] July 12, 2022. https://www.bloomberg.com/news/articles/2022-07-12/no-us-recession-until-obscure-panel-of-eggheads-says-it-is-so


