In the early months of the COVID-19 pandemic, jobs losses in Tennessee skyrocketed, and consumer spending plummeted – with some industries and sectors affected more than others. Once federal economic relief started making its way across the country, some of these effects began to rebound. Over a year into the pandemic, however, some in Tennessee still have not fully recovered.
This report examines the latest available data on how different groups, industries, and regions in Tennessee have fared economically. This information may help policymakers as they decide how best to use state and local resources and historic federal aid.
Key Takeaways
- In June 2021, Tennessee’s unemployment rate was one percentage point higher than before the pandemic and remained elevated in all but 2 of the state’s 95 counties.
- Health concerns, caregiving needs, a change in worker preferences, and unemployment benefits may all factor into the recent sluggishness of our labor market rebound.
- As of late June 2021, there were 40% fewer small businesses in Tennessee than before the pandemic – even after an historic surge of new filings earlier this year.
- Black Tennesseans, younger adults, and women were more likely to report economic hardship last year – some of which dissipated after the early months of the pandemic.
- The continued threat of another sustained surge in COVID-19 cases could stall or even reverse many of the state’s economic gains.
Returning to Work but Not to Normal
Tennessee’s topline economic measures have largely recovered from the shock of COVID-19, but certain symptoms may linger for some time. Consumer spending bounced back quickly last year, new businesses are opening in record numbers, and employment is rising steadily. (1) (2) (3) (4) Some companies even thrived during the pandemic, but many others are permanently closed or still scraping by – especially ones that get significant revenue from commuters. (5) Meanwhile, Americans are quitting their jobs in record numbers as people reevaluate life and career goals and employers increasingly call remote workers back to the office. (6) (7)
Figure 1
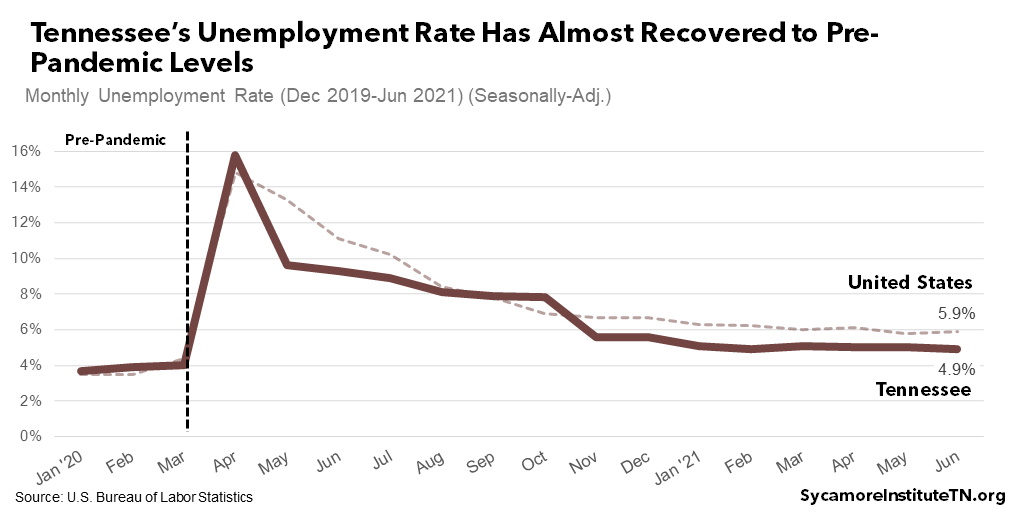
A Recap of Job Loss and Recovery in Tennessee
As of June 2021, Tennessee’s unemployment rate remained one percentage point higher than February 2020 before the pandemic began to affect the state’s economy (Figure 1).[i] Our unemployment rate soared to over 15% in the early months of the pandemic before declining steadily the rest of the year. As of June 2021, the overall unemployment rate had ebbed to 4.9%. (3) (8)
Despite large losses, Tennessee’s economy fared relatively well by national standards. Overall, the changes in employment in Tennessee followed national trends but at less severe levels. For example, June 2021 unemployment for the United States as a whole was 2.4 percentage points higher than it had been before the pandemic.
Figure 2
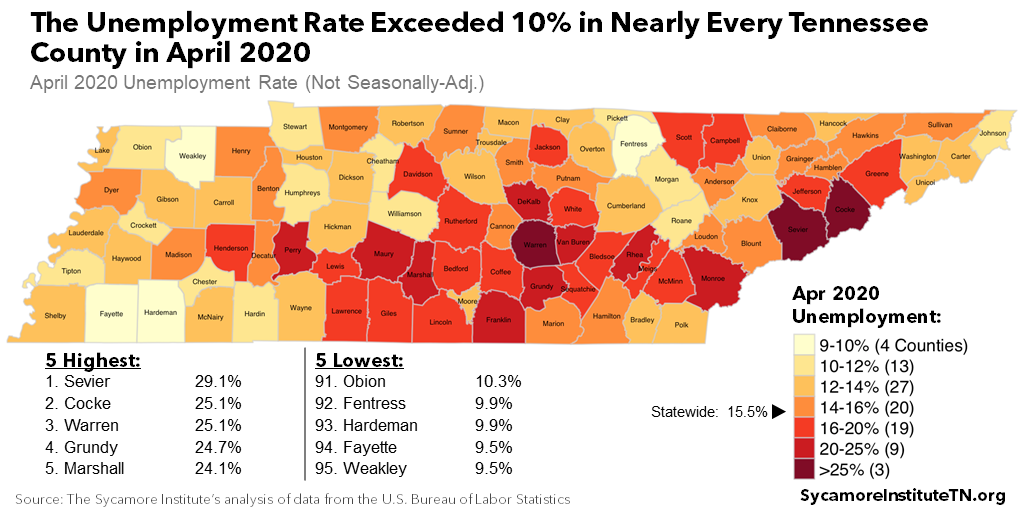
Employment by County
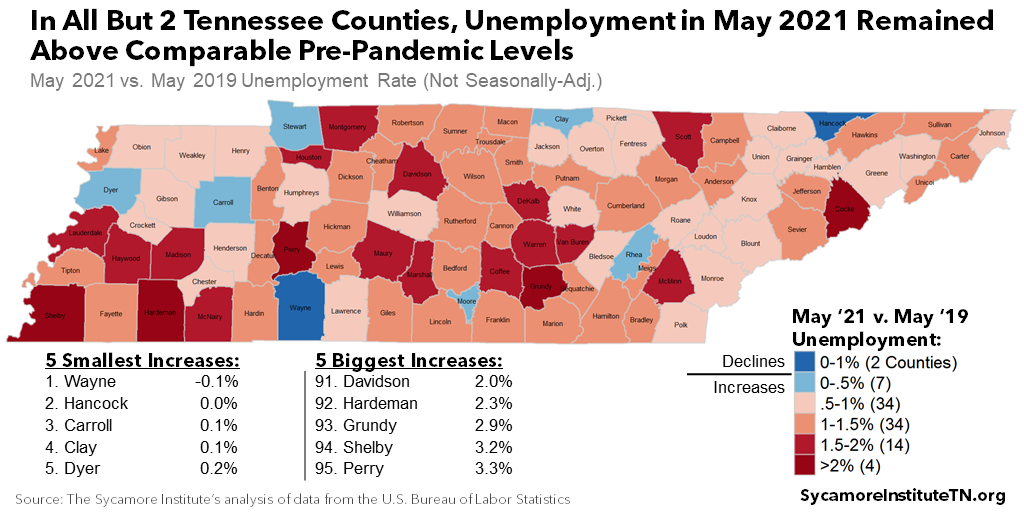
Unemployment has not recovered to pre-pandemic levels in all but two counties. In the early months of the pandemic, peak unemployment ranged from 9.5% in Fayette and Weakley Counties to 29.1% in Sevier County (Figure 2). Joblessness has since fallen across the board, with May 2021 unemployment ranging from 2.7% in Moore and Williamson Counties to 7.1% in Perry County (Figure 3). Compared to just before the pandemic arrived, unemployment rates were the same or better in 49 counties —although these numbers were not adjusted for seasonal variation.i Compared to the same month pre-pandemic (May 2019), only two counties had fully recovered. (Figure 4).
Figure 3
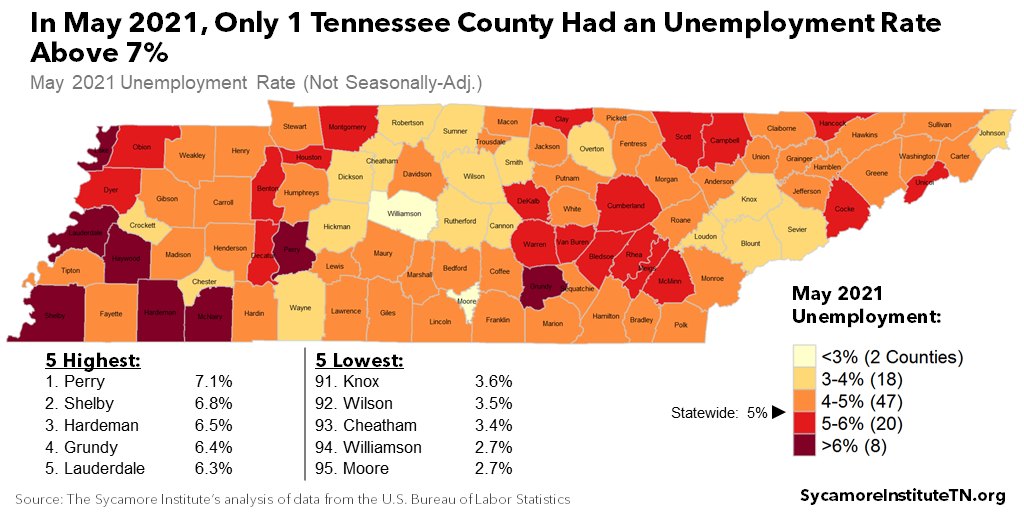
Figure 4
Tennessee’s Hardest-Hit Jobs
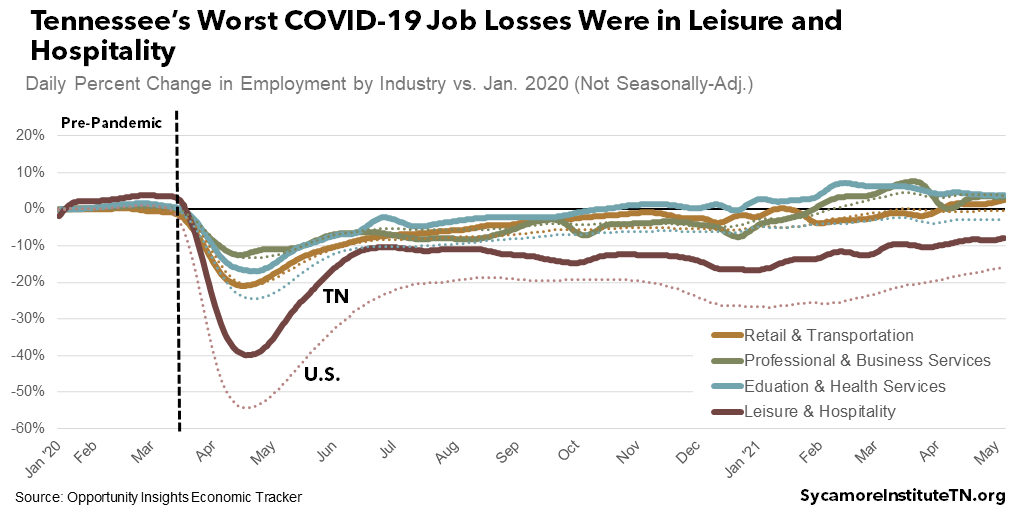
In Tennessee and nationwide, the heaviest job losses occurred among low-income positions and in the leisure and hospitality sector (Figures 5 and 6). (1) Employment fell in April 2020 across all income levels and industries, but many categories soon rebounded to near pre-pandemic levels. For jobs paying less than $27,000 and those in leisure and hospitality, however, the losses were both more severe and enduring. Employment in these two categories had still not returned to January 2020 levels as of early May 2021.
Even in these hardest hit areas of the economy, Tennessee fared better than the country as a whole. As of early May 2021, leisure and hospitality employment remained nearly 16% below pre-pandemic levels nationwide despite declining by just 8% in Tennessee (Figure 5). Likewise, low-wage employment was down over 22% nationally compared to a decrease of 10% in Tennessee (Figure 6).
Figure 5
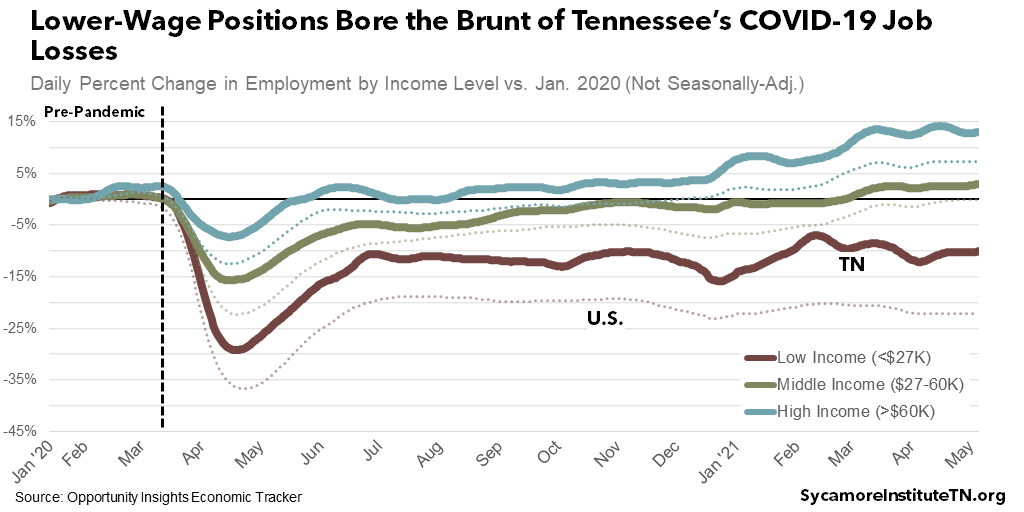
Figure 6
A Changing Labor Market
As the nation’s economy emerges from COVID-19, many labor market indicators have stagnated, and businesses in some sectors have struggled to find workers. For example:
- After leveling off, neither the unemployment rate nor labor force participation in Tennessee have fully recovered to pre-pandemic levels (Figures 1 and 7).
- Tennessee’s job vacancies began to tick up in early 2021. (Figure 8) (10) (11)
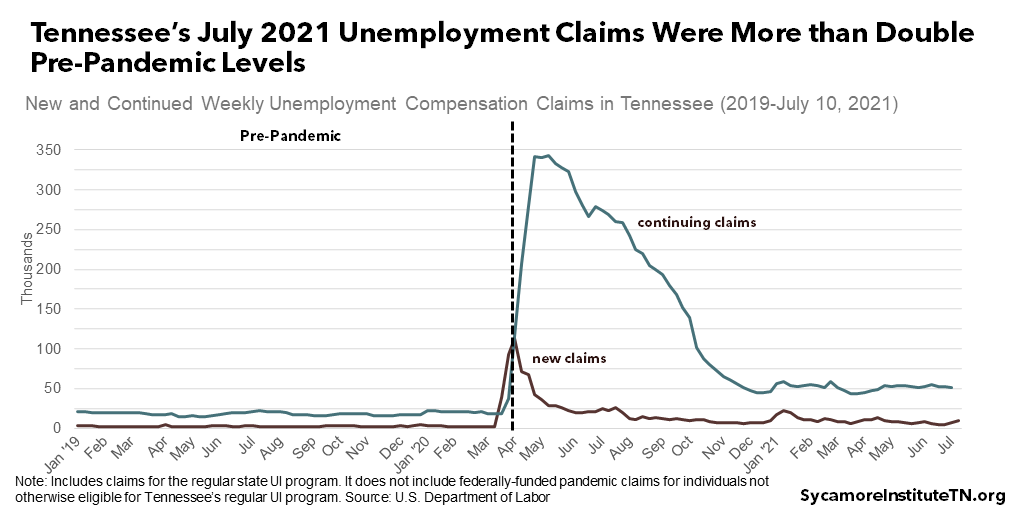
- Claims for Tennessee’s regular unemployment insurance (UI) program were still more than double pre-pandemic levels through the first two weeks of July 2021 (Figure 9).
- Nearly half of small businesses surveyed by the National Federation of Independent Businesses reported job vacancies in June – well above a 22% historical average. (12) Those in low-wage, high-demand sectors in particular have reported struggling to fill open positions. (13)
Figure 7
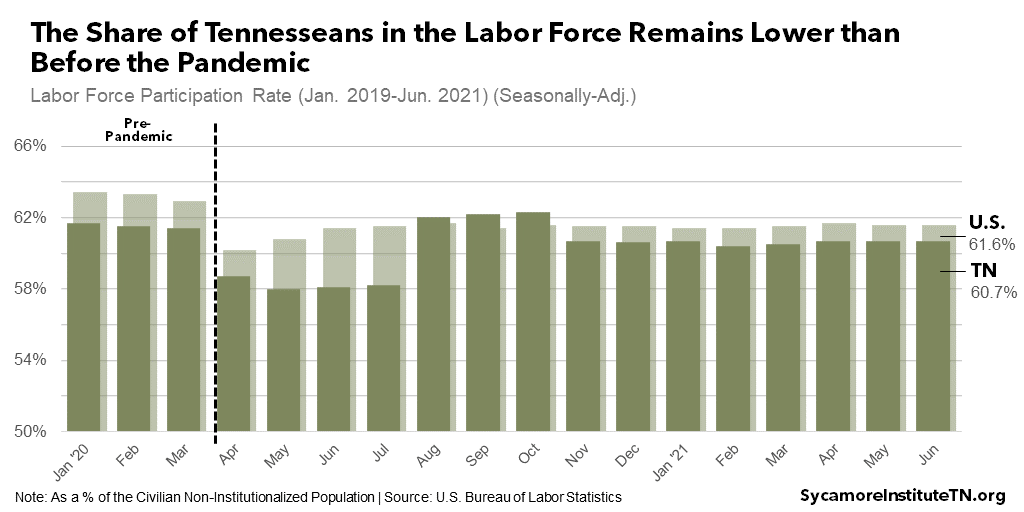
Figure 8
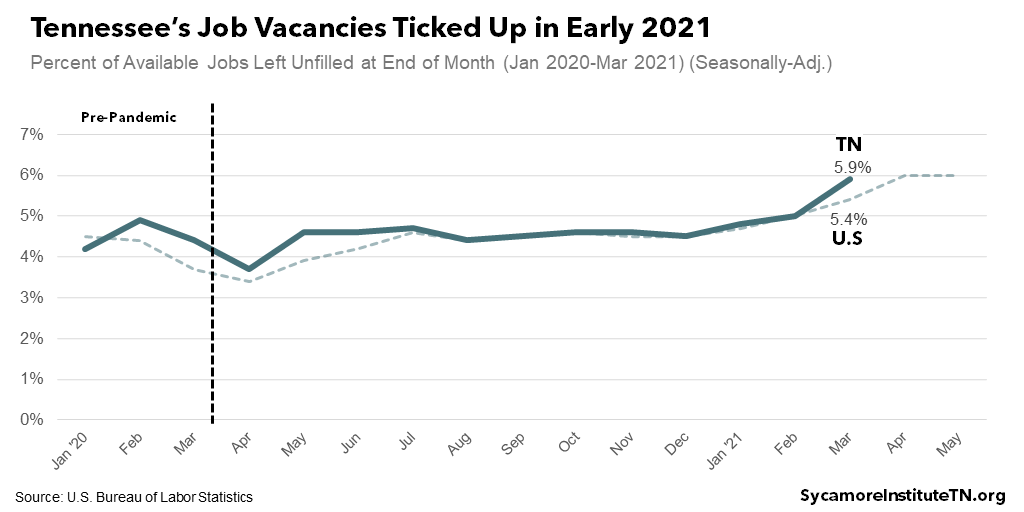
Figure 9
Although there is not broad consensus, a combination of overlapping factors seems to be driving the tight labor market and static employment. The nation is still in the midst of the economic recovery, so good data and a wealth of rigorous research on the causes underlying the trends above simply aren’t available yet. Some of the potential causes that have been cited and supported by varying degrees of evidence include:
- COVID Concerns – While restrictions have eased and vaccinations have increased, many workers still have concerns about COVID-19 either for themselves or family members at high risk. (18) (19) (20)
- Unemployment Benefits – A federally-funded $600 per-week supplemental unemployment benefit was meant to replace income (and consumer spending) for workers who lost jobs due to COVID-19 closures. The American Rescue Plan extended a scaled-back $300 version just as pandemic restrictions eased, vaccinations increased, and the economy began to fully open. Concerned that these extra benefits might dissuade Tennesseans from returning to work, Gov. Lee ended them in July.(21) Early but limited research suggests these extra benefits may have a small effect on how quickly people return. (22) (23) However, at least part of that effect was likely to make other life and career choices possible rather than discouraging work entirely. (19) (23) (24) (20)
- Employment Churn – Beneath the topline numbers in recent months has been greater-than-usual movement in employment ins and outs. That is, lots of people are switching jobs as they reevaluate their priorities and career goals – sometimes taking time between jobs that translates to vacancies and unemployment. (24) (19)
- Caregiving – Many left the workforce during the pandemic to take on caregiver responsibilities when schools and child care facilities closed – particularly mothers. As schools start to reopen this fall, some economists believe labor force participation will ultimately rebound – especially as lessons learned from the pandemic may fuel more flexible work arrangements. (25) (26) (19) (24) (20)
- Older Workers – People over 55 were also responsible for more than their fair share of declines in labor force participation. These folks may be more cautious to return to normal due to higher risk for COVID-related morbidity and mortality, or they may remain out of the workforce altogether and go into early retirement. (26)
- Changing Preferences – Some people may be taking their time to accept a new job as they reevaluate their preferences – including things like dissatisfaction with pre-pandemic pay and working conditions or the desire for more flexible work arrangements. (19)(13)
- Skills Mismatch – The pandemic had a disproportionate impact on low-wage, “customer-facing” industries that found ways to adapt with fewer employees. Many of these jobs may not come back – leaving a mismatch between the skillsets of available workers and the skills that available jobs require. (27) (28)
Whether the long-term effects of these trends are good or bad is not yet clear. The sluggish improvements in labor and employment may translate to not only a slower recovery but other suboptimal outcomes – higher costs and lower output for businesses and steeper prices for consumers. Prolonged periods of unemployment can also hurt workers’ long-term job prospects and earning potential, which is bad for the entire economy. (20) However, if folks ultimately go back to jobs that are a step up or a better match, that can mean greater productivity and bigger economic growth over the longer-term. (24)
Figure 10
Small Businesses in Tennessee
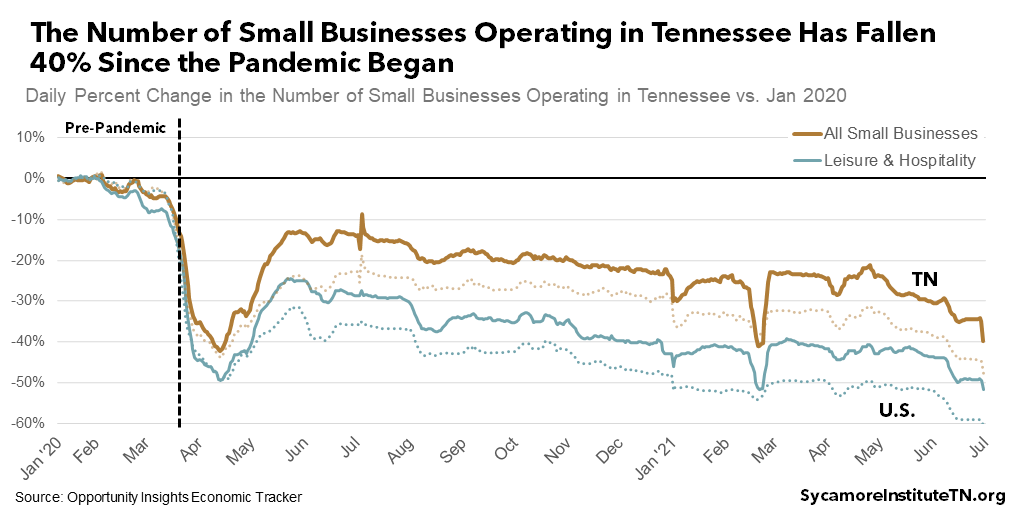
As of late June 2021, there were 40% fewer small business in Tennessee than before the pandemic (Figure 10). (1) Small businesses drive much of Tennessee’s employment. In March 2020, they accounted for about 99% of total employment and two-thirds of total wages. (31) There was a steep drop in the number of small businesses operating in Tennessee early in the pandemic followed by a fairly quick rebound. Following that rebound, however, the number of small businesses fell steadily throughout the remainder of 2020.
Early in 2021, Tennessee experienced a historic surge in initial filings for new businesses. (32) Nationally, recent research indicates that many new businesses are in communities with higher shares of black residents, and federal stimulus funding may have helped people finance these endeavors. (2) However, the recent surge in new filings has not been large enough to offset the overall decline in small businesses across Tennessee during the pandemic.
Small businesses in Tennessee’s leisure and hospitality industry were the hardest hit by the pandemic. Businesses in leisure and hospitality shed more workers than other types of business due to the pandemic (Figure 6). In addition, the smallest among them were more likely to close their doors for good than other small businesses (Figure 10). Between January 2020 and June 2021, Tennessee ultimately lost nearly 40% of the small businesses in this industry.
Although 2020 was a trying year for Tennessee businesses, they fared better than the national average. As of late June 2021 the total number of small businesses operating in the United States was down nearly 48% from pre-pandemic levels – compared to 40% in Tennessee. Small businesses in the leisure in hospitality industry were down almost 61% – versus 52% in Tennessee. There are encouraging signs of growth for Tennessee’s economy looking forward, but employment remains below pre-pandemic levels and business leaders across the state express pessimism about the near-term hiring outlook. (32) (33)
Figure 11
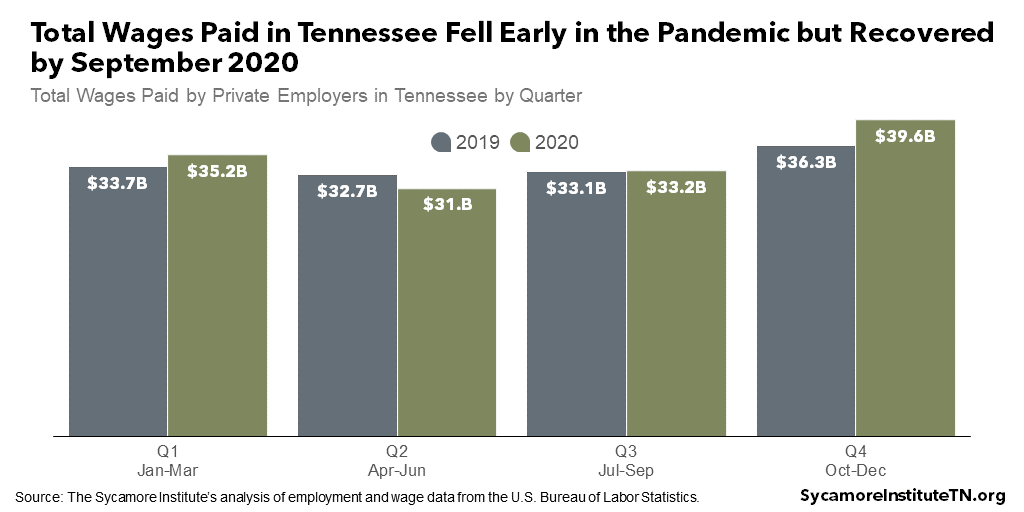
Figure 12
Total Wages Paid in Tennessee
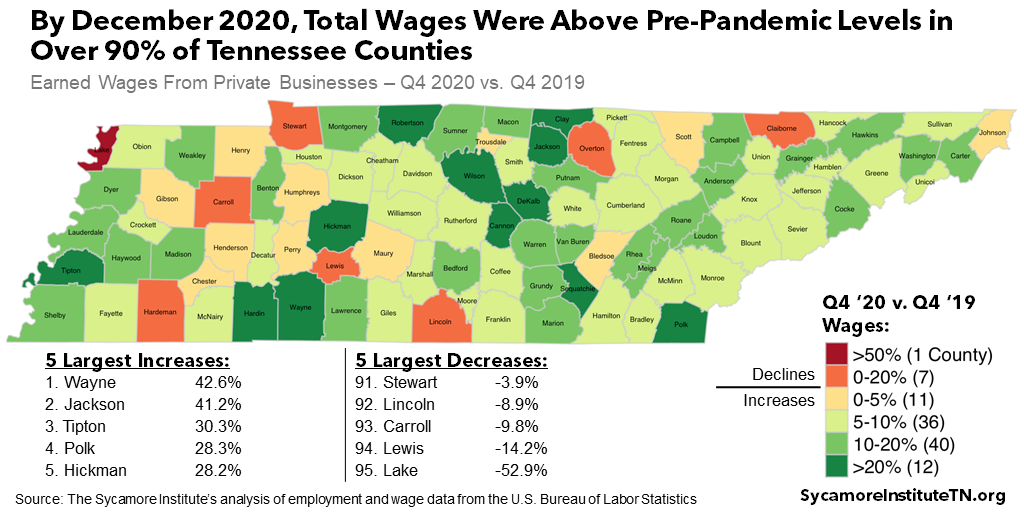
Job losses and business closures led to a brief drop in total wages in early-to-mid 2020 across much of Tennessee. Wages earned by Tennesseans working for private businesses fell almost 12% between the first and second quarters of 2020 but recovered to prior-year levels by Q3 (Figure 11). (34) By the fourth quarter, more than 90% of Tennessee counties saw year-over-year wage growth (Figure 12). The state’s average weekly wage grew as well, rising from just over $1,000 the first quarter of 2020 to nearly $1,200 by year’s end.
Tennessee’s wage losses were smaller and rebounded more quickly than those experienced nationally. In the early months of the pandemic, wages fell by a little over 16% nationally – compared to 12% in Tennessee. By the end of 2020, wages nationwide grew about 7% year-over-year versus a 9% increase in Tennessee.
Figure 13
Demographics of the Recession and Recovery
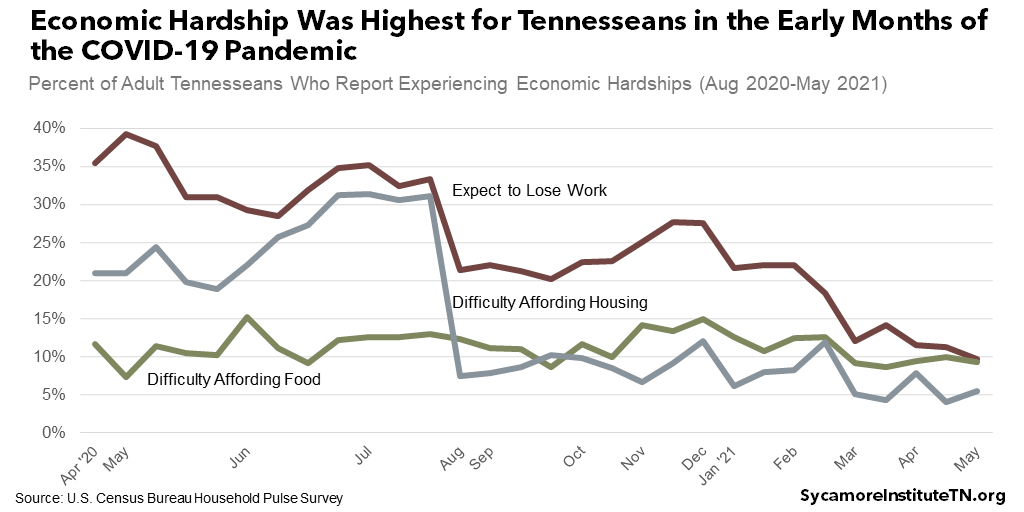
Many Tennesseans experienced economic hardship during the pandemic, although the numbers fell sharply after the initial months (Figure 13). (35) Nationwide, adults in higher-income households generally fared better than their middle- and low-income peers. (36) People reported their family’s financial situation improved during the pandemic in about 4 in 10 upper-income households compared to 1 in 3 middle-income families and 1 in 5 for low-income households. In addition, while personal savings rates rose among all households with disposable income during the pandemic, the highest rates of savings were concentrated among the most well-off. (37)
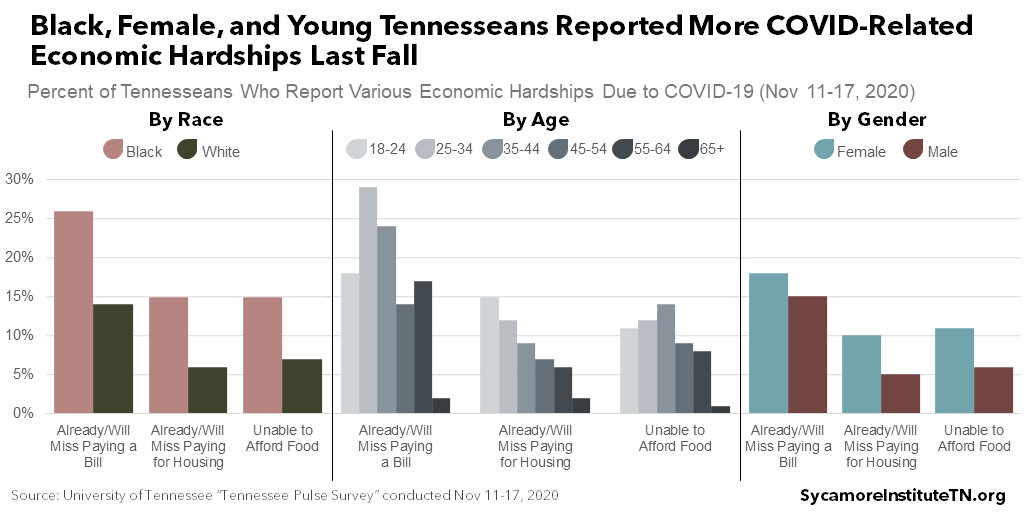
Black Tennesseans, younger adults, and women were more likely to report economic hardship last year, according to time-series data from the Tennessee Pulse Survey conducted by the University of Tennessee. (38) As of November, black Tennesseans were 5 percentage points more likely than whites to report having less money due to COVID-19 and about 10 points more likely to report trouble paying for bills, housing, and groceries (Figure 14). Similar gaps were present between men and women, with women reporting more financial distress due to the pandemic. More recent data are not available as data collection for the Tennessee Pulse Survey halted in late 2020.
Women have been especially vulnerable to the pandemic’s economic effects. (39) (40) While most recessions affect male employment more, women are more likely to work in the jobs and industries hit hardest by this pandemic. School and daycare closures compounded these effects since women are more likely to be the primary caregivers for children. Young people have also struggled during the pandemic, which tends to be the case during all economic downturns. (41) (42) Joining the labor market during economic downturns can also have long-term consequences for career and earnings potential. (43) (44)
Figure 14
Impact of Federal Aid
Over the last 15 months, six federal funding packages have spent trillions of dollars to stimulate the economy and replace lost revenues and incomes for business and families. Through mid-year 2021, for example, Tennessee businesses had received almost $6.8 billion – or about $39,500 per establishment – from the paycheck protection program (PPP), recovery grants, and other targeted aid (Figure 15). (45) (34) Meanwhile, unemployed Tennesseans received over $7.5 billion in state- and federally-funded unemployment benefits, and billions more went to Tennesseans from three separate rounds of direct recovery payments.
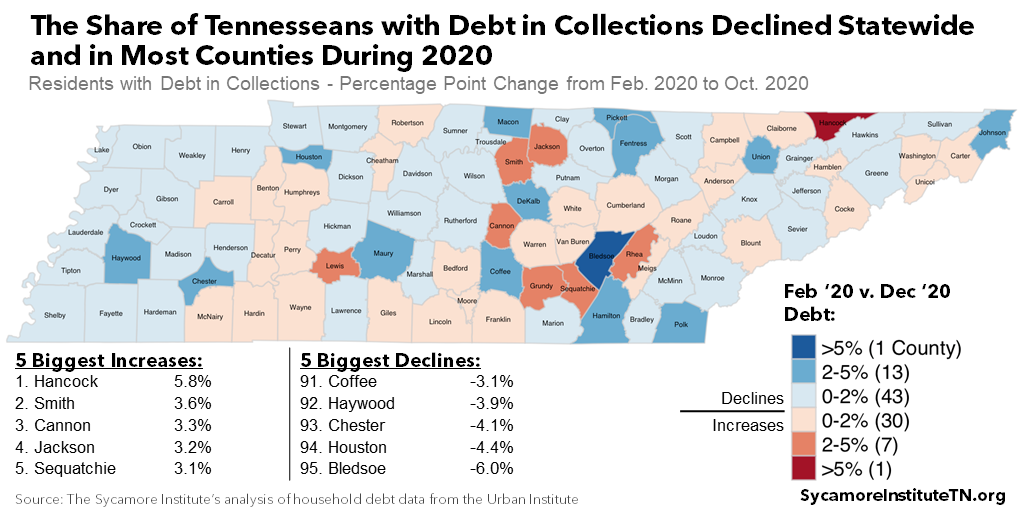
Available data suggest that these efforts have helped to keep both the economy and many Tennessee families afloat. Consumer spending remained strong throughout the pandemic (Figure 16), and the state’s budget has benefited from stronger-than-expected revenues. The share of Tennesseans with past due debt in 2020 also declined statewide and in most counties (Figure 17). (46) (47)
Figure 15
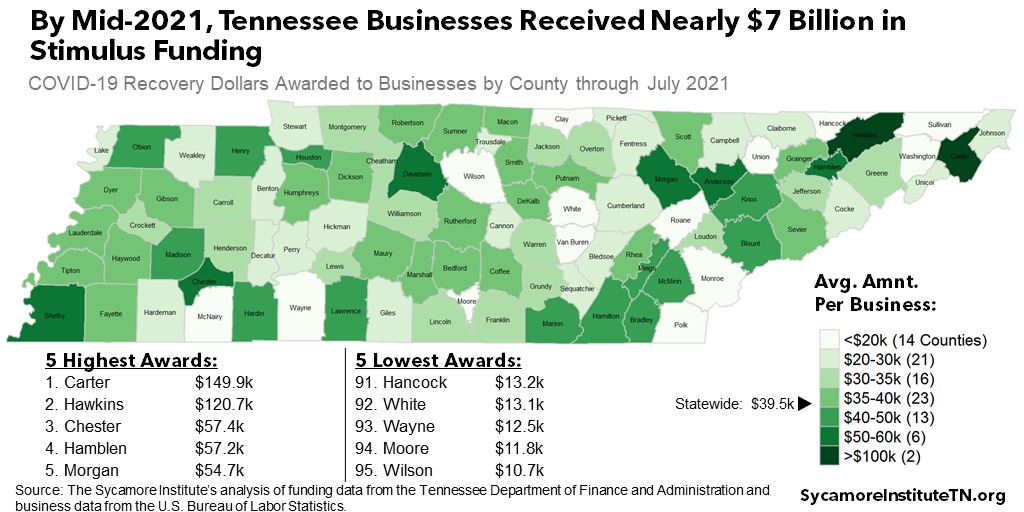
Figure 16
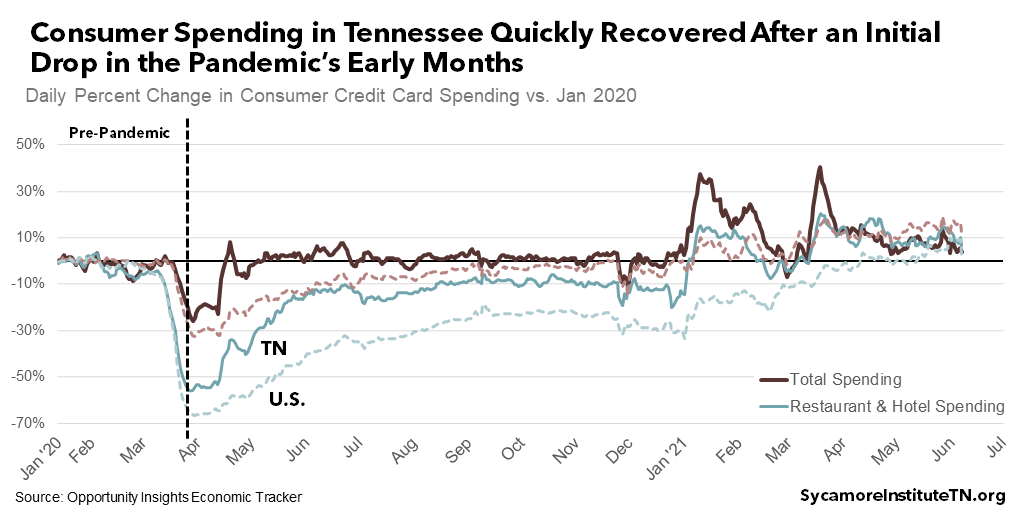
Figure 17
Possibility of Another COVID-19 Surge
The continued threat of one or more sustained spikes in COVID-19 cases could stall or even reverse many of the economic gains noted above. New, more contagious variants of the SARS-CoV-2 virus are spreading rapidly throughout the United States and Tennessee. (49) (50) While the available data suggest fully vaccinated individuals face much less risk from these new variants, by late July just 39% of Tennesseans had been fully vaccinated. (51) This ranged from a low of just over 16% in Moore County to a high of 50% in Williamson County (Figure 18). (52) Future waves of COVID-19 are not expected to spread as widely as in 2020, but communities with low vaccination rates remain especially susceptible. Any additional outbreaks that do occur could prolong the pandemic’s negative economic effects.
Figure 18

Parting Words
The economic effects of the COVID-19 pandemic were swift and painful for many Tennesseans. While many sectors of the state’s economy rebounded quickly to near pre-pandemic levels, the recovery has been uneven and left some businesses and people across the state less well-off. State and federal programs designed to help offset the negative economic effects of the pandemic appear to have been effective at helping to dampen losses. As the end of the pandemic hopefully draws nearer, we should remain alert to the risk of additional long-term economic damage as well as opportunities to promote greater economic resilience.
[i] The state unemployment rates used in this report are adjusted for seasonal changes in employment, while the county rates are not. Seasonal adjustment allows for comparisons between different months independent of predictable seasonal changes. (57) For example, retail employment typically increases around the holidays, and tourism during the summer months. Seasonally-adjusted rates, however, are only reported by the U.S. Bureau of Labor Statistics for states.
References
Click to Open/Close
- Chetty, Raj, et al. Real-Time Economics: A New Platform to Track the Impacts of COVID-19 on People, Businesses, and Communities Using Private Sector Data. Opportunity Insights. [Online] https://tracker.opportunityinsights.org/
- Bui, Quoctrung. Small Businesses Have Surged in Black Communities. Was It the Stimulus? The New York Times. [Online] May 24, 2021. https://www.nytimes.com/2021/05/24/upshot/stimulus-covid-startups-increase.html
- U.S. Bureau of Labor Statistics. Local Area Unemployment Statistics. U.S. Bureau of Labor Statistics. [Online] https://data.bls.gov/timeseries/LASST470000000000003
- Mazza, Sandy. Why Tennessee is Seeing Its Biggest Surge in New Businesses Launching. The Tennessean. [Online] June 2, 2021. https://www.tennessean.com/story/money/2021/06/03/tennessee-jobs-new-business-surge-record-covid-unemployment/7467633002/
- The Associated Press. Some Businesses Thrived, Many Lagged During the Pandemic in 2020. [Online] December 31, 2020. https://apnews.com/article/small-business-coronavirus-pandemic-a07fb9df7241b7c790a4efa799600710
- Ember, Sydney. How Do They Say Economic Recovery? ‘I Quit.’. The New York Times. [Online] June 20, 2021. https://www.nytimes.com/2021/06/20/business/economy/workers-quit-jobs.html
- Wade, Don. The Great Resignation: Workers Leave Old Jobs for New Priorities. The Daily Memphian. [Online] June 21, 2021. https://dailymemphian.com/subscriber/section/business/article/22585/great-resignation-workers-make-career-moves-as-country-comes-out-of-pandemic
- U.S. Bureau of Labor Statistics. Labor Force Statistics from the Current Population Survey. [Online] https://data.bls.gov/timeseries/LNS14000000
- —. Labor Force Data by County, Not Seasonally Adjusted, Latest 14 Months. U.S. Department of Labor. [Online] https://www.bls.gov/lau/
- U.S. Bureau of Labor Statistics (BLS). Percentage of Available Job Openings Left Unfilled by End of Month (U.S.). Job Openings and Labor Turnover Survey (JOLTS). [Online] https://data.bls.gov/timeseries/JTS000000000000000JOR
- U.S. Bureau of Labor Statistics. JOLTS Experimental State Estimates. Job Openings and Labor Turnover Survey (JOLTS). [Online] https://www.bls.gov/jlt/jlt_statedata.htm
- National Federation of Independent Businesses. Labor Market Challenges Continue for Small Businesses. [Online] July 2021. [Cited: July 19, 2021.] https://assets.nfib.com/nfibcom/2021-June-Jobs-Report.pdf
- Rosenberg, Eli. ‘The Final Straw:’ How the Pandemic Pushed Restaurant Workers Over the Edge. The Washington Post. [Online] May 24, 2021. https://www.washingtonpost.com/business/2021/05/24/restaurant-workers-shortage-pay/
- U.S. Bureau of Labor Statistics (BLS). Labor Force Participation Rate – Seasonally Adjusted (LASST470000000000003). [Online] 2021. [Cited: July 19, 2021.] Accessed via https://data.bls.gov/pdq/SurveyOutputServlet
- U.S. Bureau of Labor Statistics. Percentage of Available Job Openings Left Unfilled by End of Month (U.S.). Job Openings and Labor Turnover Survey (JOLTS). [Online] https://data.bls.gov/timeseries/JTS000000000000000JOR
- —. JOLTS Experimental State Estimates. Job Openings and Labor Turnover Survey (JOLTS) Through March 2021. [Online] https://www.bls.gov/jlt/jlt_statedata.htm
- U.S. Department of Labor. Unemployment Insurance Weekly Claims Data. [Online] [Cited: July 19, 2021.] https://oui.doleta.gov/unemploy/claims.asp
- Creswell, Julie and Eavis, Peter. Returning to the Office Sparks Anxiety and Dread for Some. The New York Times. [Online] April 2, 2021. https://www.nytimes.com/2021/04/02/business/office-remote-work-anxiety.html
- Orrell, Brent and Cox, Daniel A. The Great American Jobs Reshuffle. American Enterprise Institute and Survey Center on American Life. [Online] July 2021. https://www.aei.org/wp-content/uploads/2021/07/The-Great-American-Jobs-Reshuffle.pdf?x91208
- U.S. Bureau of Labor Statistics. Monthly Labor Review: Employment Recovery in the Wake of the COVID-19 Pandemic. [Online] December 2020. https://www.bls.gov/opub/mlr/2020/article/employment-recovery.htm
- Tennessee Office of the Governor. Governor Lee Pushes Return to Work, Economic Recovery. [Online] May 11, 2021. https://www.tn.gov/governor/news/2021/5/11/gov–lee-pushes-return-to-work–economic-recovery.html
- Petrosky-Nadeau, Nicolas and Valletta, Robert G. UI Generosity and Job Acceptance: Effects of the 2020 CARES Act. National Reserve Bank of San Francisco. [Online] June 2021. https://www.frbsf.org/economic-research/files/wp2021-13.pdf
- Farley, Robert. Is Unemployment Bonus Keeping Workers on Sideline? FactCheck.org. [Online] June 1, 2021. https://www.factcheck.org/2021/06/is-unemployment-bonus-keeping-workers-on-sideline/
- Bauer, Lauren, et al. Examining the Uneven and Hard-to-Predict Labor Market Recovery. Brookings. [Online] June 3, 2021. https://www.brookings.edu/blog/up-front/2021/06/03/examining-the-uneven-and-hard-to-predict-labor-market-recovery/
- Kochhar, Rakesh and Bennett, Jesse. U.S. Labor Market Inches Back from the COVID-19 Shock, But Recovery Is Far From Complete. Pew Research Center. [Online] April 14, 2021. https://www.pewresearch.org/fact-tank/2021/04/14/u-s-labor-market-inches-back-from-the-covid-19-shock-but-recovery-is-far-from-complete/
- Bachman, Daniel. Will They, or Won’t They Return? Addressing the Postpandemic Labor Force Deficit. Deloitte. [Online] May 2021. https://www2.deloitte.com/us/en/insights/economy/spotlight/economics-insights-analysis-05-2021.html
- Tyson, Laura and Lund, Susan. How COVID-19 Will Change the Low-Wage Labor Market Permanently. Los Angeles Times and McKinsey Global Institute. [Online] March 18, 2021. https://www.mckinsey.com/mgi/overview/in-the-news/how-covid-19-will-change-the-low-wage-labor-market-permanently
- Mutikani, Lucia and Saphir, Ann. With 8 Million Americans Out of Work, Why Are More Companies Not Filling Jobs? Reuters. [Online] May 6, 2021. https://www.reuters.com/business/whats-up-with-labor-market-probably-wont-know-until-fall-2021-05-06/
- U.S. Bureau of Labor Statistics. Quarterly Census of Employment and Wages by Establishment Size in Tennessee (Q1 2020). [Online] https://data.bls.gov/cew/apps/table_maker/v4/table_maker.htm#type=15&year=2020&size=1,2,3,4,5,6,7,8,9&st=47&agg=61&supp=0
- The Boyd Center for Business and Economic Research. The TN Quarterly: Business and Economic Indicators. The University of Tennessee. [Online] May 2021. https://sos-tn-gov-files.tnsosfiles.com/Quarterly_Indicators_May2021.pdf
- Hart, Jimmy W. Tenn. Business Barometer: Sunnier Outlook Soars Among State’s Business Leaders. Middle Tennessee State University Jennings A. Jones College of Business. [Online] April 20, 2021. https://mtsunews.com/tennessee-business-barometer-april2021/
- U.S. Bureau of Labor Statistitcs. Quarterly Census of Employment and Wages (2020). [Online] https://www.bls.gov/cew/downloadable-data-files.htm.
- U.S. Census Bureau. Household Pulse Survey. [Online] https://www.census.gov/data-tools/demo/hhp/#/?s_state=00047&measures=FJR
- Horowitz, Juliana Menasce, Brown, Anna and Minkin, Rachel. A Year Into the Pandemic, Long-Term Financial Impact Weighs Heavily on Many Americans. Pew Research Center. [Online] March 5, 2021. https://www.pewresearch.org/social-trends/2021/03/05/a-year-into-the-pandemic-long-term-financial-impact-weighs-heavily-on-many-americans/
- Babson, Rick. Study Shows Surge in Savings During the Pandemic. Federal Reserve Bank of Kansas City. [Online] April 29, 2021. https://www.kansascityfed.org/ten/2021-spring-ten-magazine/study-shows-surge-in-savings-during-the-pandemic/
- Murray, Matthew, Cahill, Katie and Daugherty, Linda. The Tennessee Pulse Survey (Wave 8). University of Tennessee Knoxville. [Online] November 17, 2020. http://core19.utk.edu/tn-pulse-wave-8
- Karageorge, Eleni X. COVID-19 Recession is Tougher on Women. U.S. Bureau of Labor Statistics Monthly Labor Review. [Online] September 2020. https://www.bls.gov/opub/mlr/2020/beyond-bls/covid-19-recession-is-tougher-on-women.htm
- Bateman, Nicole and Ross, Martha. Why Has COVID-19 Been Especially Harmful for Working Women. [Online] October 2020. https://www.brookings.edu/essay/why-has-covid-19-been-especially-harmful-for-working-women/
- Engemann, Kristie. Young Adults Cope with COVID-19’s Economic Impact. Federal Reserve Bank of St. Louis. [Online] March 3, 2021. https://www.stlouisfed.org/open-vault/2021/march/young-adults-cope-covid19-economic-impact
- Gould, Elise and Kassa, Melat. Young Workers Hit Hard by the COVID-19 Economy. Economic Policy Institute. [Online] October 14, 2020. https://www.epi.org/publication/young-workers-covid-recession/
- Brunner, Beatrice and Kuhn, Andreas. The Impact of Labor Market Entry Conditions on Initial Job Assignment and Wages. Journal of Population Economics. [Online] 27(3) 2014. https://link.springer.com/article/10.1007/s00148-013-0494-4
- Oreopoulos, Philip, von Wachter, Till and Hiesz, Andrew. The Short- and Long-Term Career Effects of Graduating in a Recession. American Economic Journal: Applied Economics. [Online] 4(1) 2012. https://www.aeaweb.org/articles?id=10.1257/app.4.1.1
- Tennessee Department of Finance & Administration. Stimulus Funding Related to COVID-19. State of Tennessee. [Online] https://www.tn.gov/content/tn/finance/looking-for/cares-act-awards-.html
- Braga, Breno, et al. Credit Health During the COVID-19 Pandemic Dataset. The Urban Institute. [Online] February 25, 2021. https://datacatalog.urban.org/dataset/credit-health-during-covid-19-pandemic
- Cooper, Cheryl R., Mullins, Maura and Weinstock, Lida R. COVID-19: Household Debt During the Pandemic. Congressional Research Service. [Online] October 22, 2020. https://fas.org/sgp/crs/misc/R46578.pdf
- Crane, Leland D., et al. Business Exit During the COVID-19 Pandemic: Non-Traditional Measures in Historical Context. Board of Governors of the Federal Reserve System. [Online] April 15, 2021. https://www.federalreserve.gov/econres/feds/business-exit-during-the-covid-19-pandemic.htm
- Lewis, Tanya. How Dangerous Is the Delta Variant, and Will It Cause a COVID Surge in the U.S.? Scientific American. [Online] June 29, 2021. https://www.scientificamerican.com/article/how-dangerous-is-the-delta-variant-and-will-it-cause-a-covid-surge-in-the-u-s/
- Kelman, Brett. COVID-19 Infections Triple as Tennessee Backs Off Vaccine Outreach. The Tennessean. [Online] July 14, 2021. https://www.tennessean.com/story/news/health/2021/07/15/tennessee-covid-19-infections-triple-vaccine-deaths-hospitalizations/7962418002/
- Tennessee Department of Health. Tennesssee COVID-19 Vaccination Reporting. [Online] https://www.tn.gov/health/cedep/ncov/covid-19-vaccine-information.html
- Centers for Disease Control and Prevention. COVID-19 Vaccinations in the United States, County. [Online] https://data.cdc.gov/Vaccinations/COVID-19-Vaccinations-in-the-United-States-County/8xkx-amqh
- U.S. Bureau of Labor Statistics. What Is Seasonal Adjustment? [Online] October 16, 2001. https://www.bls.gov/cps/seasfaq.htm#:~:text=These%20seasonal%20adjustments%20make%20it,news%20are%20seasonally%20adjusted%20data.