2017 Tennessee Health & Well-Being Index
The 2017 Tennessee Health & Well-Being Index measures the factors that contribute to the health of Tennesseans using the most recent data available at the time of publication.
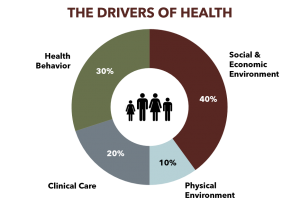 Scores are calculated using 24 metrics within 4 domains that represent the 4 drivers of health.
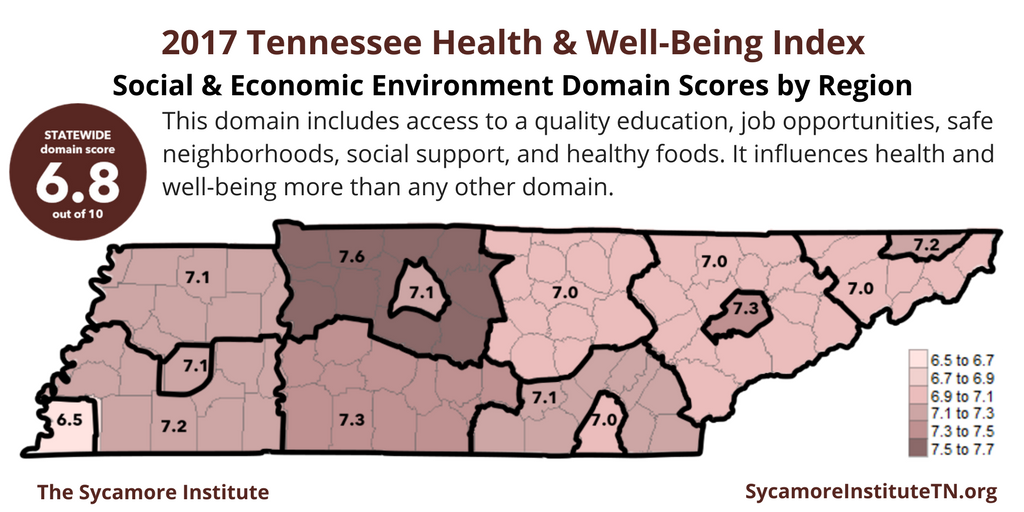
- Social & Economic Environment Domain (contributes 40% to a person’s health)
- Health Behavior Domain (contributes 30% to a person’s health)
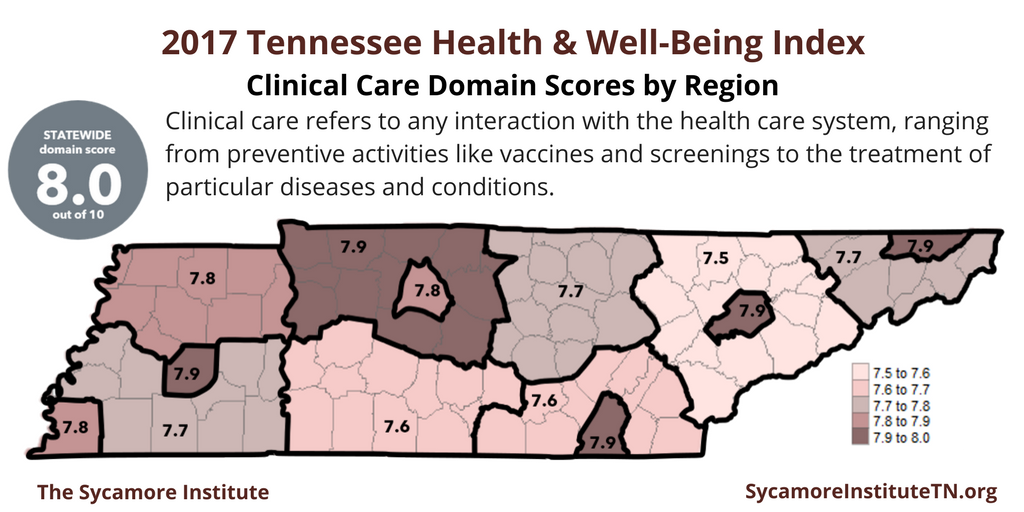
- Clinical Care Domain (contributes 20% to a person’s health)
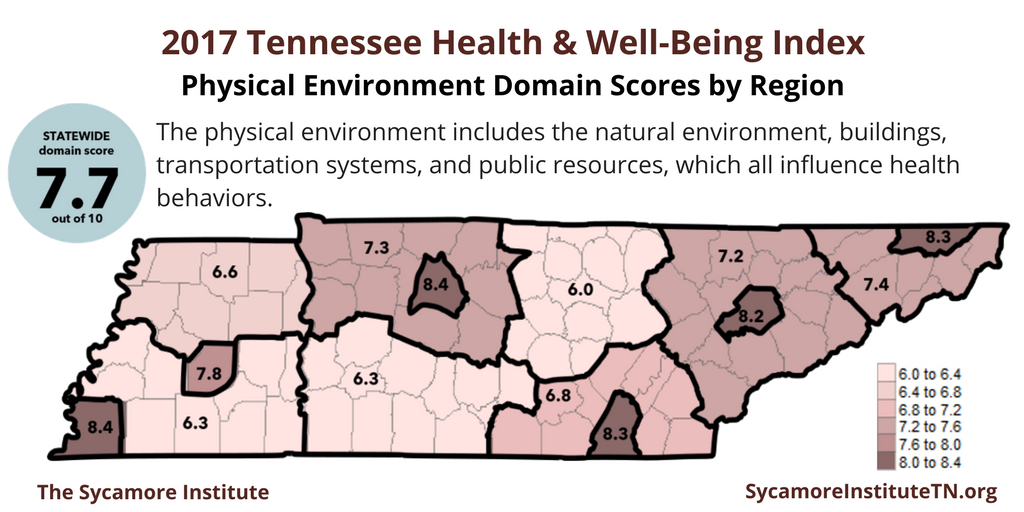
- Physical Environment Domain (contributes 10% to a person’s health)
Each metric is compiled using data that are publicly available at both the state and regional or county level. The 4 domain scores are then weighted based on their relative contributions to health.
See the Downloads section for more information about the components of each domain. More background on the Tennessee Health & Well-Being Index can also be found here.
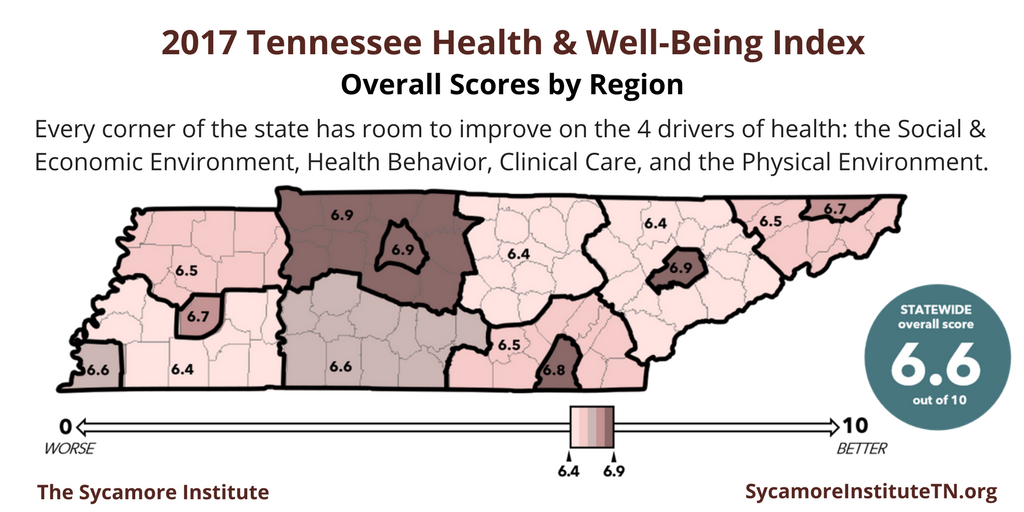
Statewide Scores
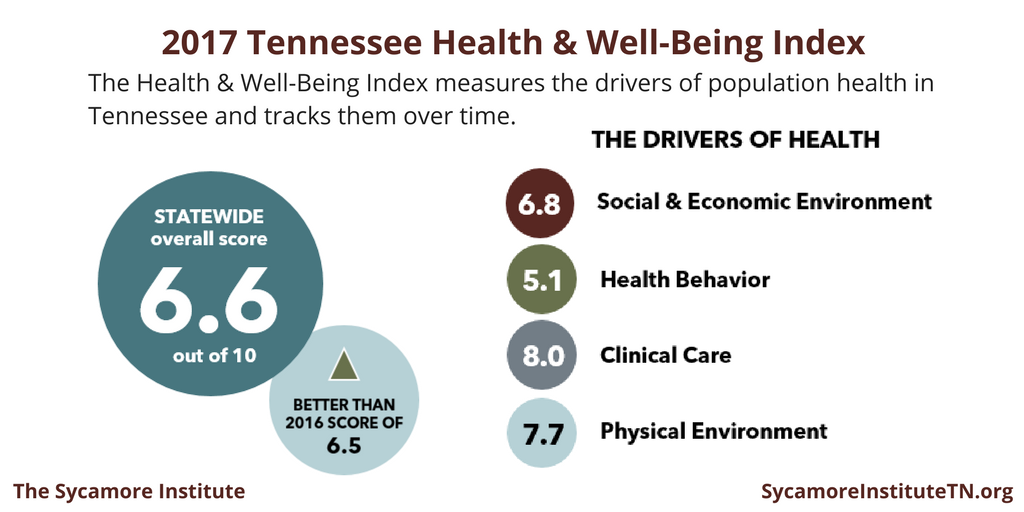
In 2017, Tennessee earned an overall statewide score of 6.6 out of 10. This was a slight improvement over the state’s 2016 score of 6.5.
In the 4 domains, this year the state as a whole scored:
- 6.8 – Social & Economic Environment Domain
- 5.1 – Health Behavior Domain
- 8.0 – Clinical Care Domain
- 7.7 – Physical Environment Domain
See the Downloads section for more detailed information about Tennessee’s performance in each domain.
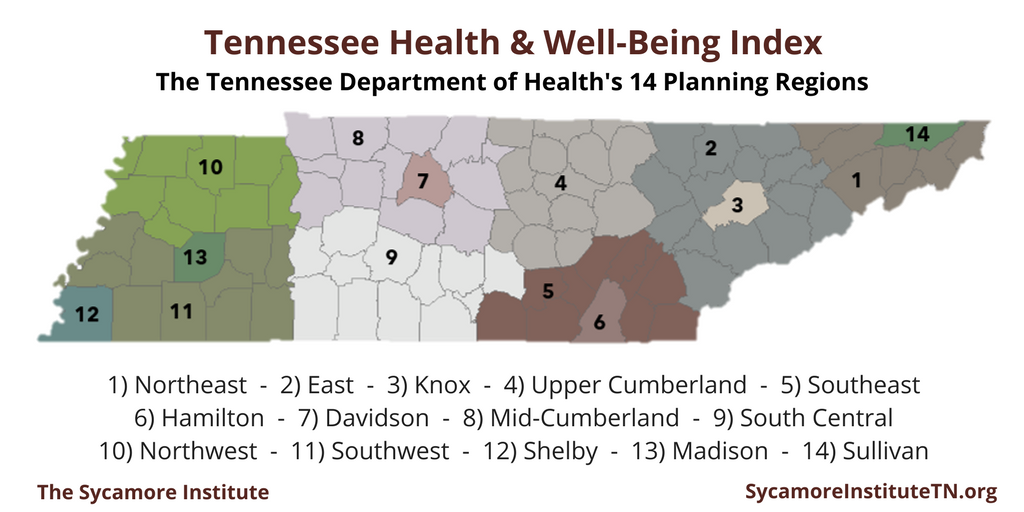
Regional Scores
The maps and table below show the Index scores for each of the Tennessee Department of Health’s 14 planning regions. Overall and specific domain scores are provided here. See the Downloads section for more detailed information about each region’s performance.

| Overall Rank | Overall Score | Region Name & Number | Social & Economic Score | Health Behavior Score | Clinical Care Score | Physical Environment Score |
|---|---|---|---|---|---|---|
| — | 6.6 | Tennessee | 6.8 | 5.1 | 8.0 | 7.7 |
| 1st | 6.9 | Knox (3) | 7.3 | 5.3 | 7.9 | 8.2 |
| 2nd | 6.9 | Davidson (7) | 7.1 | 5.5 | 7.8 | 8.4 |
| 3rd | 6.9 | Mid-Cumberland (8) | 7.6 | 5.1 | 7.9 | 7.3 |
| 4th | 6.8 | Hamilton (6) | 7.0 | 5.4 | 7.9 | 8.3 |
| 5th | 6.7 | Madison (13) | 7.1 | 5.1 | 7.9 | 7.8 |
| 6th | 6.7 | Sullivan (14) | 7.2 | 4.7 | 7.9 | 8.3 |
| 7th | 6.6 | South Central (9) | 7.3 | 5.0 | 7.6 | 6.3 |
| 8th | 6.6 | Shelby (12) | 6.5 | 5.4 | 7.8 | 8.4 |
| 9th | 6.5 | Northwest (10) | 7.1 | 4.9 | 7.8 | 6.6 |
| 10th | 6.5 | Northeast (1) | 7.0 | 4.8 | 7.7 | 7.4 |
| 11th | 6.5 | Southeast (5) | 7.1 | 4.7 | 7.6 | 6.8 |
| 12th | 6.4 | East (2) | 7.0 | 4.8 | 7.5 | 7.2 |
| 13th | 6.4 | Upper Cumberland (4) | 7.0 | 4.9 | 7.7 | 6.0 |
| 14th | 6.4 | Southwest (11) | 7.1 | 4.5 | 7.7 | 6.3 |
Downloads
Full Index, Statewide Snapshot & Methodology
Statewide Domain Scores
Regional Scores


