
Key Takeaways
- In FY 2019, Tennessee distributed $1.1 billion in federal funds to school districts across the state — or about 11% of total district revenues that year.
- Each of Tennessee’s 142 school districts received between $314 and $2,500 per student in federal funds — comprising 3% to 20% of each district’s total revenues.
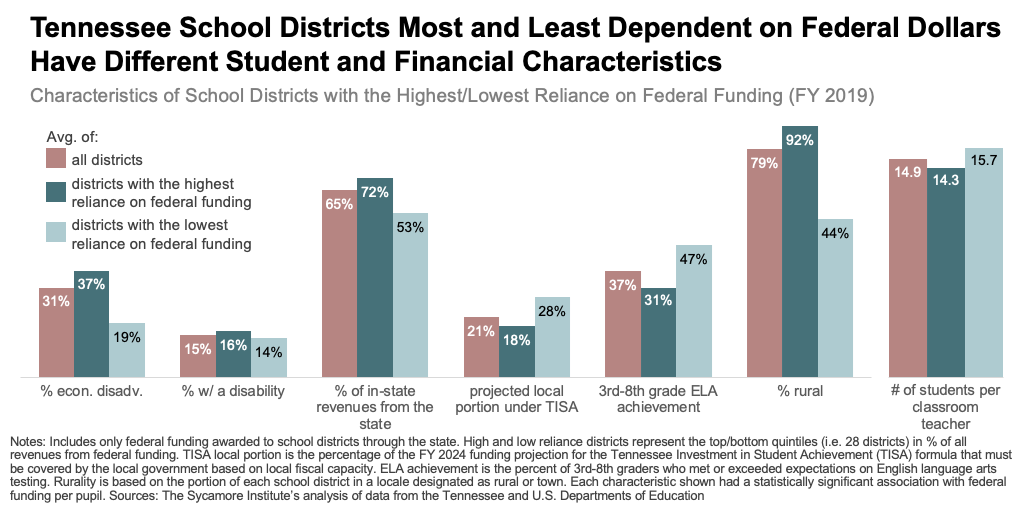
- The school districts most reliant on federal dollars tend to be more rural, have more low-income and disabled students, less capacity for local revenue, and lower ELA test scores.
This brief presents key findings from our analysis of federal funding data for each of Tennessee’s 142 local education agencies (LEAs). Our analysis used FY 2019 data — prior to the COVID-19 pandemic and related federal temporary COVID relief aid — to provide a more realistic picture of federal K-12 dollars in a typical year. Use the interactive dashboard at the end of this report to explore and compare federal funding for each school district. A follow-up brief will explore these funds’ purpose and the trade-offs they involve.
Key Findings
In FY 2019, Tennessee distributed over $1.1 billion in federal funds to school districts across the state — or about 11% of total district revenues that year (Figure 1). (1) Of those dollars, about 39% were for school nutrition programs, 27% for Title I programs targeted at low-income students, and 21% for the Individuals with Disabilities Education Act (IDEA). These numbers varied widely across Tennessee’s 142 school districts (Figure 2).
- Total Federal Funding: Each district received an average of $7.9 million in federal funding distributed by the state. This varied from $192.5 million for Shelby County schools to $311,000 for the Richard City Special School District in Marion County, which consists of one school.(1)
- Federal Funding Per Pupil: The total translated to about $1,230 per student across all districts, but this ranged from $2,540 for the Humboldt City School District in Gibson County to a low of $310 per pupil for the Williamson County District.(1) Per pupil funding for the three largest federal education programs varied as follows:
- Nutrition Funding Per Pupil: Districts received an average of $490 per student for school nutrition. The Morgan County District received about $1,200 per student for the program, while the Alamo City District in Crockett County reported no federal nutrition dollars.
- Title I Funding Per Pupil: Districts received an average of $310 per student for Title I. This varied from $990 for the Newport City District in Cocke County to $20 per pupil for the Williamson County District.
- IDEA Funding Per Pupil: Districts received an average of $270 per student for IDEA implementation — ranging from a high of $450 in Grundy County to a low of $15 in the Murfreesboro District in Rutherford County.
- Federal Reliance: Federal dollars provided 11% of school districts’ revenues. This varied from as much as 20% of revenues for the Humboldt City School District in Gibson County to as little as 2.7% for the Williamson County District.(1)
Figure 1
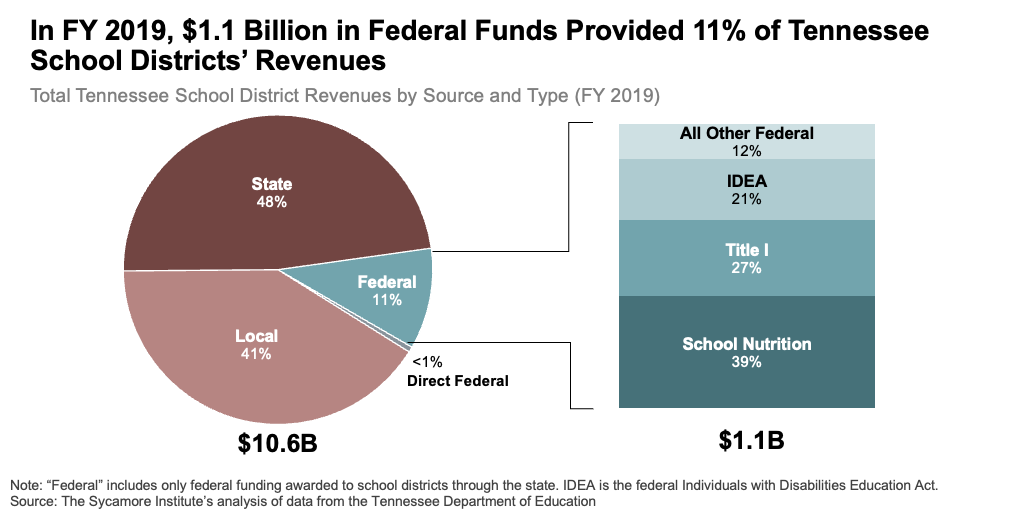
Figure 2
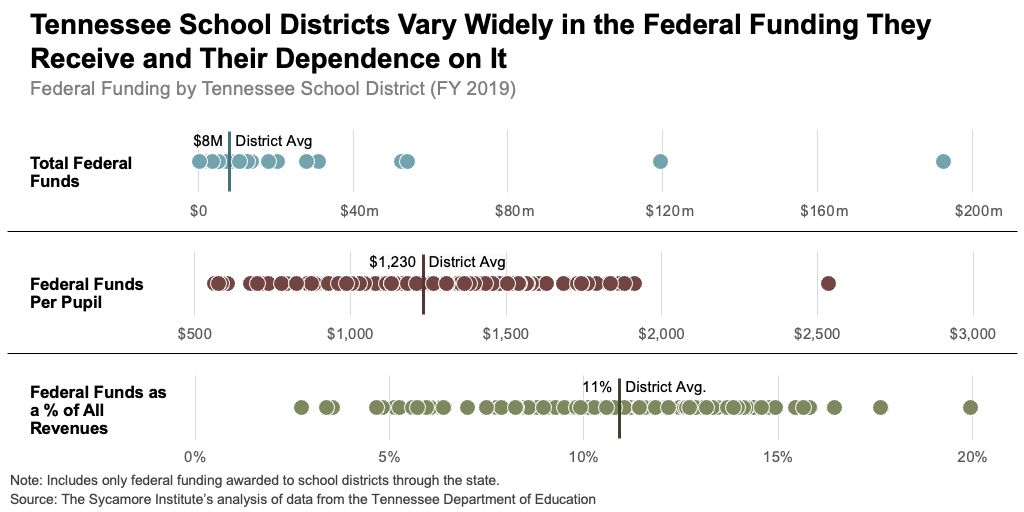
Figure 3
Trends
The school districts most reliant on federal dollars tend to be more rural, have more low-income and disabled students, less fiscal capacity for local revenue, and lower test scores (Figure 3). (1) (3) (4) (6) (5) We explored multiple district and student characteristics to understand if and how districts differ based on how much federal funding they receive and their reliance on those dollars (Appendix Table 1). Our findings are summarized below.
- Student Characteristics: School districts that receive the most federal funding per pupil and are more reliant on those dollars tend to have higher concentrations of economically disadvantaged students and students with disabilities (Figures 3, 4, and 5).(1) (3)
- Financial Characteristics: Districts that receive the most funds and are most reliant on federal funding have lower fiscal capacity, depend more on state dollars, and have lower local revenues per pupil (Figures 3, 4, and 6). For example, Tennessee’s new education funding formula — the Tennessee Investment in Student Achievement (TISA) — determines a required local share based on each county’s fiscal capacity (i.e., the ability to raise revenue to fund education). The average required local share is 17% for the 28 districts most reliant on federal funding based on FY 2024 TISA projections — compared with 28% for the 28 least reliant districts (Figure 3).(1) (4)
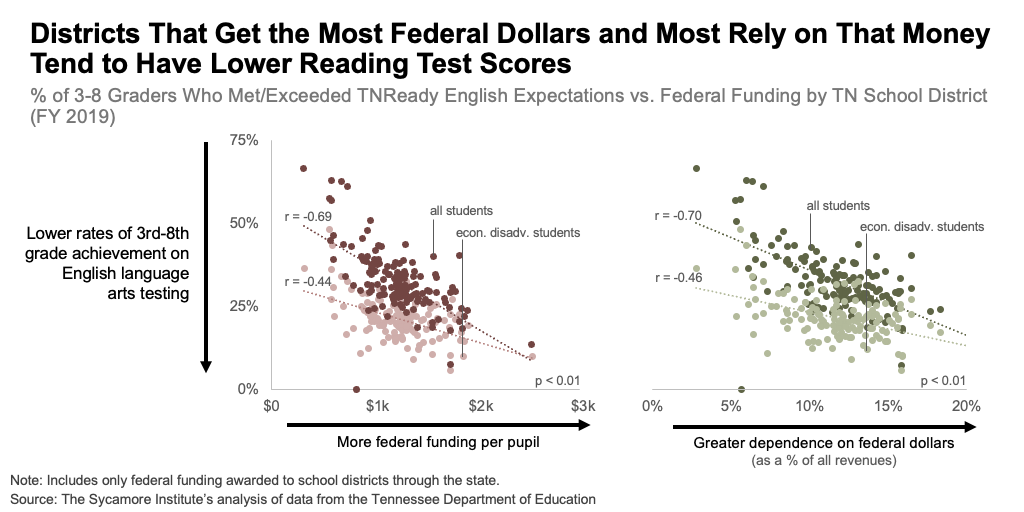
- Student Achievement: School districts that receive the most federal support tend to also have lower achievement rates on English language arts (ELA) testing among 3rd through 8th graders — both overall and among economically disadvantaged students (Figures 3, 4, and 7).(1) (6)
- Other District Characteristics: The most federally-dependent school districts tend to be smaller and more rural (Figure 3). Districts receiving the most federal funding also have slightly lower student-to-teacher ratios than districts receiving fewer federal dollars per pupil (Figures 3 and 4).(6) (5)
Federal funding and many of these characteristics are interrelated and even dependent upon one another. For example, districts with larger proportions of students with unique learning needs are likely to also have lower student-to-teacher ratios. Additionally, the three largest federal programs discussed above are largely distributed based on a district’s concentration of low-income students or those with disabilities. Similarly, economically disadvantaged students tend to perform worse on state testing, so districts with large concentrations of these students expect to receive more federal dollars and have lower overall test scores.
Figure 4
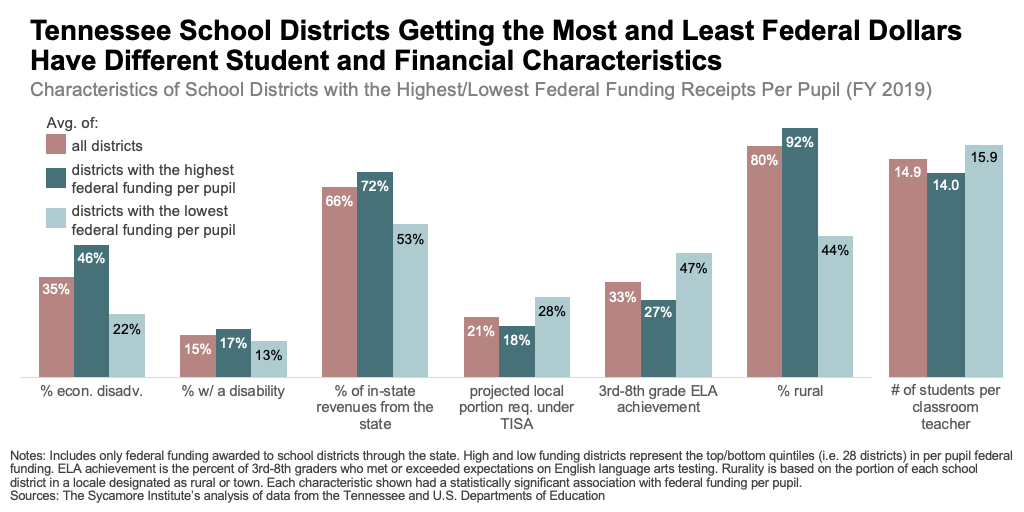
Figure 5
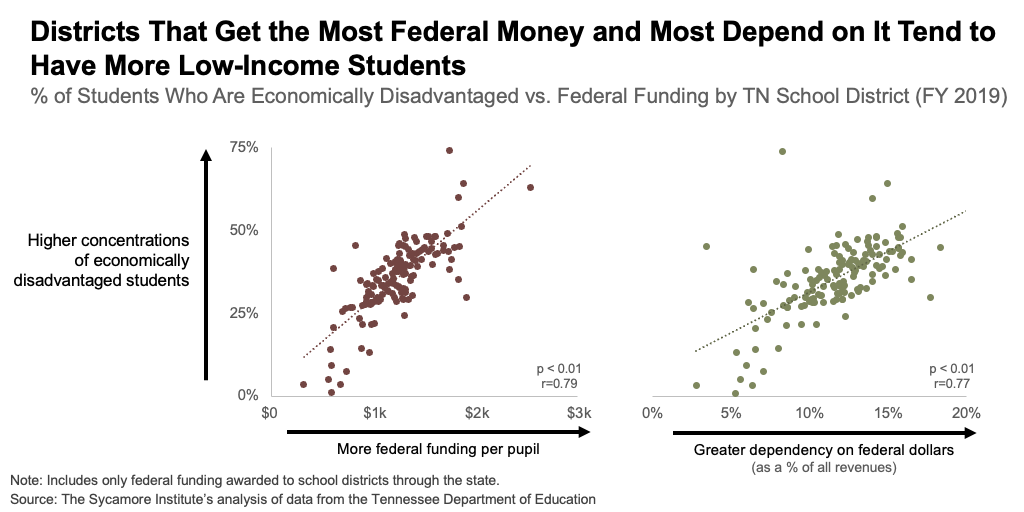
Figure 6
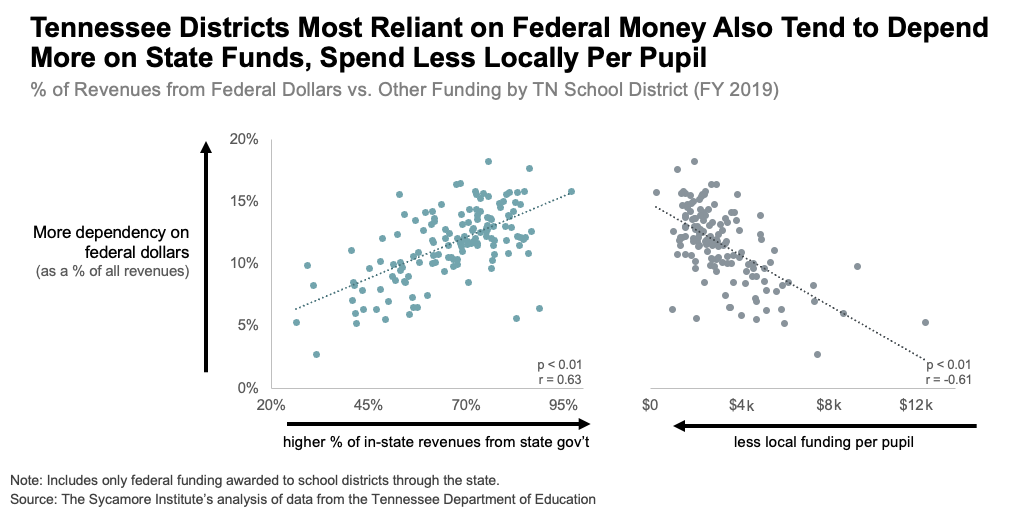
Figure 7
Explore the Data
Use the interactive dashboard below to explore each school district’s FY 2019 federal funding and compare per pupil funding for each federal program across all districts in the same fiscal year.
References
Click to Open/Close
- Tennessee Department of Education. 2019 Annual Statistical Report. 2020. https://www.tn.gov/education/districts/federal-programs-and-oversight/data/department-reports/2019-annual-statistical-report.html. https://www.cms.gov/Research-Statistics-Data-and-Systems/Statistics-Trends-and-Reports/Marketplace-Products/Plan_Selection_ZIP.html
- National Center for Education Statistics. Geocodes: Public Schools and Local Education Agencies. Education Demographic and Geographic Estimates (EDGE) Program. 2018. https://nces.ed.gov/programs/edge/docs/EDGE_GEOCODE_PUBLIC_FILEDOC.pdf
- Tennessee Department of Education. Profile & Demographic Information: 2019 District-Level Profile Data File. 2020. Accessed via https://www.tn.gov/education/districts/federal-programs-and-oversight/data/data-downloads.html.
- —. TISA Projections for FY 2023 and FY 2024. 2021. Obtained from the Department on March 31, 2021.
- National Center for Education Statistics. Locale Classifications. 2019. Data downloaded from https://nces.ed.gov/programs/edge/Geographic/SchoolLocations.
- Tennessee Department of Education. State Assessments: 2019 District-Level Accountability File. 2020. Accessed via https://www.tn.gov/education/districts/federal-programs-and-oversight/data/data-downloads.html.


