Key Takeaways
- TISA is unlikely to grow the statewide total for mandatory local spending over the next decade and – compared to the BEP – could require fewer district-level increases.
- Due to existing maintenance of effort rules, every district must already spend more from local revenues in FY 2024 than TISA alone requires.
- The amended proposal will keep the fiscal capacity formula used now, which is a 50:50 split of the TACIR and CBER models.
Gov. Bill Lee’s proposal to replace Tennessee’s current K-12 education funding formula (the BEP) with a new calculation (TISA) relies in part on prioritizing money for students with particular characteristics. Based on Sycamore’s independent analysis, this report explains how the new formula could affect what local governments are required to spend on public schools. You can also use our dashboard below to explore the state’s FY 2024 funding projections – the first year TISA would take effect – for each school district as of March 31, 2022. (1) (2)
TISA Requires Less Local Formula Funding than BEP
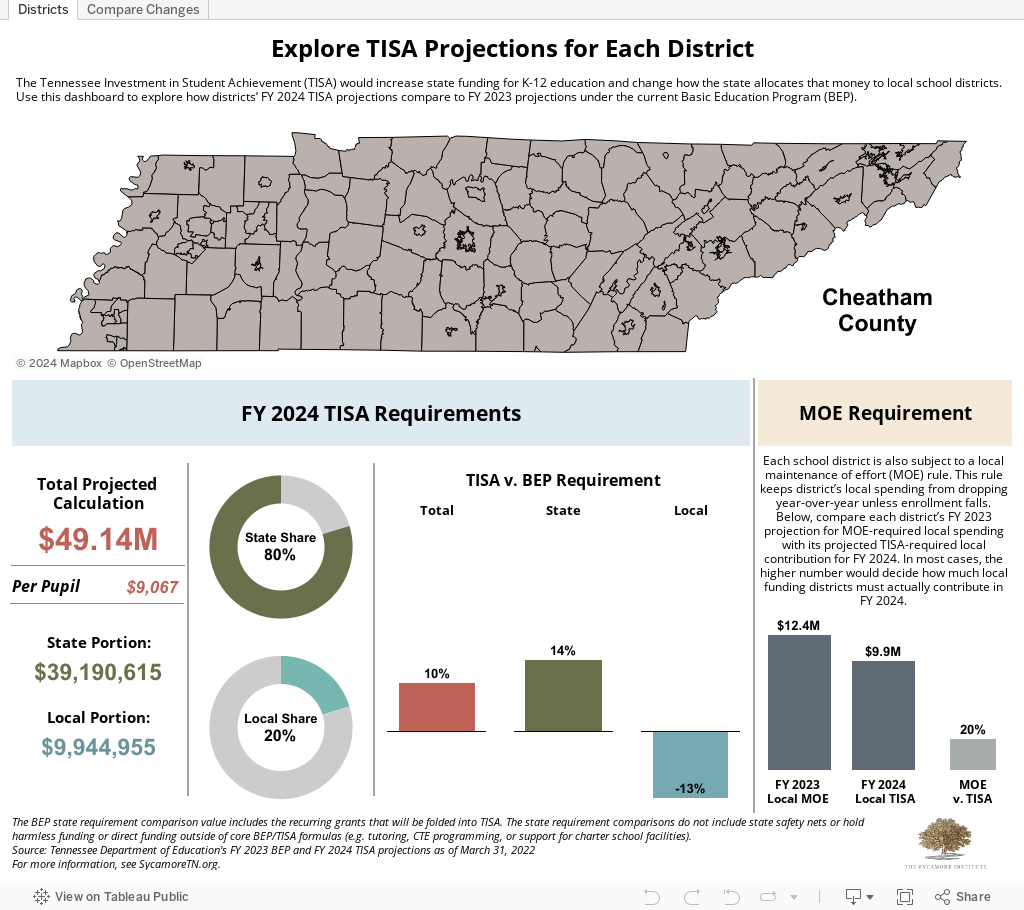
Under TISA, Tennessee’s Department of Education projects that all but five school districts would get more state funding in FY 2024 with no increase in mandatory local contributions. (1) On a statewide basis, the proposed new formula actually requires less local spending than the BEP does. However, each school district is also subject to a local maintenance of effort (MOE) rule.
Maintenance of Effort Requires More Local Funding than TISA
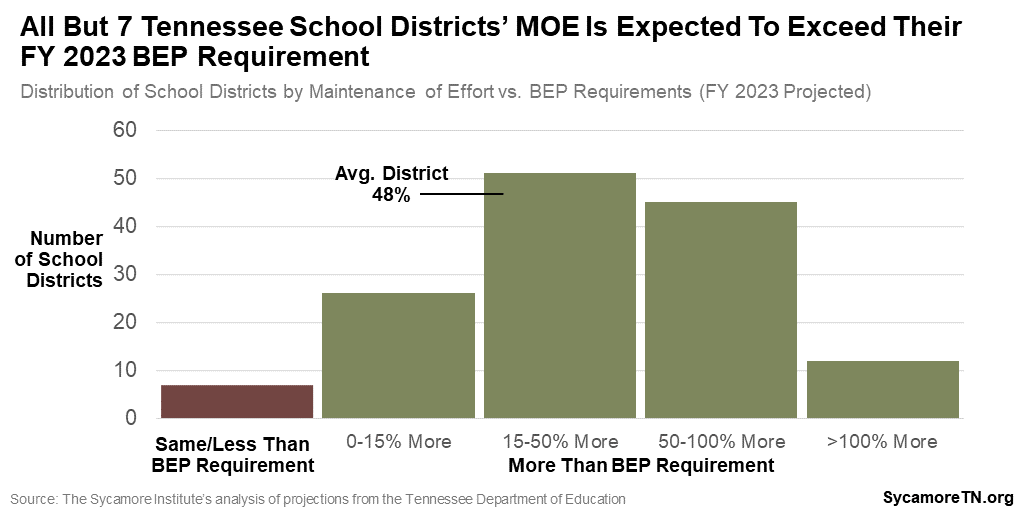
Due to existing maintenance of effort rules, every district must already spend more from local revenues in FY 2024 than the TISA formula would require. All but seven districts already spend more than the projected BEP requirement for FY 2023 due to MOE rules, which largely prevent districts from reducing local education funding from one year to the next (see text box). (3) Because TISA decreases most districts’ formula-required local funding, the estimated FY 2023 MOE is higher for every district than their projected FY 2024 TISA requirement.
About Local Maintenance of Efforts Requirements
Each school district must meet a local maintenance of effort requirement to receive their allocation of state BEP dollars – a rule that would remain under TISA. The BEP calculates a minimum amount that each school district must contribute from local revenues. That minimum is trumped by the MOE, which largely prevents districts from reducing what they spend from one year to the next – even if they spent more than the BEP required. In fact, nearly all school districts contribute more than their BEP minimum. According to projections for FY 2023, for example, all but seven districts’ MOE (i.e. roughly, their prior year’s spending) will exceed their BEP requirement (Figure 1).
The maintenance of effort rule helps ensure that increased state spending on education translates to increased total investments in K-12. On their own, the BEP rules would let districts that spend more than their BEP calculation to cut local funds when state dollars increase and still maintain overall K-12 spending. Without the MOE requirement, growth in state education funding could supplant local dollars instead of boosting overall investment. (9) For the same reason, many other federal and state programs have similar maintenance of effort requirements (e.g. state highway funds, federal education dollars, the federal substance abuse and mental health block grants). (10)
Figure 1
Putting It All Together
TISA is unlikely to grow the statewide total for mandatory local spending over the next decade and – compared to the BEP – could require fewer district-level increases. Sycamore used the state’s FY 2023 BEP and FY 2024 TISA estimates to project statewide and district-specific local education funding requirements under three different growth rates for per-pupil funding. See below for important limitations and assumptions associated with our projections. We found:
- Total Local Contribution Requirements: The BEP would consistently require more from local governments than TISA would (Figure 2). Over the last decade, Tennessee lawmakers have increased per-pupil spending under the BEP by 3.9% per year, on average. (4) (5) Even if state legislators maintained that rate of annual increase, the statewide total for TISA-required local spending would not catch up with estimated maintenance of effort requirements until sometime after FY 2035. The BEP would cross that line several years earlier.
- Individual Districts’ Required Contributions: TISA could require fewer school districts to increase local funding than the BEP will (Figure 3). Depending on if and how quickly lawmakers decide to increase state funding, most school districts would not feel any impact from TISA on their required local spending for at least a decade. The BEP would require more districts to exceed their current levels of MOE-mandated local spending more quickly.
Figure 2
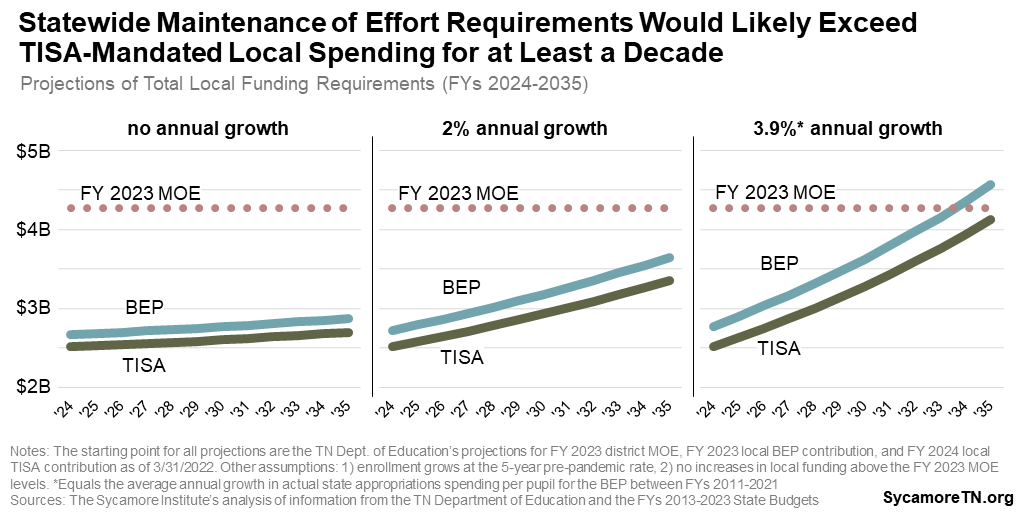
Figure 3
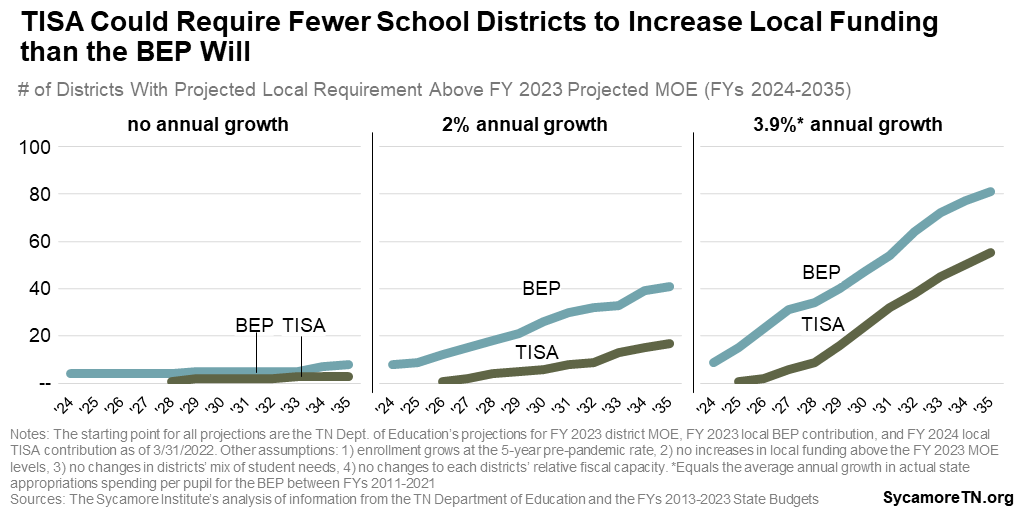
These projections depend on several assumptions and thus involve significant uncertainty. First, we assume that districts’ 5-year pre-pandemic enrollment trends continue through 2035. We also assume no changes in 1) the mix of student needs within each district, 2) each district’s relative fiscal capacity compared to all others’, or 3) districts’ MOE requirements. Our three per-pupil growth scenarios assume, respectively: 1) no annual growth in state spending per pupil for each formula, 2) standard inflationary growth of 2% per pupil, and 3) continuation of the per-pupil rate at which state appropriations spending for the BEP grew between FYs 2011-2021. (4) (5) Our analysis does not account for direct funding outside of core formulas (e.g. tutoring, CTE programming, support for charter school facilities). See the methods section at the end for additional information.
TISA’s Changes to Tennessee School Finance Fundamentals
Like the BEP, TISA answers three central questions that each contribute to the outcomes projected above:
- Total Size of the Pie: What does it cost to provide an “adequate” education to every child in Tennessee?
- Total State/Local Split: How much of that total cost does the state cover, and how much do locals cover?
- District-Specific Split: How much does each specific district receive from the state?
Here’s how TISA proposes answering these questions:
How TISA Changes the Total Size of the Pie
TISA would shift Tennessee’s approach to the first question from a resource-based response to a student-based answer that changes with the mix of student needs. The BEP is a resource-based formula that calculates costs largely based on total enrollment in each district. TISA would be a student-based formula that generates nearly $1 billion more than the BEP does today. It includes base funding per pupil plus additional money for students with specific characteristics or needs. (See this report to explore how those characteristics vary by school district.) Both TISA and the BEP largely handle things like career and technical education, tutoring, early literacy, and charter school facility costs outside the core formula. (6)
How TISA Changes the Total State/Local Split
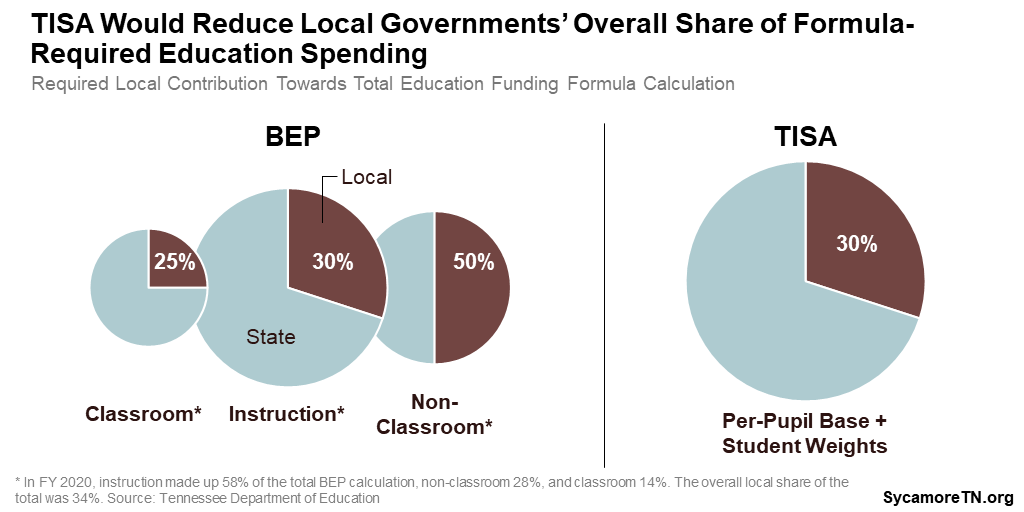
TISA proposes reducing the overall share that locals must cover – the answer to the second question. On an aggregate level, the BEP’s statutory requirements involve the state covering roughly 66% of the BEP calculation and locals the remaining 34%. Under TISA, the overall split would change to 70% state and 30% local (Figure 4).
Figure 4
How TISA Changes (or Doesn’t) the District-Specific Split
Like the BEP, TISA would use a blended fiscal capacity calculation to determine what percentage of the aggregate local share each district pays. While the original TISA legislation proposed to use one model (CBER) to determine fiscal capacity, the latest version of the bill would keep the blended model currently in use (TACIR + CBER).
TISA does not change existing maintenance of effort requirements. Local governments have consistently invested more in education than the BEP requires. Under long-standing MOE requirements, school districts are not allowed to reduce their contributions to education when state funds for education increase (See text box). (9)
How Do TISA’s Changes Affect Local Funding Requirements?
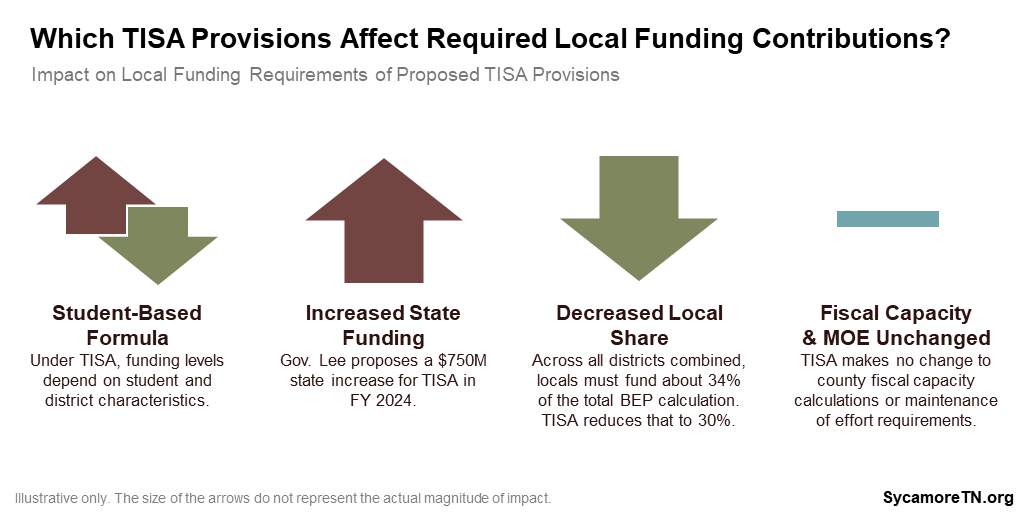
Each of the proposed changes above affect local funding requirements (Figure 5). Ultimately, TISA’s proposed reduction to the aggregate local share more than offsets the impact of the other relevant changes. Here are those changes:
- Decreased Local Share: TISA proposes reducing the aggregate local share for all districts in the state combined from roughly 34% to 30%. (8) (9) (2) Absent any other changes, this would decrease school districts’ formula-required local funding levels.
- Student-Based Formula: TISA’s shift to a student-based funding approach means the cost of an adequate education for every child in a district will depend on the specific characteristics of that district’s students. Holding all else constant, this change would mandate higher funding for districts that have students with greater needs – pushing up local contributions towards those costs. Districts that have students with fewer needs could see the opposite effect.
- Increased State Funding: TISA includes an additional $750 million in state funding than the proposed BEP levels for FY 2023. (5) If no other changes were made, this increase would drive up the amount local governments must spend because locals have to match state spending at a specific ratio.
- Fiscal Capacity & MOE Unchanged: Since TISA makes no change to existing fiscal capacity calculations or maintenance of effort requirements, these elements will not drive any increase or decrease in local funding requirements. (2)
Figure 5
Our Method
We projected potential local requirements for each school district under the BEP and TISA out to FY 2035 using the following starting points and assumptions.
Starting Point
The starting point for each district’s projection was based on FY 2023 and FY 2024 projections made by the Tennessee Department of Education (TDOE) and provided at our request on March 31, 2022. (1)
- For the BEP projections, we began with TDOE’s FY 2023 estimated local BEP requirement for each district, which include the impact of funding increases proposed as part of the governor’s FY 2023 budget. These numbers also include discretionary grants for coordinated school health, family resource centers, and school safety that have traditionally been outside of the BEP but are proposed to be folded into TISA. We were unable to back these numbers out of each district’s estimate, but in total, these grants account for less than 1% of the total proposed state appropriations for the BEP.
- For the TISA projections, we began with TDOE’s FY 2024 estimated local TISA requirement for each district.
- For the maintenance of effort requirement, we used TDOE’s FY 2023 estimated MOE for each district.
- For projected enrollment changes, we used TDOE’s calculation of the 5-year pre-pandemic enrollment trend for each district.
Calculations and Assumptions
We used three different growth scenarios to calculate projections for each school district. Any decisions about increases in funding under the formula would be at the discretion of the Tennessee General Assembly.
- Scenario 1 reflects no growth in per-pupil funding.
- Scenario 2 reflects per-pupil funding growth of 2%, a common benchmark for typical inflation.
- Scenario 3 uses 3.9% growth in per-pupil funding, which reflects the average annual growth in state BEP spending (as reflected in the budget document) per pupil between FYs 2011-2021. (4) (5)
For each district and scenario, we applied the annual pre-pandemic enrollment trend and growth rate to the starting points listed above. For example, we took the following steps to calculate the FY 2025 local TISA requirement for a district under the 2% growth scenario. First, we adjusted the projected FY 2024 TISA local requirement based on the district’s average annual pre-pandemic enrollment trend. Then, we multiplied that figure by the 2% inflationary increase (Table 1). For our statewide totals, we added all districts’ projections together. To estimate whether districts would be subject to a higher local requirement, we compared our projections with TDOE’s FY 2023 estimated MOE for each district.
Table 1. Example of How We Calculated Our Projections
| Starting Point | Enrollment Changes | Funding Changes | Projection |
| TDOE’s FY 2024 estimate | x (1 + enrollment trend) | x (1 + 2%) | = FY 2025 estimate |
| FY 2025 estimate | x (1 + enrollment trend) | x (1 + 2%) | = FY 2026 estimate |
| FY 2026 estimate | x (1 + enrollment trend) | x (1 + 2%) | = FY 2027 estimate |
|
… |
|||
| FY 2034 estimate | x (1 + enrollment trend) | x (1 + 2%) | = FY 2035 estimate |
These projections depend on several assumptions and thus involve significant uncertainty. We assume that during the entirety of our projection window, districts experience no changes in:
- Annual enrollment trends.
- The mix of student needs, as weighted under the TISA formula.
- Each district’s relative fiscal capacity compared to all others’.
- MOE requirements.
References
Click to Open/Close
- Tennessee Department of Education. TISA Projections for FY 2023 and FY 2024. Obtained from the Department on March 31, 2021.
- Senator Jon Lundberg . Amendment No. 1 to SB2396. Tennessee General Assembly. Accessed on March 31, 2022 from https://www.capitol.tn.gov/Bills/112/Amend/SA0769.pdf.
- State of Tennessee. Tenn. Code Ann. § 49-3-314(c). 2022.
- Tennessee Department of Education. Average Daily Membership for 2011-2021. Annual Statistical Report for 2011-2021. Accessed from https://www.tn.gov/education/data/department-reports/2021-annual-statistical-report.html.
- State of Tennessee. State Budget for FYs 2013-2023. Accessed from https://www.tn.gov/finance/fa/fa-budget-information/fa-budget-archive.html.
- Tennessee Department of Education. Funding for Student Success: Direct Funding. 2022. Accessed on March 25, 2022 from https://fundingforstudentsuccess.org/wp-content/uploads/2022/02/Direct-Funding.pdf.
- Tennessee Comptroller of the Treasury. FY 2020 BEP Calculator. Accessed from https://comptroller.tn.gov/office-functions/research-and-education-accountability/interactive-tools/bep.html.
- Tennessee Department of Education. Basic Education Program: Computation Handbook. September 2018. https://www.tn.gov/content/dam/tn/stateboardofeducation/documents/bepcommitteeactivities/2019-bep/BEPHandbook%20revised%20September%202018.pdf.
- Wesson, Linda and Bergfeld, Tara. Understanding Tennessee’s Maintenance of Effort in Education Laws . Tennessee Comptroller of the Treasury Office of Research and Education Accountability. September 2015. https://comptroller.tn.gov/content/dam/cot/orea/advanced-search/2015/2015_OREA_MaintofEffort.pdf.
- County Technical Assistance Service. Maintenance of Effort . University of Tennessee. Accessed on April 3, 2022 from https://www.ctas.tennessee.edu/node/722.