Criminal fees, fines, and other financial obligations serve as both punishment and a source of funding for the criminal justice system. Many policymakers, however, may not fully appreciate the extent of their use and the trade-offs they entail. This report begins to quantify for the first time how Tennessee’s state and local governments use criminal fees and fines to raise revenue.
A prior report explains the fees and fines people can incur through Tennessee’s criminal justice system and how they affect everyone from the accused, convicted, and incarcerated to victims, law enforcement, and the courts. Future work will look at options for policymakers who want to consider alternatives or address any unintended consequences.
Key Takeaways
- Fees and fines collected by the Dept. of Revenue are a relatively small and shrinking part of the state budget ($37.9 million in 2019). Other agencies’ collections are not public.
- In recent years, Tennessee’s county governments collected about $180 million in annual fee and fine revenues. That may be as little as one quarter of the amount they assessed.
- Despite wide variation, fees and fines are generally small and shrinking compared to other county revenues. On average they pay for about 15% of local spending on criminal justice.
- Our analysis suggests that differences in fees and fines may have more to do with local decisions and policies than with more easily-measured factors like crime or demographics.
Overview
Fees and fines help pay for many essential functions of the criminal justice system, but they can have unwanted side effects. As our previous report explains, they may incentivize governments to focus on law enforcement activities that raise revenue – and that revenue is not always reliable. (1) For people who have trouble paying, meanwhile, fees and fines can prolong their involvement in the criminal justice system and make it harder to get ahead.
Tracking Fees & Fines
In Tennessee, complex allocation formulas, decentralized collection, and insufficient data make it hard to track how this money is used. (2) State law authorizes over 360 fees, fines, taxes, and other legal financial obligations (LFOs), which various authorities within the criminal justice system collect. Since defendants can accumulate numerous LFOs in any given case that each have specific collectors, recipients, and purposes, it is difficult to track who gets the revenue and how they spend it.
Fees & Fines in State & County Budgets
Total state and county LFO revenues in Tennessee may have fallen over the last 12 years, based on the available data. (3) (4) However, a full picture of state revenue is not available. There were also large variations across the state, as some counties collected much more during FYs 2017-2019 and others much less than a decade prior.[i] Nationally, research suggests that state and local governments’ reliance on fees and fines grew significantly in the 1970s, ‘80s, and ‘90s. (5) (6) Due to the limited data available, it is not clear if those trends held true in Tennessee.
The most recent county court data available suggest that fees and fines may not always be a reliable source of revenue. In FY 2012, Tennessee’s criminal courts only collected about a fourth of all fees and fines that people owed. Nine counties recouped less than 20%, and only five got more than half. In other states, research revealed that some local governments actually lose money trying to collect fees and fines. (7)
Fees and fines are generally small and shrinking compared to Tennessee counties’ other revenues, but they still pay for about 15% of criminal justice spending. Across 90 state-audited counties in FYs 2017-2019, fee and fine revenues – including some money from civil matters – averaged about $0.03 for every dollar of local tax revenue and 15% of all public safety and criminal justice spending. Both of these proportions were lower than in FYs 2007-2009, largely due to growth in tax revenues and criminal justice spending. (8) We used 3-year averages of counties’ financials to smooth out any one-year spikes in fees and fines, because it offers a clearer picture of those revenues in a typical year.
Explaining Differences in Local Fees & Fines
Our analysis suggests fee and fine variation may have more to do with local decisions and policies than with more easily-measured factors like crime or demographics. Counties with the highest LFOs tended to have higher crime rates and a larger share of black and/or Hispanic residents. Controlling for other factors, however, neither those nor any other county characteristics we looked at had a consistently significant impact on LFOs. This suggests that the biggest determinant of LFO variation across Tennessee are factors we have not yet identified or can’t easily measure – like the decision and practices of local officials. (2) (9) (10) (11) (12) (13) (14) (15) (16)
What’s Missing?
This report begins to quantify how Tennessee’s state and local governments raise revenue from criminal fees and fines, but information gaps remain. Our analysis is limited by a lack of publicly-available data with the detail and duration required to draw stronger conclusions. Better data and additional research would paint a more precise picture of long-term trends and variation in state and county reliance on LFO revenues, as well as the sources of those differences. More information could also shed light on the indirect costs of fees and fines – including what counties spend to collect them, the costs of prolonged criminal justice involvement, and any downstream impact on tax revenue tied to things like employment and productivity.
The sections that follow explain our analyses in more detail.
Figure 1

Following the Money
Tennessee’s complex system of criminal fees and fines makes it tough to understand their financial impact on state and local government. Challenges include:
- The sheer number of potential financial obligations.
- Local discretion and variation in optional or county-specific fees and fines.
- The many hands through which money can pass.
- Involvement of both state and local government and private entities.
- Complex formulas for distributing the money.
- Several factors that affect how payments are applied to the specific LFOs a person might owe.
- The conversion of unpaid criminal fees and fines to civil debt.
A patchwork of state, local, and private entities collect Tennessee’s criminal fees and fines, and the flow of money to various purposes can be hard to isolate (Figure 1). Much of the money flows through county court clerks, who keep some but distribute most to state agencies, other local officials, and victims. Many courts and their clerks also have jurisdiction over and collect fees and taxes for civil cases as well. Meanwhile, some state and local agencies hire third-party collection vendors, who may keep a portion as commission. Of the money that ultimately ends up with state and local governments, some helps to fund specific parts of the criminal justice system and other, often-related programs, while the rest becomes general purpose revenue.
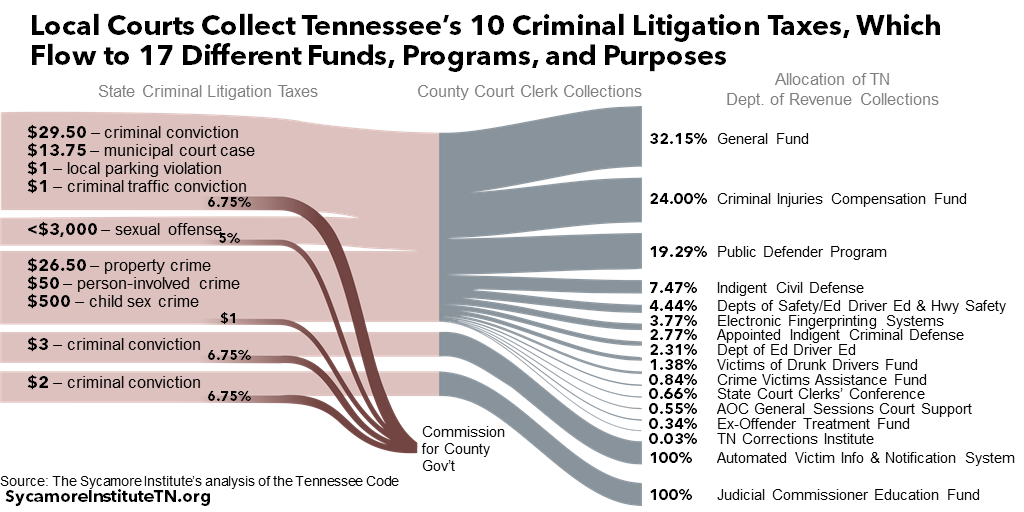
The flow of 10 criminal litigation taxes required or allowed by state law illustrates some of this complexity (Figure 2). These taxes range from $1 for each criminal traffic conviction or local public parking violation to up to $3,000 for a sexual offense conviction. Local court clerks collect the money, and counties keep a commission – ranging from $1 each for certain convictions to a blanket 6.75% cut of others. Municipal courts sometimes have different commission rates. (17) (18) (20) Clerks send the rest to the Tennessee Department of Revenue, which distributes it according to specific formulas written into state law for each tax.
- Collections from eight of 10 statewide criminal litigation taxes are allocated to 14 different state government funds and programs (Figure 2) – ranging from 35.1502% for the General Fund to 0.0320% for the Tennessee Corrections Institute. (21) (2)
- All collections from the $3 tax on criminal convictions help to fund a state victim notification system. (17)
- All collections from a separate $2 tax on criminal convictions go to a judicial commissioner fund. (17)
Figure 2
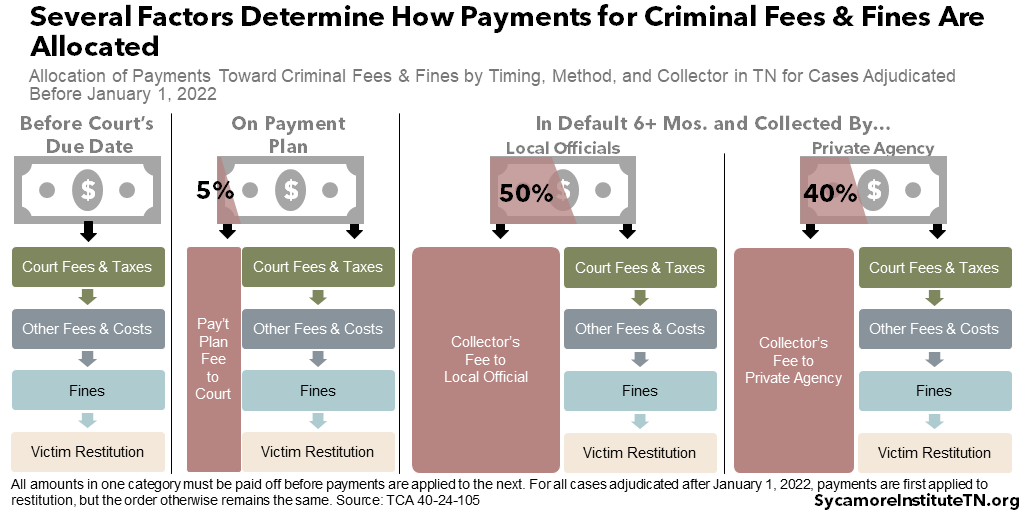
Several other factors can also affect where payments for criminal fees and fines in Tennessee end up (Figure 3). For people with multiple types of criminal financial obligations, state law requires that any payments go to settle court fees and taxes first, then jail fees and other incarceration costs, then fines, and finally restitution. For cases adjudicated after January 1 2022, payments will first go towards restitution, but the order otherwise remains the same. (43) Some courts may offer payment plans but can require up to 5% of each payment go toward a special installment plan fee. Once a criminal justice debt is in default for at least six months, up to 50% of any of payment goes to whichever local agency collected it as a collection fee. If local officials hire a third-party collector, that private entity gets up to 40% as a collection fee. In both cases, the rest applies in the priority order noted above.
Figure 3
Finally, unpaid criminal fees and fines often become civil debt – further complicating efforts to tally the full fiscal impact of legal financial obligations. If a judge converts criminal debt into civil debt, the criminal consequences go away but civil litigation taxes and fees will apply as in any other civil case (e.g. disputes over contracts or unpaid private debt). The debts in these cases continue to have fiscal effects on state and local government, but they are mixed in with the effects of other, unrelated types of civil cases.
Fees & Fines in the State Budget
Publicly available information provides an incomplete picture of the role that criminal fees and fines play in the state budget. The state does publicly track collections from certain fees and fines that support both the General Fund and any of the specific purposes that each of them fund like those in Figure 3. There are also recent data on asset forfeitures that support state law enforcement. However, specific, detailed information on fee and fine revenues for other agencies is not available. This limits the ability to take a comprehensive look at Tennessee state governments’ reliance on legal financial obligations.
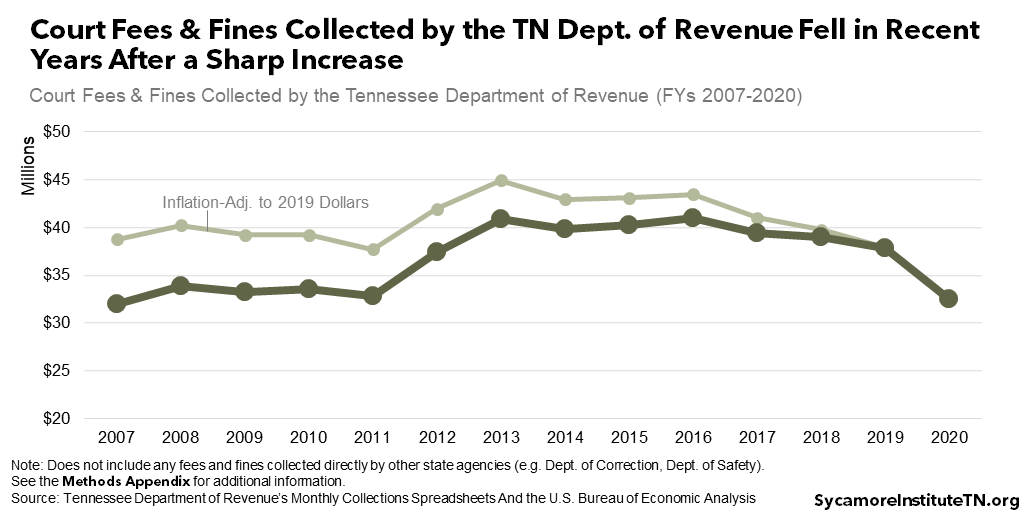
The Tennessee Department of Revenue (DOR) collected $37.9 million in litigation taxes and other court fees and fines in FY 2019 (Figure 4). (23) These revenues increased by nearly 25% between FYs 2011 and 2013 but have since been relatively flat or falling, depending on the specific fee or tax. FY 2020 saw large drops, likely due to COVID-related changes to court dockets and restrictions on certain civil actions. (24)
Figure 4
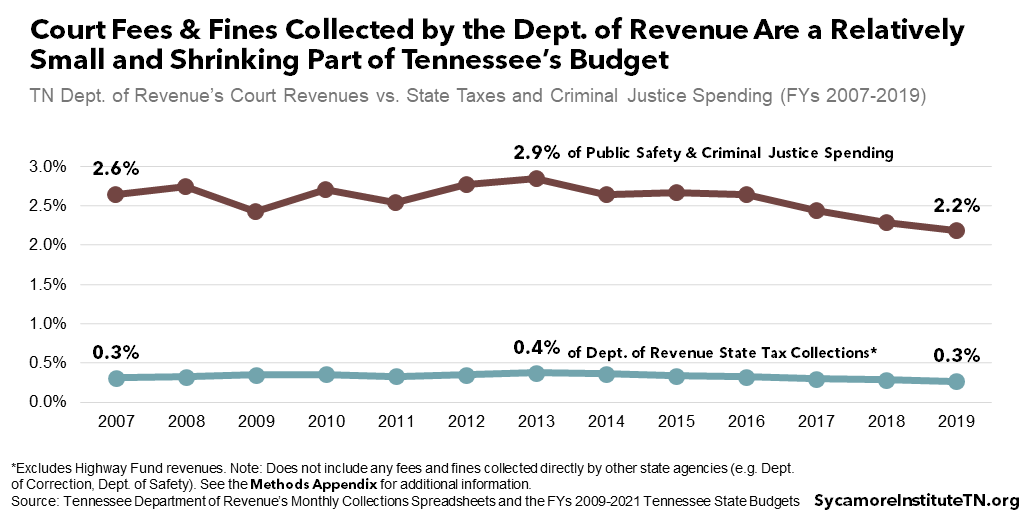
While DOR court revenues are the sole or main funding source for certain state programs, they play a relatively small and declining role in the overall state budget. Each of the court fees and taxes the department collects go into either the state’s General Fund or to specific programs that also get General Fund dollars (e.g. Criminal Injuries Compensation Fund, Civil Legal Representation Fund, etc.). In FY 2019, this money totaled about 0.3% of all state taxes DOR collected (not including Highway Fund revenue) and about 2.2% of the $1.7 billion spent on public safety, criminal justice, and the courts. Those proportions have fallen since FY 2013 (Figure 5). (23) (3)
Figure 5
Criminal fees, taxes, and fines collected by other state agencies may play a larger role in their budgets, but that information is generally not public. Criminal justice-related fees are one type of a broader set of agency-specific fees that help fund the Department of Correction (TDOC), the Department of Safety & Homeland Security, and the Tennessee Bureau of Investigation (TBI). In FY 2016, for example, TBI got 22% of its budget (over $16 million) from agency-specific fees and assessments. TDOC collected $15 million that year – just 2% of its budget. (26) However, the data were only reported in one year and do not show how much of those fees came from criminal justice-related activities as opposed to other services (e.g. TBI background checks) Detailed and up-to-date information on agencies’ direct collections are necessary to know the full impact of fees and fines on state finances.
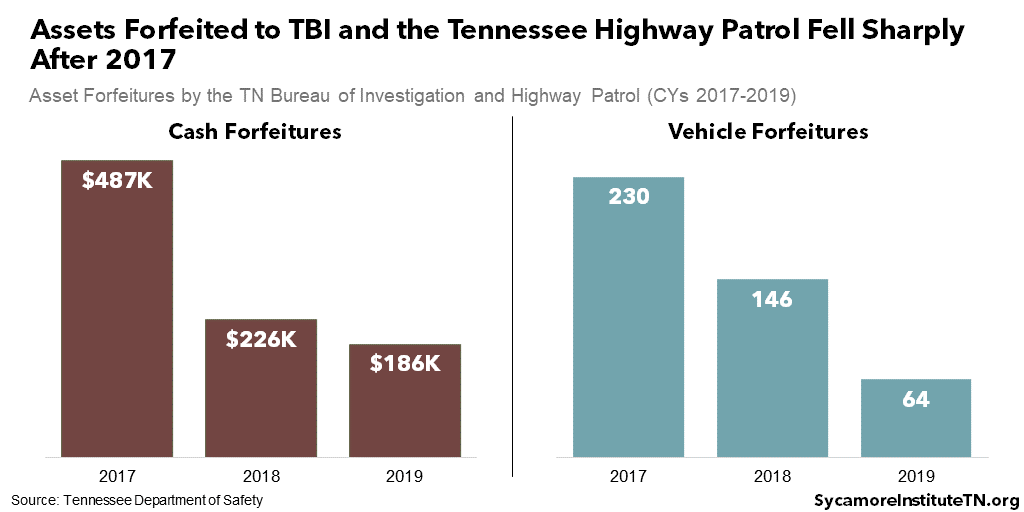
Relatively minor proceeds from asset forfeitures help cover some costs for the Department of Safety and TBI. The state began reporting asset forfeitures at the agency level in 2017. In 2019, 64 vehicles and just under $186,000 were forfeited to TBI and the Tennessee Highway Patrol – a large drop from two years earlier (Figure 6). About $315,000 from these and prior years’ proceeds paid for small expenses related mostly to helicopter repair. Local law enforcement and special drug task forces make the vast majority of asset seizures in Tennessee. In 2019, they accounted for 98% of all cash and 96% of all vehicle forfeitures. (27)
Figure 6
Fees & Fines in County Budgets
In recent years, Tennessee’s county governments collected about $180 million in annual fee and fine revenues – though that includes some funds from civil cases. (4) (28) (29) (30) We analyzed 12 years of financial and budget data for all but one county to understand how these revenues vary across time and place. For 90 counties, we used state-audited annual financial data. (9) For four of the remaining counties – Davidson, Hamilton, Knox, and Shelby – we consulted annual budget and financial documents. (28) (31) (32) (29) (30) Below, we discuss the 90 counties as a group and the other four individually.
This analysis is the first to quantify the use of fee and fine revenues in almost every Tennessee county, but there are limitations. Most significantly, we could not fully isolate money related to criminal violations from funds tied to civil matters (e.g. private lawsuits, child support cases). For example, our analysis includes courts and officers with jurisdiction over both civil and criminal issues (e.g. circuit and general sessions courts and clerks). In addition, the information here many not be fully comparable for all counties due to the different data sources used. Finally, this study does not include any fees and fines collected by municipalities.
For more information on our data sources and a full discussion of our assumptions and limitations, see the Methods Appendix.
Fee & Fine Revenues in the 90 State-Audited Counties
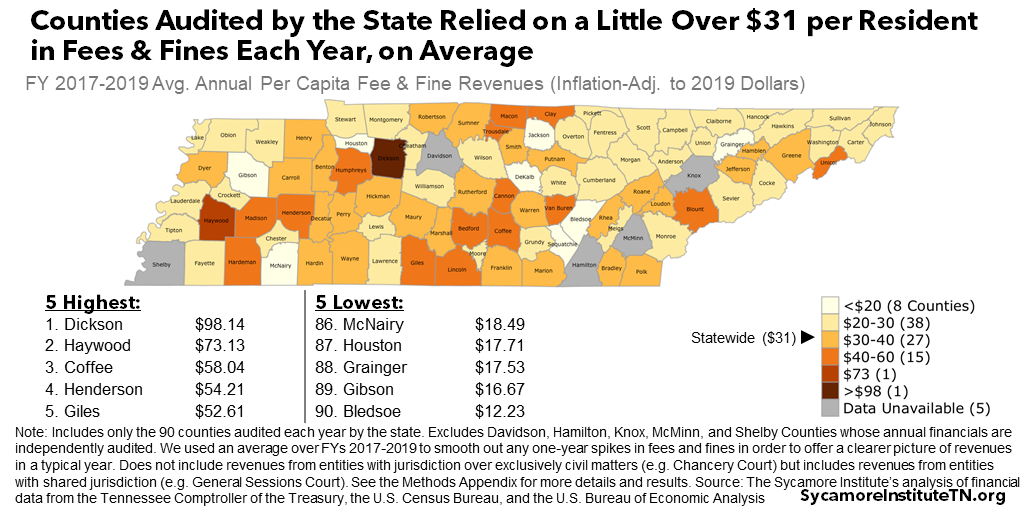
The 90 state-audited counties together relied on a total of about $130 million in LFO revenues to fund county operations each year between FYs 2017-2019. Over this period, average LFO-supported operational costs ranged from $140,000 annually in Moore County to nearly $11 million a year in Rutherford (Figure 7). Adjusting for population, the average reliance on fee and fine revenues each year ranged from about $12 per resident in Bledsoe County to nearly $100 in Dickson (Figure 8). (4) (25) (11) (33)
Figure 7
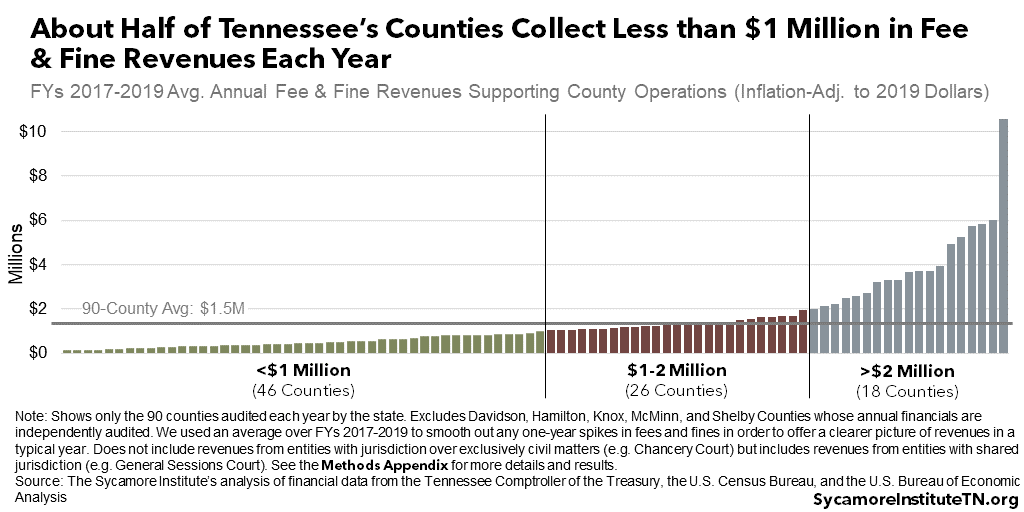
Figure 8
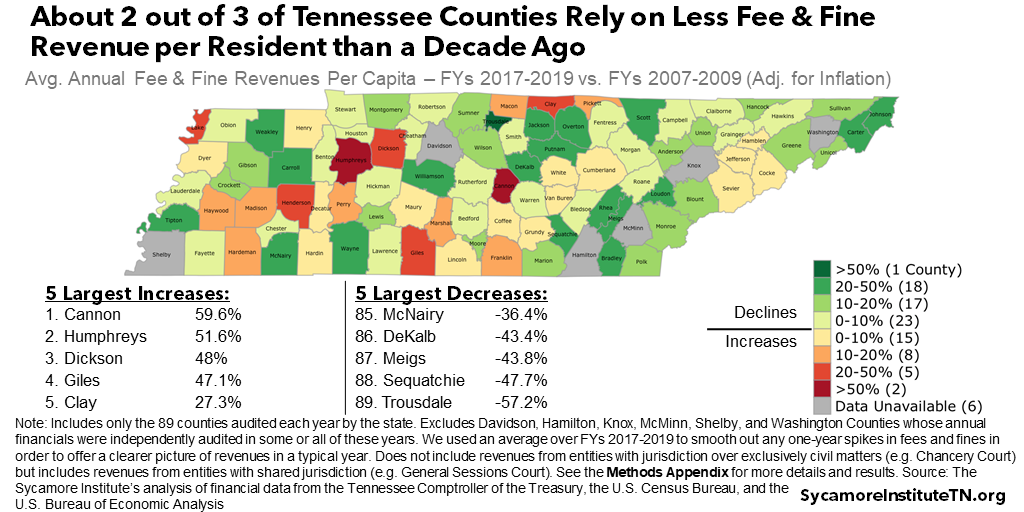
The state-audited counties together rely on about the same amount of fee and fine revenue each year as they did a decade prior. After adjusting for inflation, the total amount of annual LFO revenues increased from $130.1 million in ‘07-‘09 to $130.2 million in ‘17-‘19 – a 0.1% increase among the 89 counties with data available for all years (Figure 9). (4) (25)
However, some individual counties had a significant change in fee and fine revenues (Figure 10). For example, Sequatchie County experienced an inflation-adjusted 44% drop in annual fee and fine revenues while Cannon saw a 68% increase. The variation was similar for fee and fine revenues per capita – which accounts for changes in population between ‘07-‘09 and ‘17-‘19. (4) (25)
Figure 9
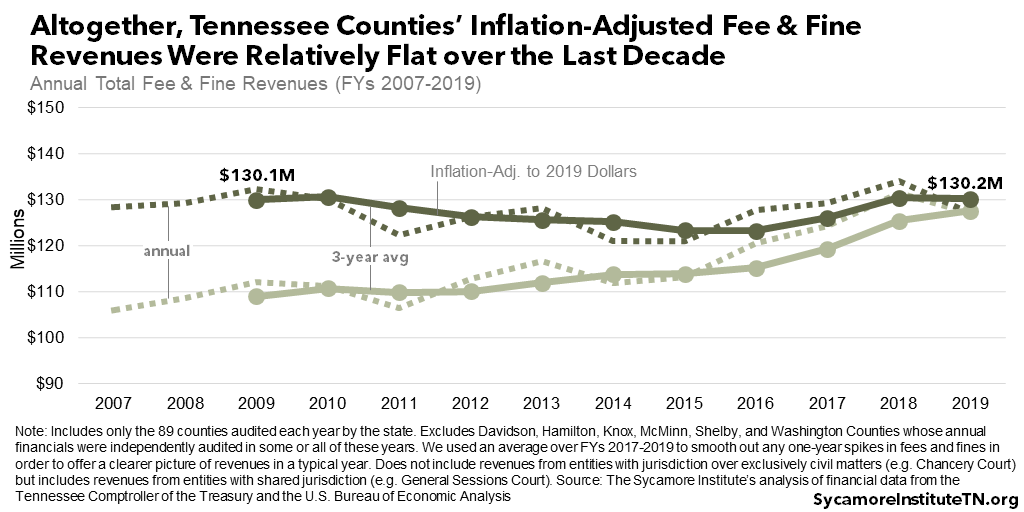
Figure 10
For context, we compared county governments’ fee and fine revenues with local tax revenues and their spending on public safety and criminal justice. We found:
- On average, annual fee and fine revenues totaled about $0.03 for every dollar of local tax revenue in ‘17-‘19 – ranging from $0.01 in Williamson County to $0.09 in Dickson. (Figure 11)
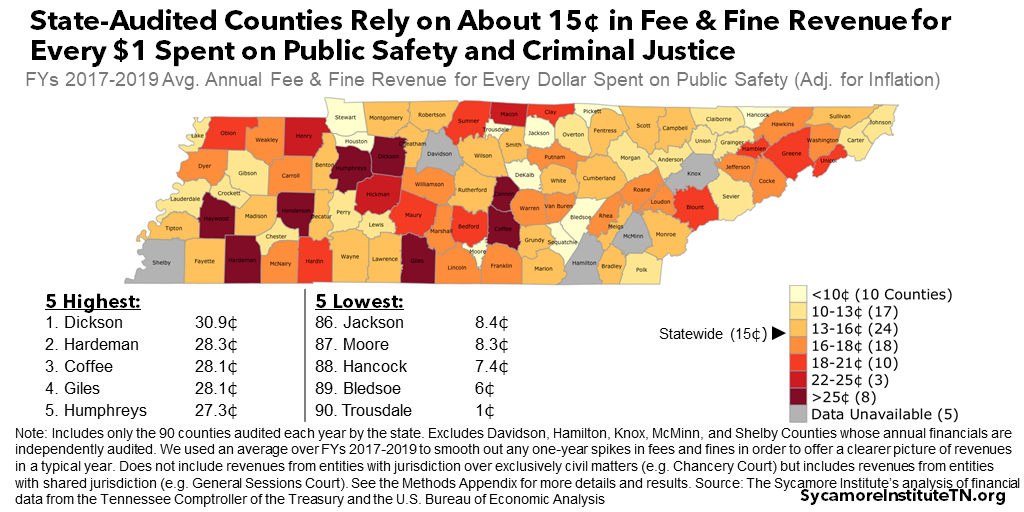
- Fee and fine revenue accounted for about 15% of average county spending on public safety and criminal justice in ‘17-’19 – varying from to 1% in Trousdale County to 31% in Dickson (Figure 12).
- Between ‘07-‘09 and ‘17-‘19, most counties had relatively stable fee and fine revenues while local tax revenues and spending on public safety and criminal justice increased.
Figure 11
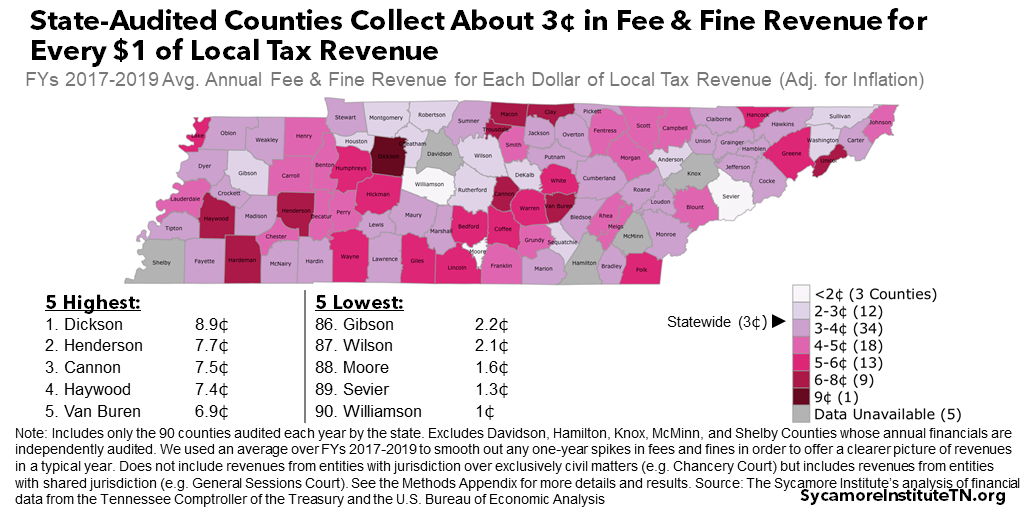
Figure 12
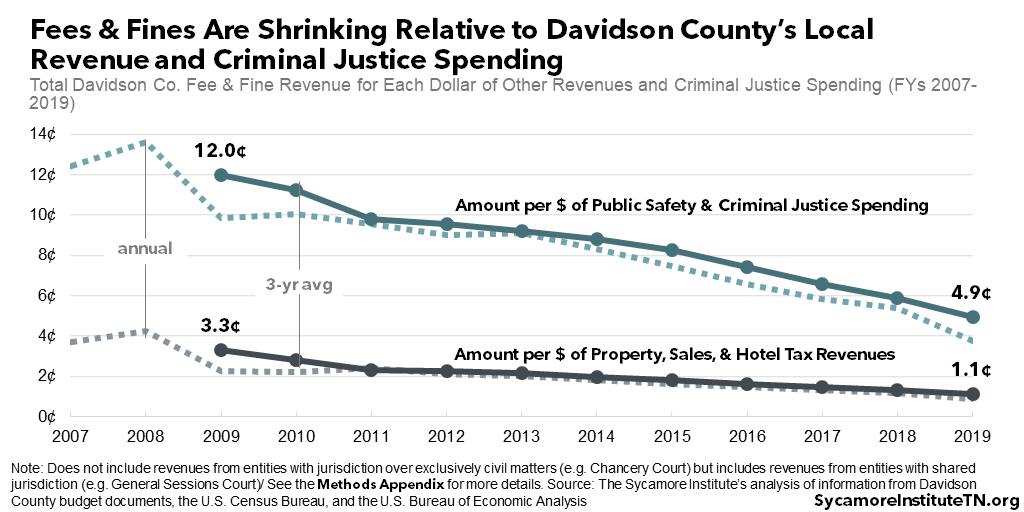
Fee & Fine Revenues in Davidson County
Davidson County spent over 50% less fee and fine revenue on county operations between FYs 2017-2019 than a decade prior, adjusted for inflation. The $17 million annual average from ’17-’19 equaled about $24 per resident each year. (Figure 13). LFO revenues are small and shrinking in comparison to both the county’s local tax revenue and its budget for public safety and criminal justice (Figure 14). (28) (11) (33) (25)
Figure 13
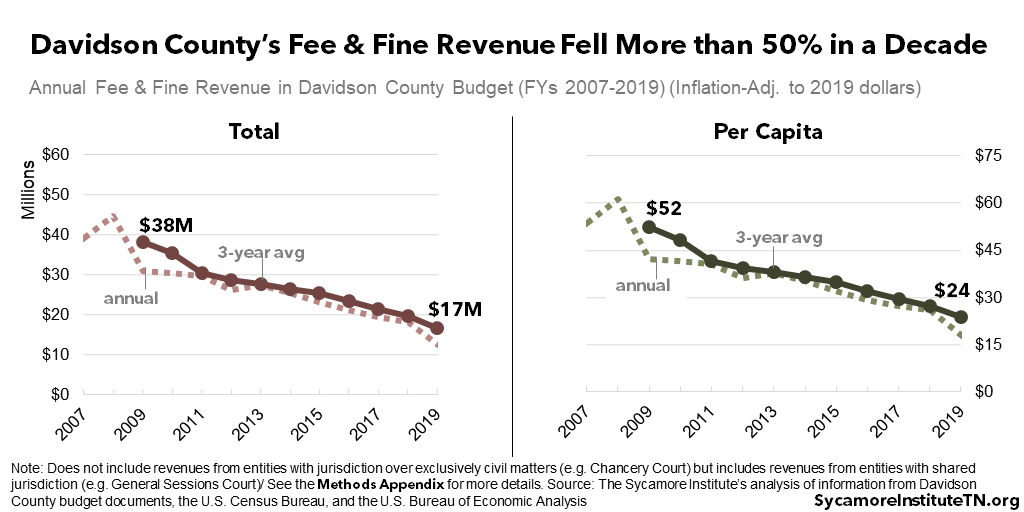
Figure 14
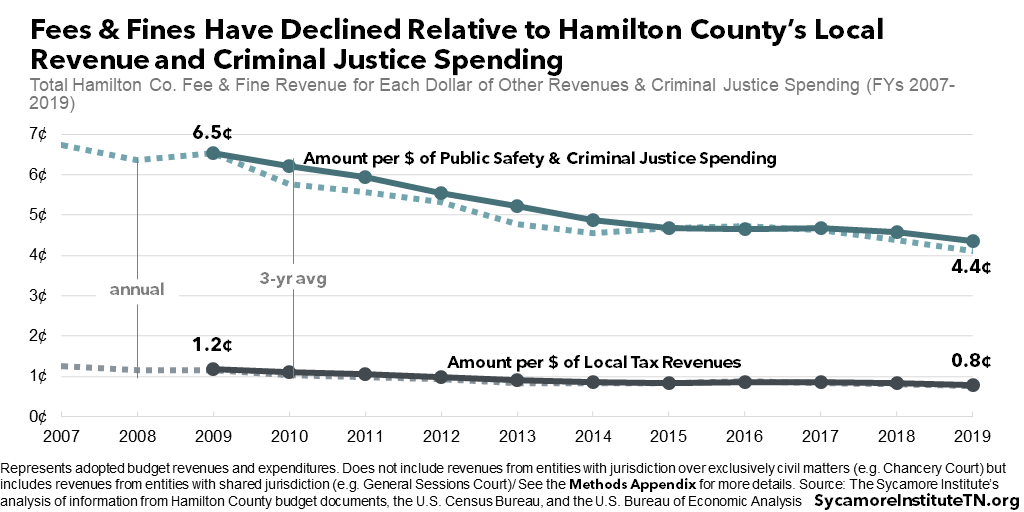
Fee & Fine Revenues in Hamilton County
Hamilton County budgeted about 25% less fee and fine revenue for county operations in FYs 2017-2019 than ten years earlier, adjusted for inflation. The $3.2 million annual average from ’17-’19 totaled about $9 per resident each year. On a per capita basis, the decline represents a 20% inflation-adjusted drop over the same period (Figure 15). LFO revenues also shrank relative to the county’s local tax revenues and public safety and criminal justice spending (Figure 16). (31) (32) (11) (33) (25)
Figure 15
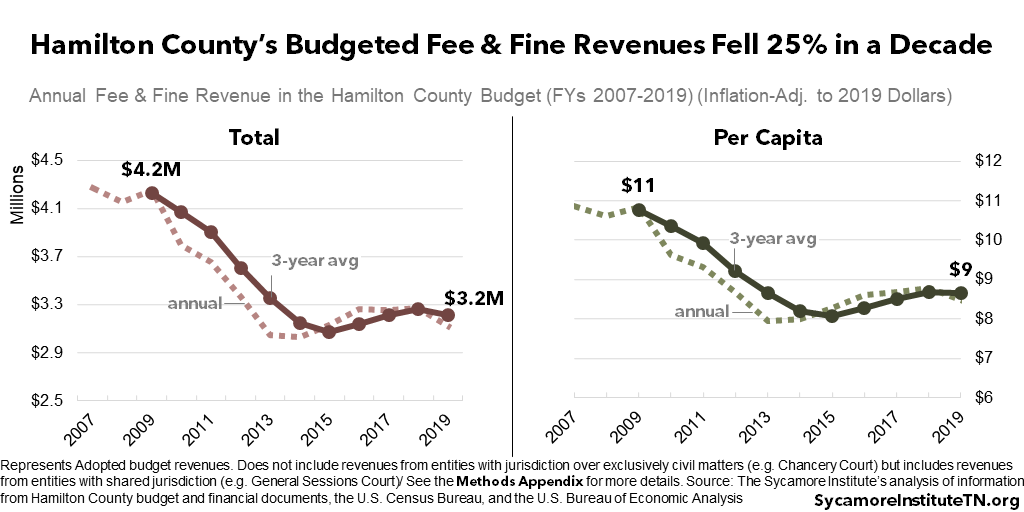
Figure 16
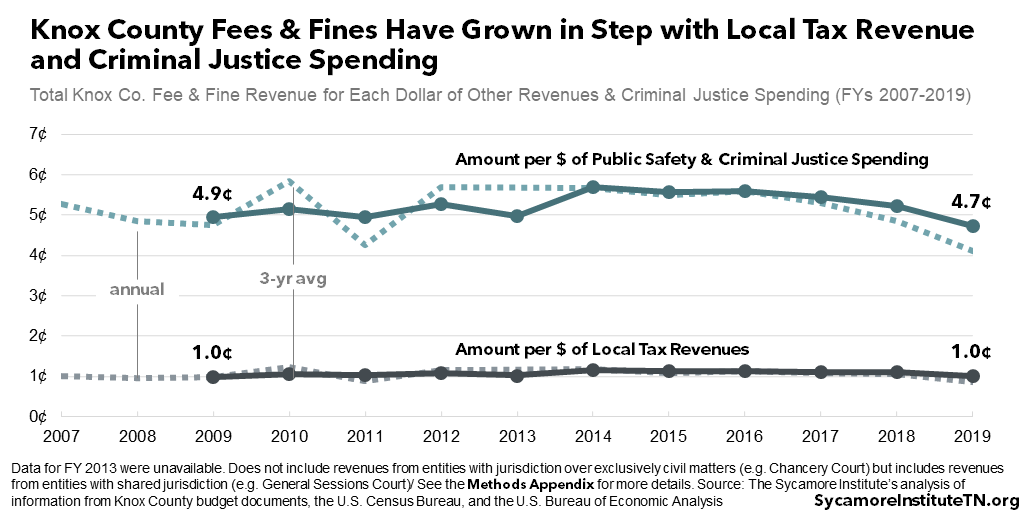
Fee & Fine Revenues in Knox County
Knox County spent 13% more fee and fine revenue on county operations between FYs 2017-2019 than a decade before, adjusted for inflation. The $4.9 million annual average from ’17-’19 adds up to about $10 per resident each year. While actual LFO collections varied from year to year, that 3-year per capita average was 21% higher than in FYs 2007-2009 (Figure 17). During this period, Knox County’s fee and fine revenues grew at roughly the same rate as both other revenue and criminal justice spending (Figure 18). (29) (11) (33) (25)
Figure 17
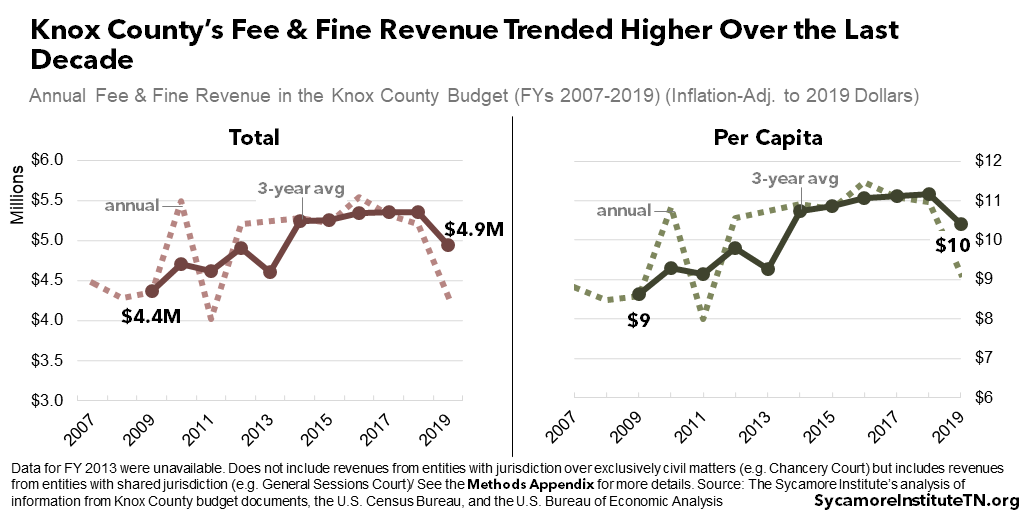
Figure 18
Fee & Fine Revenues in Shelby County
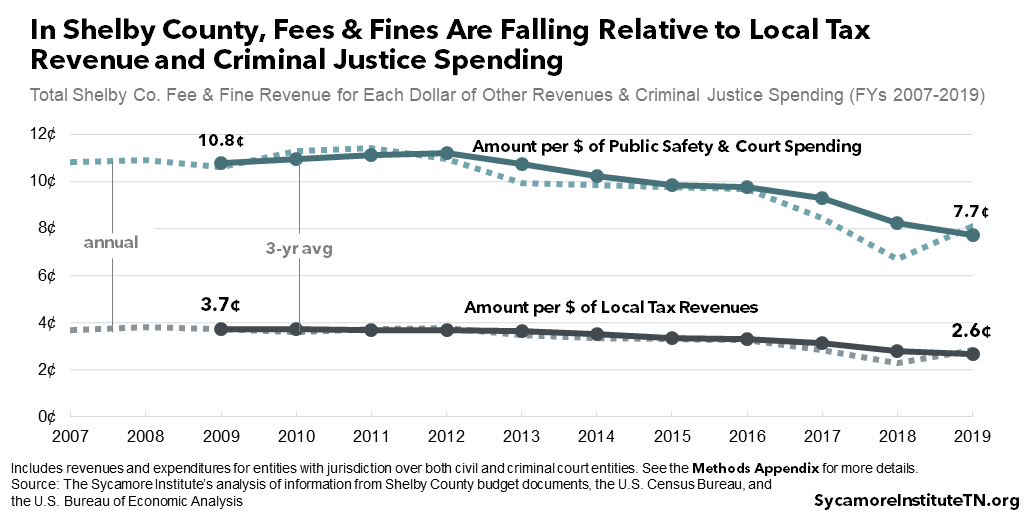
Shelby County used about 30% less fee and fine revenue for county operations in FYs 2017-2019 than ten years prior, adjusted for inflation. The $24 million annual average from ’17-’19 equaled about $25 per resident each year. On a per capita basis, the decline represents a 19% inflation-adjusted drop over the same period (Figure 19). Fee and fine collections also shrank relative to the county’s local tax revenues and public safety and criminal justice spending (Figure 20). (29) (11) (33) (25)
Figure 19
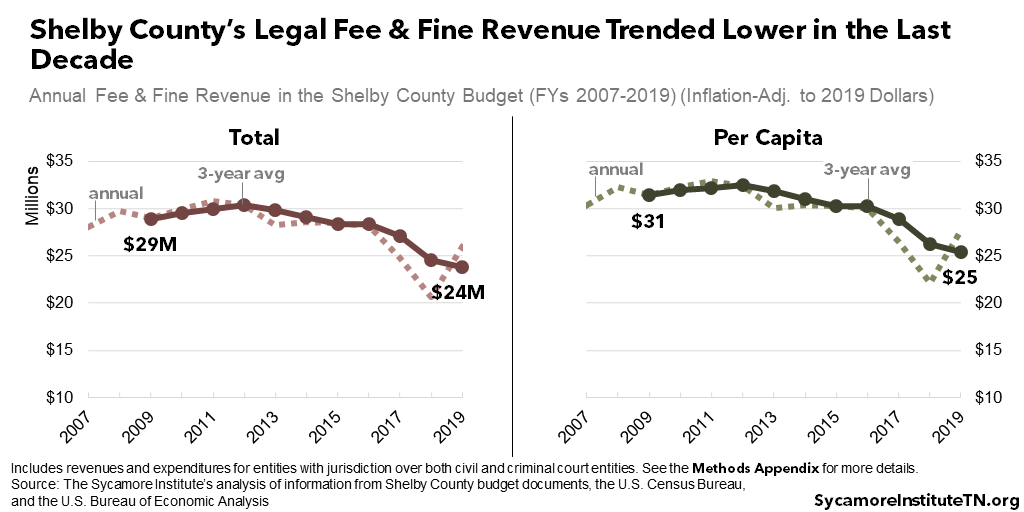
Figure 20
The Assessments and Collections that Drive Revenues
How much LFO revenue state and county governments can spend depends on the fees and fines they levy and what amount they actually collect. While state law sets broad rules, local legal systems and stakeholders help determine what is both owed and collected. For example, some judges may screen for indigency more routinely than others. (34) Meanwhile, some court clerks may try harder to collect amounts owed, and some counties might hire private debt collection firms that pursue payment more aggressively. While the prior section discussed only collections that support local county budgets, we can also examine a single year of data on all criminal court fee and fine assessments and collections in most of the state. (2)
Figure 21

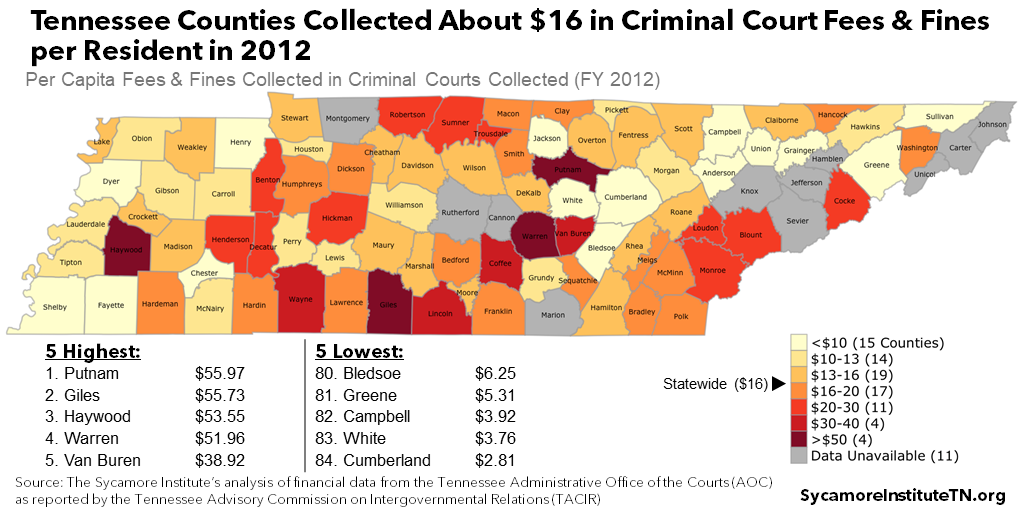
Criminal court data from FY 2012 – the most recent year available – show large variation in the fees and fines that counties assess and collect. (2) In 84 counties with available data, court-assessed criminal fees and fines averaged $58 per capita – ranging from $13 in White County to $165 in Warren (Figure 21). On average, they only collected 27% of the total. Greene County had the lowest collection rate at 10%, and Lincoln had the highest at 66% (Figure 22). Per capita collections ranged from $3 in Cumberland County to $56 in Putnam, with an average of $16 (Figure 23). In general, counties that levied and collected more per resident in criminal court also tended to have higher fee and fine revenues in the state-audited data analyzed above.
Figure 22
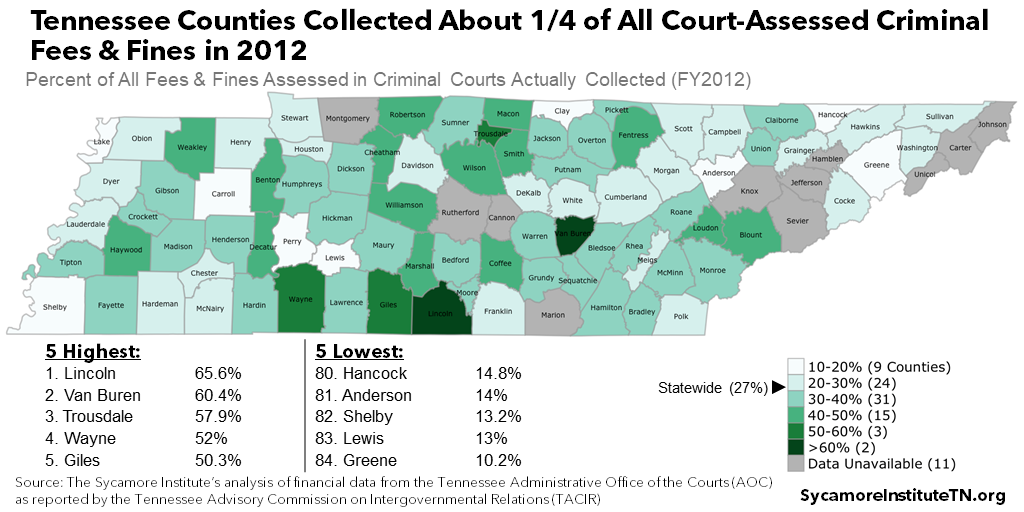
Figure 23
Explaining County Variation
Our analysis suggests that location matters when it comes to fees and fines. We compared the characteristics of counties with high and low fee and fine levies, collections, and revenues. We also looked at the relationship between these characteristics and county fees and fines while controlling for factors that are themselves related (e.g. education levels and poverty rates). Counties with the highest and lowest LFOs do have some noticeable differences. However, the biggest driver of fee and fine variation across the state may be factors that are harder to measure: the choices made by local officials who influence relevant policy and practice in each county.
Counties with high fees and fines tended to have higher crime and poverty rates, a larger share of black and Hispanic residents, and less property tax revenue. In general, counties with the highest per capita fees and fines – both levies and revenues – had higher crime rates and a larger percentage of black and/or Hispanic residents (Figures 24 and 25). This was also the case for counties with higher fee and fine revenues relative to local taxes and public safety spending. (4) (25) (35) In addition, counties that assessed larger criminal court fees and fines per capita tended to have higher poverty rates and lower per capita property tax revenues (Figure 25). Meanwhile, criminal courts in poorer counties had lower collection rates. (2) (25) (35)
Figure 24

Figure 25
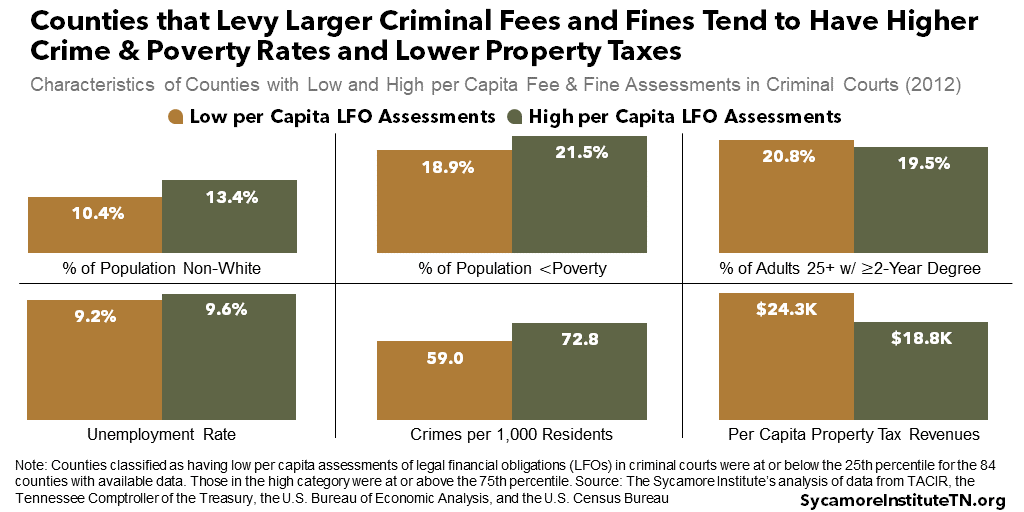
These differences between counties with high and low fees and fines are consistent with existing theories and research. For example, one might reasonably expect crime rates to be a significant driver of LFO revenues. In addition, poorer counties with less ability to generate tax revenues or those with lower tax burdens may put more emphasis on fees and fines to pay for local services. (36) (37) (38) Lower-income communities may even assess more penalties if residents have a harder time paying their LFOs. (39) (15) Nationally, research has also found a link between racial composition and fee and fine levies. (37)
After controlling for other factors, however, none of these county-level attributes had a consistently meaningful impact on LFO variation. (2) (9) (10) (11) (12) (13) (14) (15) (16) In the Tennessee data we analyzed, crime, poverty, education, and local tax collections had statistically significant links to fee and fine variation. The strength and magnitude of those relationships, however, varied across statistical models. These mixed results limit the inferences that can be drawn from the analysis. See Appendix Tables A14-19 for our complete results.
This suggests that the variation in fees and fines may have more to do with each county’s specific policies and practices than anything else. Our analysis suggests that the primary determinants of fees and fines are factors we either have not yet identified or can’t easily measure. For example, each county has its own set of local lawmakers, police, prosecutors, courts, and jail administrators who all make policies and decisions that affect local fee and fine outcomes. While identifying and comparing them across all 95 counties would be difficult, it may be worthwhile if policymakers want to fully understand this system and its effects. This would echo other recent research showing that jail incarceration in many U.S. cities has more to do with the cities themselves rather than things like crime and public safety budgets. (42)
Parting Words
This report explores how Tennessee’s state and local governments use fees, fines, and other legal financial obligations as a revenue source. Overall, they appear to play an important but shrinking role in funding public safety and criminal justice systems, but variation across the state is significant. Fees and fines also involve trade-offs that can create undesirable incentives for government and make it harder for people to escape the criminal justice system and get ahead in life. Future reports on this topic will present options for policymakers who want to address these unintended side effects or take an alternative approach.
[i] We used a three-year average to smooth out any one-year spikes in fees and fines and show a clearer picture of collections in a typical year.
* This report was updated on July 9, 2021 to reflect recent legislative changes to payment prioritization.
References
Click to Open/Close
- Maciag, Mike. Addicted to Fines: Small Towns in Much of the Country are Dangerously Dependent on Punitive Fines and Fees. Governing. [Online] September 2, 2019. https://www.governing.com/topics/finance/gov-addicted-to-fines.html.
- Barrie, Jennifer, et al. Tennessee’s Court Fees and Taxes: Funding the Courts Fairly. Tennessee Advisory Commission on Intergovernmental Relations (TACIR). [Online] January 26, 2017. https://www.tn.gov/content/dam/tn/tacir/documents/2017_CourtFees.pdf.
- State of Tennessee. Tennessee State Budget for FY 2009 – FY 2021. [Online] 2008-2020. Available from https://www.tn.gov/finance/fa/fa-budget-information/fa-budget-archive.html.
- Tennessee Comptroller of the Treasury. Local Government Audit. Transparency and Accountability for Governments. [Online] November 2020. https://apps.cot.tn.gov/TAG/.
- Harris, Alexes, Evan, Heather and Beckett, Katherine. Drawing Blood from Stones: Legal Debt and Social Inequality in the Contemporary United States. American Journal of Sociology. [Online] 115(6) 2010. http://faculty.washington.edu/kbeckett/articles/AJS.pdf.
- Miller, Girard. Fines, Fees, Forfeitures and the Emerging Issue of Fairness. Governing. [Online] December 8, 2020. https://www.governing.com/finance/Fines-Fees-Forfeitures-and-the-Emerging-Issue-of-Fairness.html.
- Menendez, Matthew and Eisen, Lauren-Brooke. The Steep Costs of Criminal Justice Fees and Fines. The Brennan Center. [Online] November 21, 2019. https://www.brennancenter.org/our-work/research-reports/steep-costs-criminal-justice-fees-and-fines.
- Liu, Patrick, Nunn, Ryan and Shambaugh, Jay. Nine Facts About Monetary Sanctions in the Criminal Justice System. The Hamilton Project. [Online] March 15, 2019. https://www.brookings.edu/wp-content/uploads/2019/03/BailFacts_20190314.pdf.
- Tennessee Comptroller of the Treasury. Local Government Audited Financial Data for FY 2007 – FY 2019. [Online] Data provided by the Division of Local Audit on Spetember 16, 2020.
- Tennessee Bureau of Investigation. Crime Rates by Jurisdiction (2012). CrimeInsight. [Online] https://crimeinsight.tbi.tn.gov/public/View/dispview.aspx?ReportId=20.
- U.S. Census Bureau. Annual Estimates of the Resident Population for the United States, Regions, States, and Puerto Rico: April 1, 2010 to July 1, 2019 (NST-EST2019-01). [Online] 2019. https://www.census.gov/data/datasets/time-series/demo/popest/2010s-state-total.html.
- —. Race. American Community Survey 5-Year Estimates (2012). [Online] https://data.census.gov/cedsci/table?t=Race%20and%20Ethnicity&g=0400000US47.050000&y=2012&d=ACS%205-Year%20Estimates%20Detailed%20Tables&tid=ACSDT5Y2012.B02001&hidePreview=true.
- —. Place of Birth by Poverty Status in the Past 12 Months in the United States. American Community Survey 5-Year Estimates (2012). [Online] https://data.census.gov/cedsci/table?t=Official%20Poverty%20Measure&g=0400000US47.050000&y=2012&d=ACS%205-Year%20Estimates%20Detailed%20Tables&tid=ACSDT5Y2012.B06012&hidePreview=true.
- —. Educational Attainment for the Population 25 Years and Over. American Community Survey 5-Year Estimates (2012). [Online] https://data.census.gov/cedsci/table?t=Educational%20Attainment&g=0400000US47.050000&d=ACS%205-Year%20Estimates%20Detailed%20Tables&tid=ACSDT5Y2012.B15003&hidePreview=true.
- U.S. Bureau of Labor Statistics. Local Area Unemployment Statistics. [Online] https://www.bls.gov/lau/.
- Tennessee Comptroller of the Treasury. 2012 Tax Aggregate Report of Tennessee. [Online] https://comptroller.tn.gov/office-functions/pa/tax-resources/reports-handbooks-reference.html.
- State of Tennessee. Tenn. Code Ann. § 67-4-602: LItigation Taxes. [Online] https://law.justia.com/codes/tennessee/2019/title-67/chapter-4/part-6/section-67-4-602/.
- —. Tenn. Code Ann. § 40-24-107: Criminal Injuries Compensation Fund. [Online] https://law.justia.com/codes/tennessee/2019/title-40/chapter-24/section-40-24-107/.
- —. Tenn. Code Ann. § 16-18-305: Municpal Courts – Levy of State Privilege Tax on Litigation. [Online] https://law.justia.com/codes/tennessee/2019/title-16/chapter-18/part-3/section-16-18-305/.
- —. Tenn. Code Ann. § 8-21-401: Schedule of Fees – Clerks of Court. [Online] https://law.justia.com/codes/tennessee/2019/title-8/chapter-21/part-4/section-8-21-401/.
- —. Tenn. Code Ann. § 67-4-606: Apportionment of Revenue. [Online] https://law.justia.com/codes/tennessee/2019/title-67/chapter-4/part-6/section-67-4-606/.
- —. Tenn. Code Ann. § 40-24-105: Collection of Fines, Costs and Litigation Taxes – Installment Payment Plan – Suspended License – Restricted License – Conversion to Civil Judgment – Settlement. [Online] https://law.justia.com/codes/tennessee/2019/title-40/chapter-24/section-40-24-105/.
- Tennessee Department of Revenue. Monthly Collections Spreadsheets: FYs 1998-2020. [Online] https://www.tn.gov/revenue/tax-resources/statistics-and-collections/monthly-collections-spreadsheets.html.
- Tennessee Administrative Office of the Courts. Tennessee Court Orders, Rules, Policies Related to Coronavirus. [Online] https://www.tncourts.gov/Coronavirus.
- U.S. Bureau of Economic Analysis. Table 1.1.4. Price Indexes for Gross Domestic Product. Interactive Data: National Income and Product Accounts. [Online] November 2020. https://apps.bea.gov/iTable/iTable.cfm?reqid=19&step=3&isuri=1&select_all_years=0&nipa_table_list=4&series=a&first_year=2007&last_year=2019&scale=-99&categories=survey&thetable=.
- State of Tennessee. FY 2016-2017 Tennessee State Budget: Expenditures by Object and Funding by Source. [Online] 2016. https://www.tn.gov/content/dam/tn/finance/budget/documents/2017ExpRevDetail.pdf.
- Tennessee Department of Safety and Homeland Security. Asset Forfeiture Reports for Calendar Years 2017-2019. [Online] https://www.tn.gov/safety/stats/asset_forfeiture_reports.html.
- Metro Government of Nashville and Davidson County, Tennessee. Budget Books. [Online] Available from https://www.nashville.gov/Finance/Management-and-Budget/Citizens-Guide-to-the-Budget/Documents-and-Resources/Budget-Book-Archive.aspx and https://www.nashville.gov/Finance/Management-and-Budget/Citizens-Guide-to-the-Budget/Documents-and-Res.
- Knox County, Tennessee. Adopted Budget Detail Documents. [Online] Available from https://knoxcounty.org/finance/budget.php.
- Shelby County, Tennessee. Adopted Budget Documents. [Online] Accessed from https://www.shelbycountytn.gov/Archive.aspx?AMID=36.
- Hamilton County Tennessee. Adopted Budget for FYs 2008-2020. [Online] Available from http://www.hamiltontn.gov/Division_Finance.aspx.
- —. Comprehensive Annual Financial Report for FYs 2007-2019. [Online] Available from https://comptroller.tn.gov/advanced-search.html#{%22q%22:%22*%22,%22filters%22:%22{\%22division\%22:\%22cot:division/local-government-audit\%22,\%22county\%22:\%22cot:county/hamilton\%22,\%22entity\%22:\%22cot:entity/county\%22,\%22type\%22.
- U.S. Census Bureau. Intercensal Estimates of the Resident Population by Sex and Age for States: April 1, 2000 to July 1, 2010. [Online] 2010. https://www.census.gov/data/tables/time-series/demo/popest/intercensal-2000-2010-state.html.
- Satterfield, Jamie. Tennessee Judges are Brushing Aside Bail Laws, and It’s Costing You. Knoxville News Sentinel. [Online] February 23, 2021. https://www.tennessean.com/in-depth/news/crime/2021/02/23/tennessee-judges-ignoring-bail-laws-and-its-costing-you/4436704001/.
- U.S. Census Bureau. American Community Survey 5-Year Estimates. [Online] Retrieved from http://data.census.gov.
- Shaer, Matthew. How Cities Make Money by Fining the Poor. The New York Times Magazine. [Online] January 8, 2019. https://www.nytimes.com/2019/01/08/magazine/cities-fine-poor-jail.html.
- Sances, Michael W. and You, Hye Young. Who Pays for Government? Descriptive Representation and Exploitative Revenue Sources. The Journal of Politics. [Online] 79(3) 2017. https://hyeyoungyou.files.wordpress.com/2015/08/fines.pdf.
- Weiner, Robert N., et al. Privitization of Services in the Criminal Justice System. The American Bar Association. [Online] June 24, 2020. https://www.americanbar.org/content/dam/aba/administrative/legal_aid_indigent_defendants/ls-sclaid-def-aba-privatizaton-report-final-june-2020.pdf.
- Bannon, Alicia, Nagrecha, Mitali and Diller, Rebekah. Criminal Justice Debt: A Barrier to Reentry. The Brennan Center. [Online] October 4, 2010. https://www.brennancenter.org/sites/default/files/2019-08/Report_Criminal-Justice-Debt- A-Barrier-Reentry.pdf.
- Chetty, Raj, et al. The Opportunity Atlas: Mapping the Childhood Roots of Social Mobility. Opportunity Insights. [Online] January 2020. https://opportunityinsights.org/paper/the-opportunity-atlas/.
- Looney, Adam and Turner, Nicholas. Work and Opportunity Before and After Incarceration. The Brookings Institution. [Online] March 2018. https://www.brookings.edu/wp-content/uploads/2018/03/es_20180314_looneyincarceration_final.pdf.
- Herring, Tiana. Jail Incarceration Rates Vary Widely, but Inexplicably, Across U.S. Cities. The Prison Policy Initiative. [Online] May 4, 2021. https://www.prisonpolicy.org/blog/2021/05/04/city-jail-rates/.
- State of Tennessee. Public Chapter No. 413 (2021). May 12, 2021. https://publications.tnsosfiles.com/acts/112/pub/pc0413.pdf.