Key Takeaways
- About 112,000 debt collection cases were filed in Davidson County civil courts between 2016 and March 2023 — two-thirds of which were by high-interest lenders and debt collectors.
- Plaintiffs in Davidson County debt collection lawsuits are almost always represented by an attorney, while defendants almost never have legal representation.
- The zip codes with the highest lawsuit rates had more black residents, single-parent families, lower incomes and education levels, poorer health, and greater reliance on food stamps.
- Court data provide a unique look into consumer creditors’ collection practices and Nashvillians’ financial security but elicit additional questions to understand more about both.
The ability for businesses to use the courts to collect debts helps ensure they remain financially solvent. Ensuring that people in debt meet their financial obligations can safeguard access to and mitigate increases in the costs of credit (or other services) for others. (1) However, the over- or misuse of lawsuits involves trade-offs for both courts and defendants.
In this report, we explore consumer debt collection lawsuits in Davidson County, Tennessee. Using Davidson County civil court data for January 2016 through March 2023, this study explores how creditors use Nashville courts to collect consumer debt, the kinds of debts most likely to end up in court, and who is most affected. A similar review focused on Shelby County is available here.
Summary of Our Methods and Limitations
Methods
We obtained data for over 158,000 civil cases filed in Davidson County Circuit and General Sessions Courts from January 2016 through March 2023 from the Legal Service Corporation, which scraped and cleaned the data from Tennessee Case Finder. In Davidson County, the state’s 20th Judicial District Circuit Court and the county-level General Sessions courts share jurisdiction over debt collection lawsuits. Debt collections suits are most often brought in General Sessions court, which hears cases with claims of less than $25,000. (14) (15) Data included filing dates, plaintiff names and addresses, deidentified defendant addresses, plaintiff and defendant legal representation, and outstanding garnishment balances — among other items. We used plaintiff names to identify debt collection cases and debt types. We extracted defendant zip codes and combined them with zip code-level Census data to better understand the resident characteristics of neighborhoods most impacted by debt collection lawsuits. These methods are largely consistent with those used in a similar Michigan study. (5)
Limitations
Our analyses are subject to a number of limitations. For example:
- Much of our coding and categorizing of plaintiffs was done manually and focused largely on plaintiffs filing at least 3 cases, which means we may have missed some relevant plaintiffs.
- We excluded plaintiffs where we could not readily identify their line of business using an internet search, which may have resulted in undercounts of debt collection suits.
- Our analyses assume all plaintiffs included filed lawsuits against customers/clients for unpaid debts, which may have resulted in overcounts of debt collection suits.
- While each case was assigned to a single debt type based on the information available, the debt type categories are not mutually exclusive. For example, we included a category for auto lenders, but some suits by banks may be for auto loans. Similarly, debt buyers and 3rd-party collectors are suing for and sometimes on behalf of other types of debt.
- We used several formulas to extract defendant zip codes, which may not have been fully accurate in instances where addresses included multiple zip codes or addresses and/or where zip codes were missing.
- Without specific information about each defendant, we relied on data about the characteristics of residents of each zip code as a proxy to understand the demographics, socioeconomic circumstances, etc., of defendants, which is imperfect. To do so, we ran bivariate analyses, which tell us about correlation — not causation. While it can tell us, for example, that more cases are filed against residents of neighborhoods with higher proportions of black residents, it does not mean that one causes the other — nor does it account for other factors that may be highly correlated with both (e.g., income).
See the Appendix for additional information about our methods and findings.
Key Findings
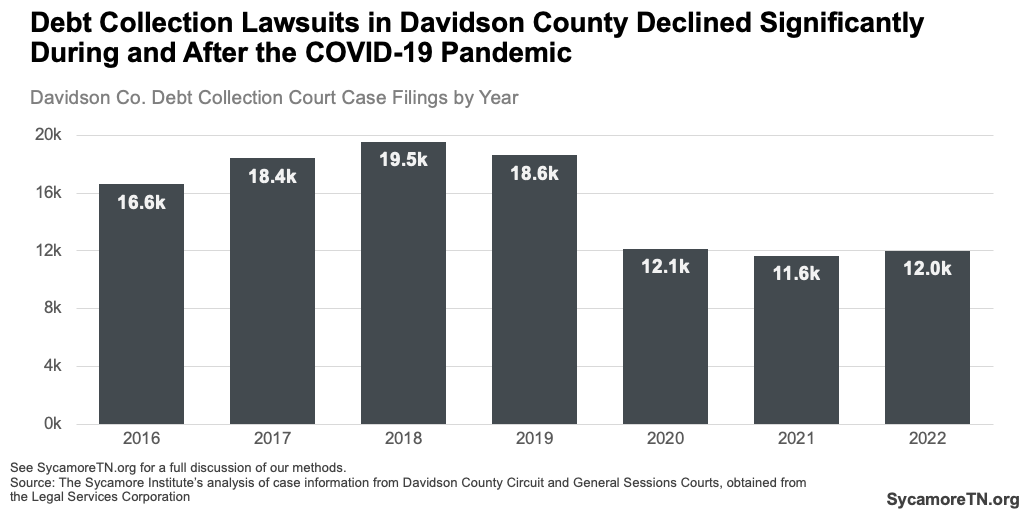
At least 112,000 debt collection cases were filed in Davidson County civil courts between January 2016 and March 2023 (Figure 1) — including about 12,000 in 2022. Between 2016 and 2018, the number of cases steadily climbed (Figure 2) — peaking at over 19,500 yearly cases. Filings declined precipitously during the pandemic as courts closed or restricted access to courtrooms. (2) As of 2022, the number of debt collection filings was almost 40% lower than the peak in 2018. (3)
Figure 1
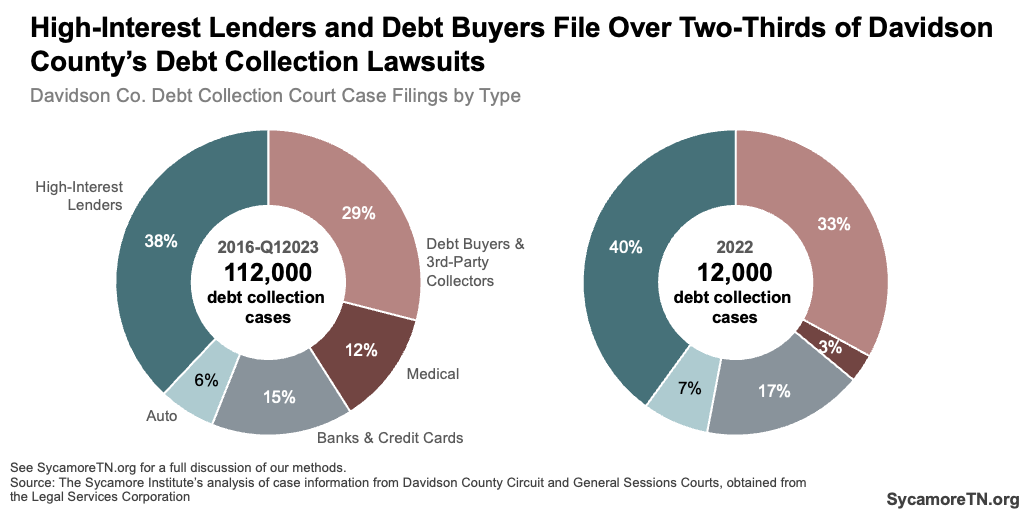
Figure 2
Debt Collector Types
High-interest lenders and debt buyers filed over two-thirds of debt collection lawsuits in Davidson County between January 2016 and March 2023 (Figure 1). Lawsuits by high-interest lenders alone made up 38% of all filings over this period — followed by debt buyers and 3rd-party collectors, which accounted for another almost 30%. By 2022, these made up even greater shares of total cases – 40% and 33%, respectively. (3) (See Collector Types text box for additional information on each type of collector.)
Figure 3

Figure 4
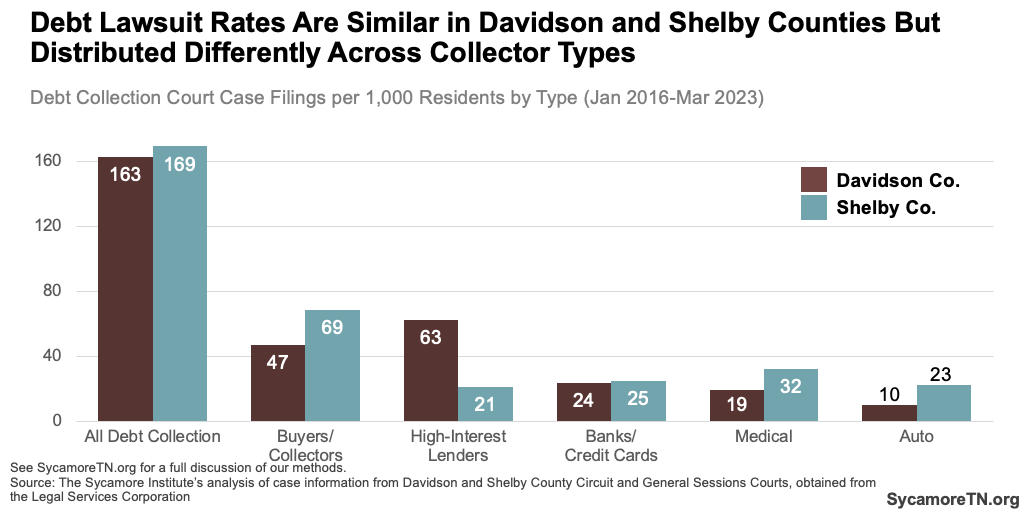
Compared to Shelby County — the only other one for which we have data — Davidson County debt collection filing rates were similar but distributed quite differently across collector types (Figures 3 and 4). While high-interest lenders accounted for 38% of all debt collection cases in Davidson — or about 63 cases per 1,000 residents, they made up only 12% — or 21 cases per 1,000 residents — in Shelby County. Debt buyers/collectors, medical providers, and auto lenders made up larger shares with higher case filing rates in Shelby County than in Davidson. (3) (4)
Figure 5
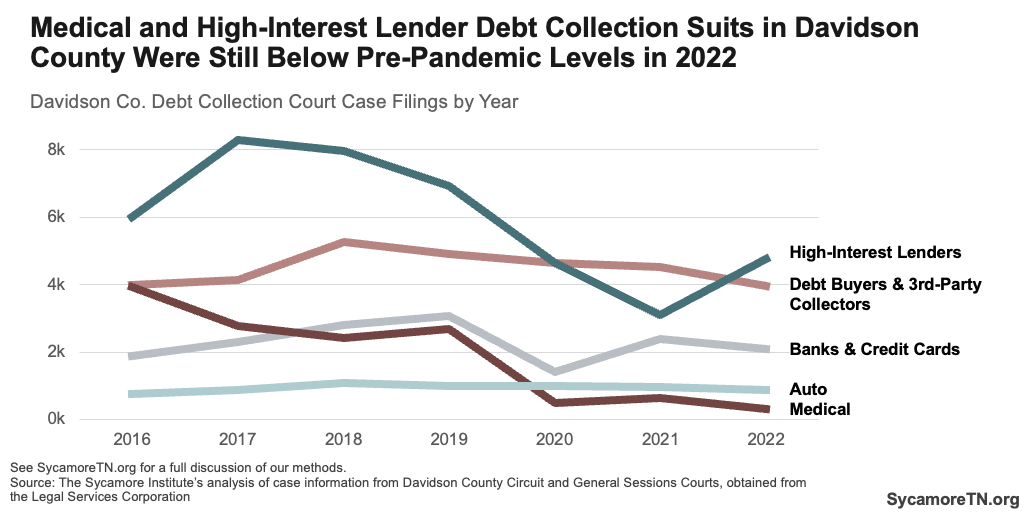
Figure 6
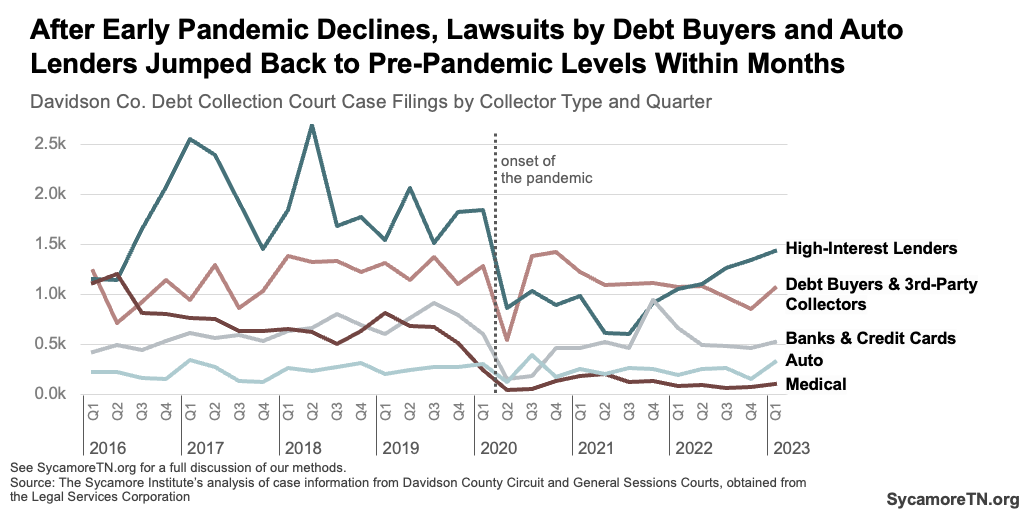
Medical and high-interest lender debt collection suits in Davidson County were still below pre-pandemic levels in 2022, while other types were about the same as before the pandemic (Figure 5). All types of cases declined significantly at the onset of the pandemic (Figure 6). Those by debt buyers/3rd-party collectors and auto lenders jumped back up to pre-pandemic levels within months. Others more steadily climbed back up, while medical debt suits remained low — consistent with other studies that show national declines in medical debt during the pandemic. (3)
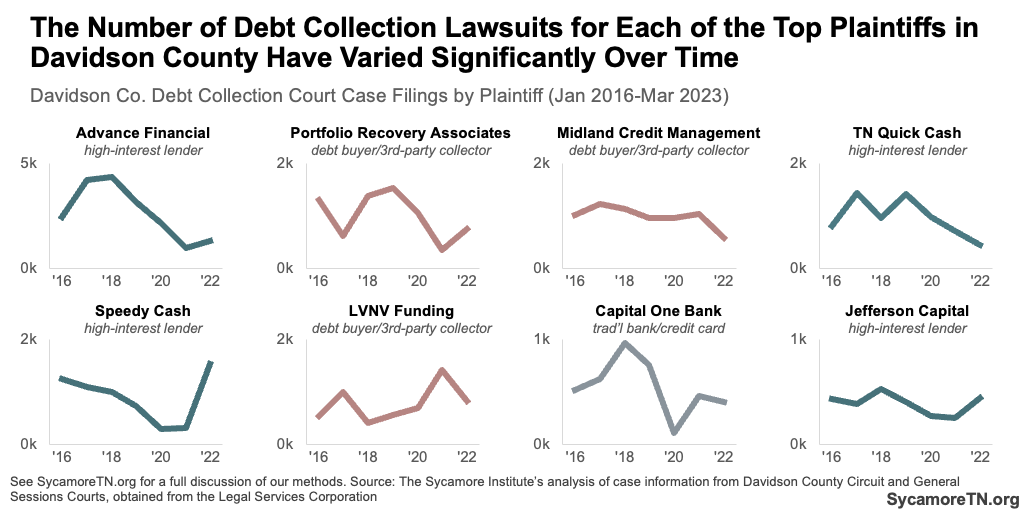
Top Plaintiffs
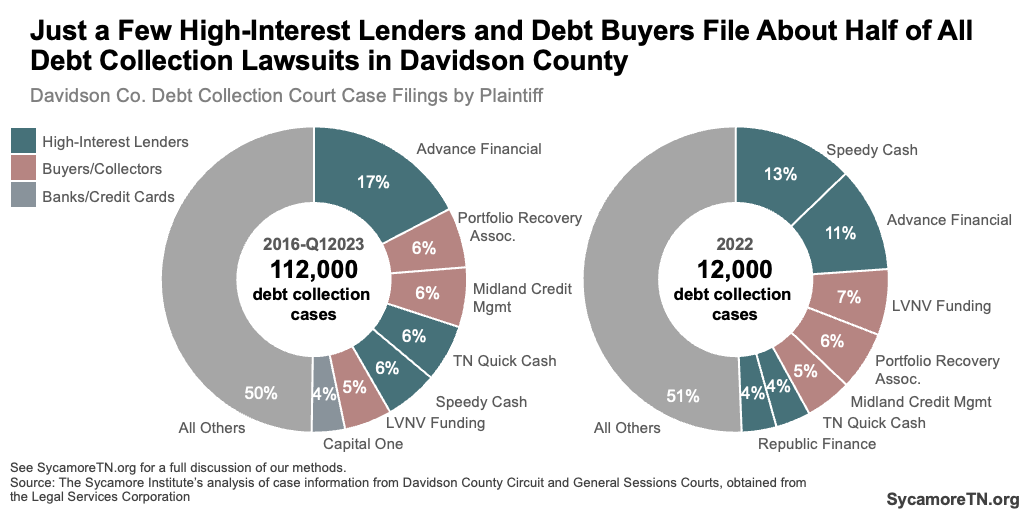
A few companies file most debt collection cases in Davidson County – mostly high-interest lenders and debt buyers (Figure 7). Between January 2016 and March 2023, Advance Financial, a Tennessee-based high-interest lender, filed over 17% of cases. In 2022, Speedy Cash, another high-interest lender, overtook Advance Financial in filings — accounting for 13% of all debt collection lawsuits. In both time periods, just seven plaintiffs accounted for about half of all debt collection lawsuits. (3)
A few plaintiffs also account for most lawsuits within almost every debt type (Figures 8 and 9). For example, between January 2016 and March 2023, the top three plaintiffs in each category brought 76% of all high-interest lender cases, 61% of debt buyer cases, 48% of bank and credit card suits, and 38% of auto lender cases — with similar proportions in 2022. Medical debt cases tended to have a more even mix of plaintiffs over the entire period. Still, as medical debt cases declined (Figure 5), lawsuits became more concentrated among a few plaintiffs. By 2022, Middle Tennessee Imaging accounted for 53% of medical debt filings. (3)
Figure 7
Collector Types
- High-Interest Lenders include creditors that offer short-term, high-cost loans often to consumers with poor credit. According to estimates, interest and fees on these types of loans can add up to a nearly 500% annual percentage rate in Tennessee, on average.(17) (18)
- Debt Buyers and 3rd-Party Collectors are companies that either purchase debts from or contract with creditors to collect unpaid debts. Buyers often purchase large portfolios of debt at a discount — sometimes pennies on the dollar. These debts can also be bought and sold by collectors multiple times.(16)
- Banks and Credit Cards include traditional banking institutions and credit card issuers.
- Medical includes medical providers like hospitals, physician groups, imaging companies, and individual health care providers. See all our past work on medical debt here.
- Auto includes car dealers and lenders that specialize in financing vehicle purchases.
Figure 8
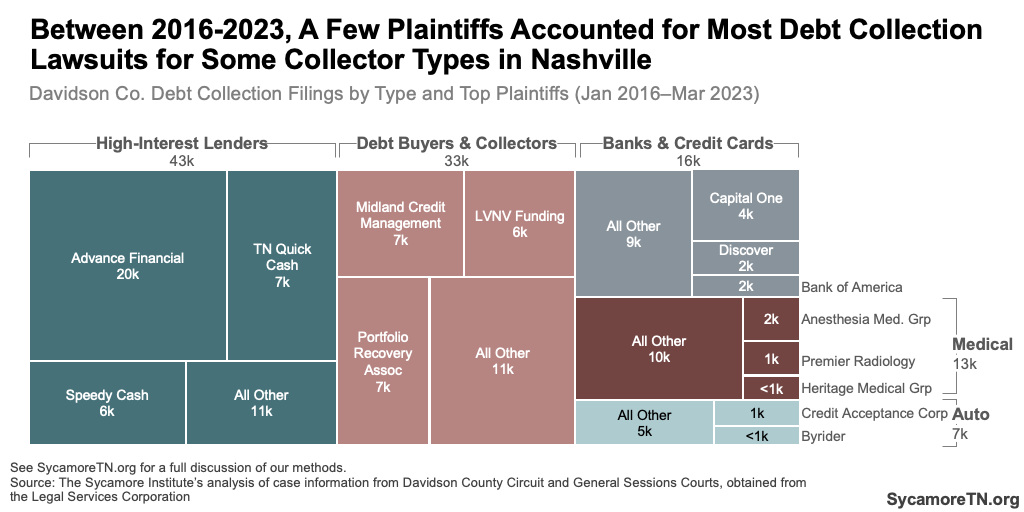
Figure 9
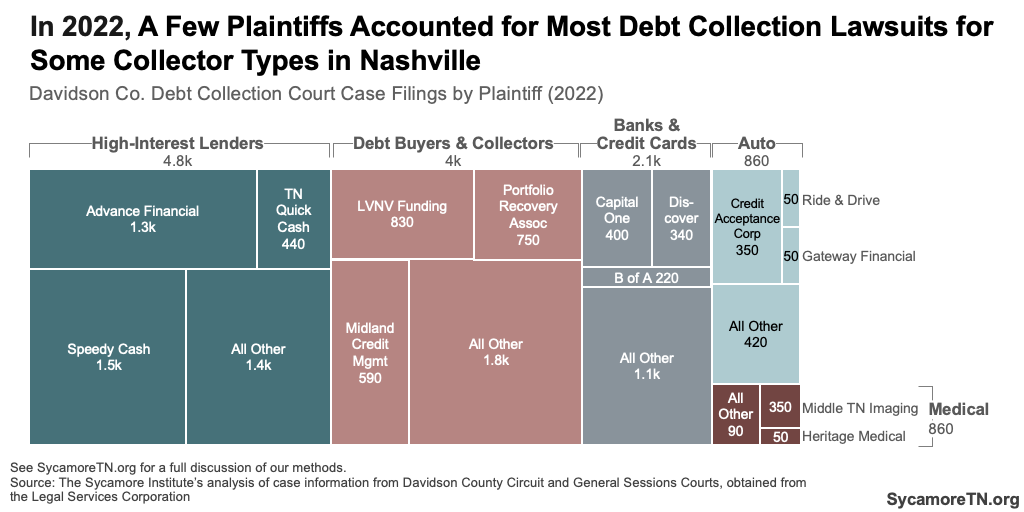
Figure 10
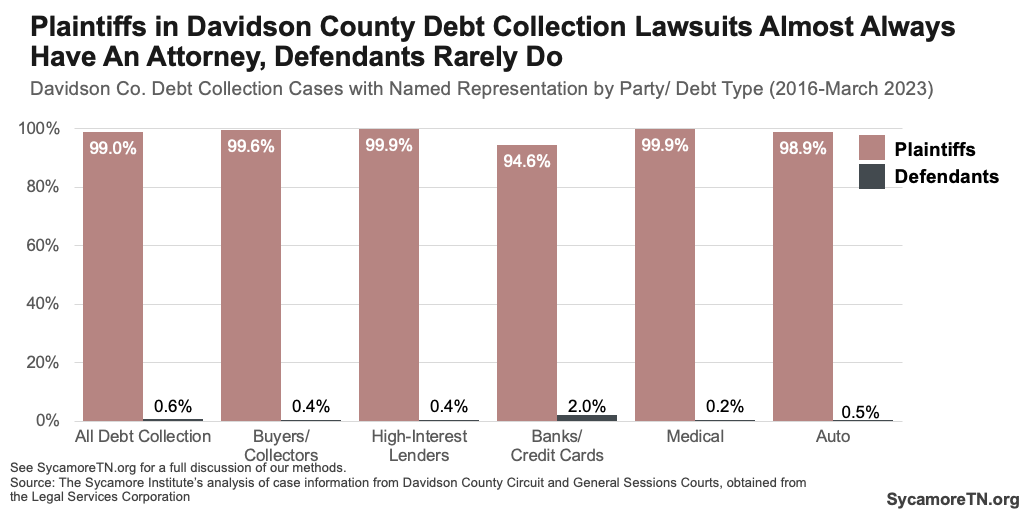
Representation
An attorney almost always represents plaintiffs in Davidson County debt collection lawsuits, while defendants rarely have legal representation (Figure 11). Across all collector types, plaintiffs had representation about 99% of the time and defendants about 0.6%. These rates varied little across collector types. (3)
Figure 11
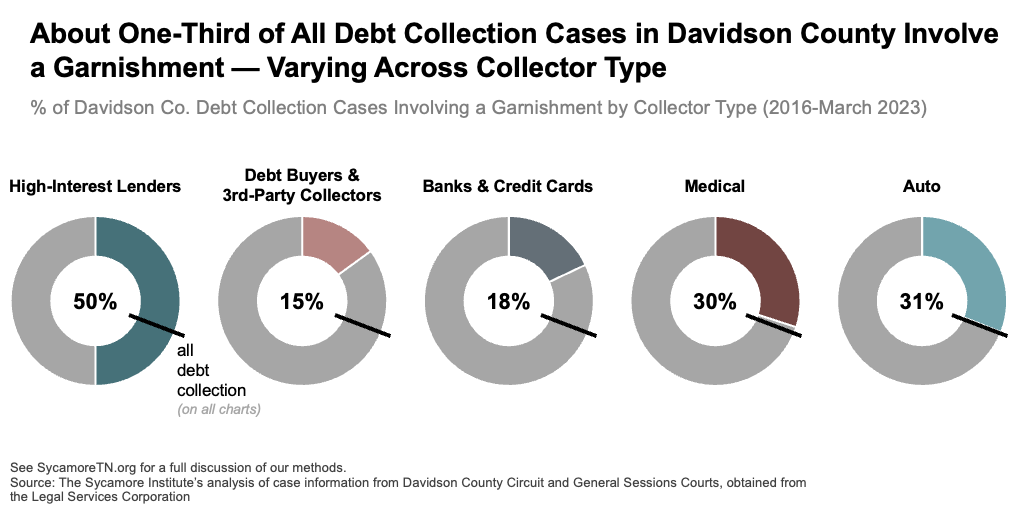
Garnishment
Settlements come in many ways — including garnishment, in which debts are deducted straight from a defendant’s paycheck or bank account. For example, cases can be dismissed, delayed, or settled between the parties without court action. If a court rules in a plaintiff’s favor, it determines a settlement that can include the debt, court costs, attorney’s fees, and interest. With approval from the court, collectors can use wage garnishments and asset seizures to recoup these settlements.
About one-third of debt collection lawsuits in Davidson County between January 2016 and March 2023 involved a garnishment. These rates varied across debt types. High-interest lender cases were most likely to lead to a garnishment, and half of those lawsuits during this period did so (Figure 12). (3)
Figure 12
Affected Neighborhoods
Defendants in a handful of Davidson County zip codes had debt collection lawsuit rates well above the county-wide average — including 37207, 37218, 37208, 37115, and 37076 (Figures 13 and 14). Residents of these five zip codes made up about 31% of all cases against Davidson County residents but only 22% of the county’s population (Figure 15). The rate of debt collection lawsuits against defendants in 37207 (Northeast Nashville) — 220 cases per 1,000 residents — was about seven times higher than for 37215 (Green Hills and Forest Hills), where it was just 26 cases per 1,000. (3) (4)
Use the interactive dashboard below to explore debt case burdens and neighborhood characteristics by zip code.
Debt collection lawsuit rates across zip codes varied more for some debt types than others (Figures 16-21). For example, the rate of high-interest lender lawsuits varied from a high of 87 cases per 1,000 residents in 37208 (North Nashville) to a low of just 5 cases per 1,000 in 37215 (Green Hills/Forest Hills). However, the range was much tighter for bank and credit card lawsuits – 27 cases per 1,000 residents in 37214 (Donelson) compared to 7 cases per 1,000 in 37212 (Hillsboro Village/Vanderbilt). These variations likely reflect the extent to which different populations access different types of credit options — with banks and credit cards more universally accessed than high-interest lenders. (3) (4)
Figure 13
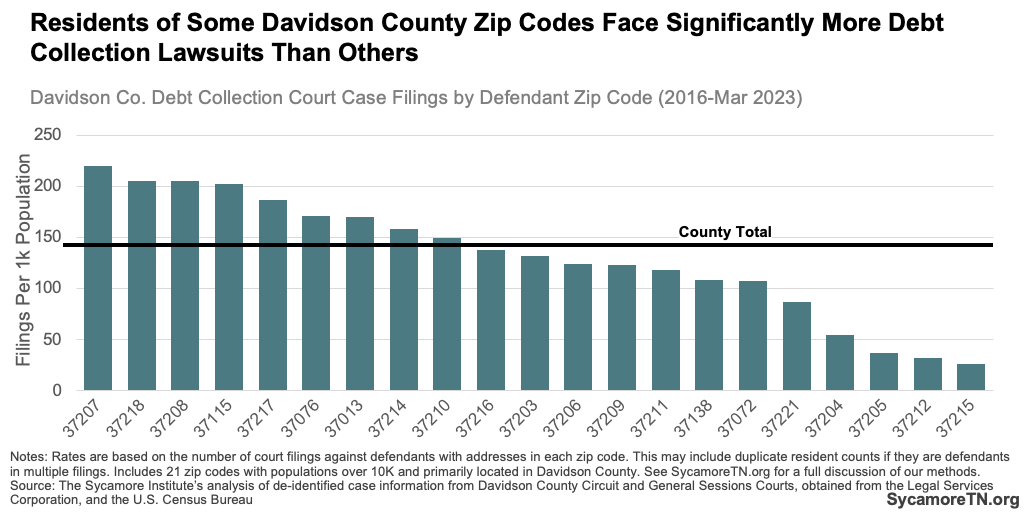
Figure 14
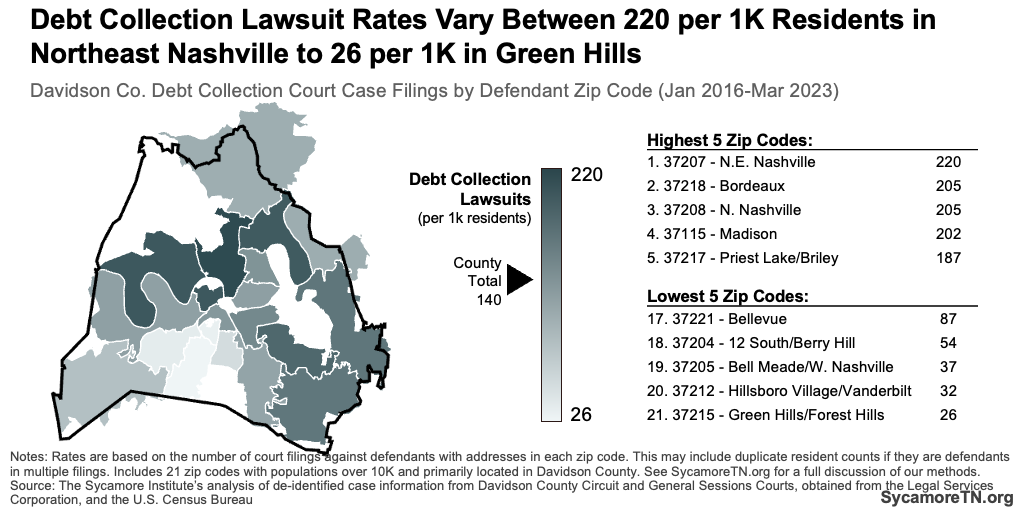
Figure 15
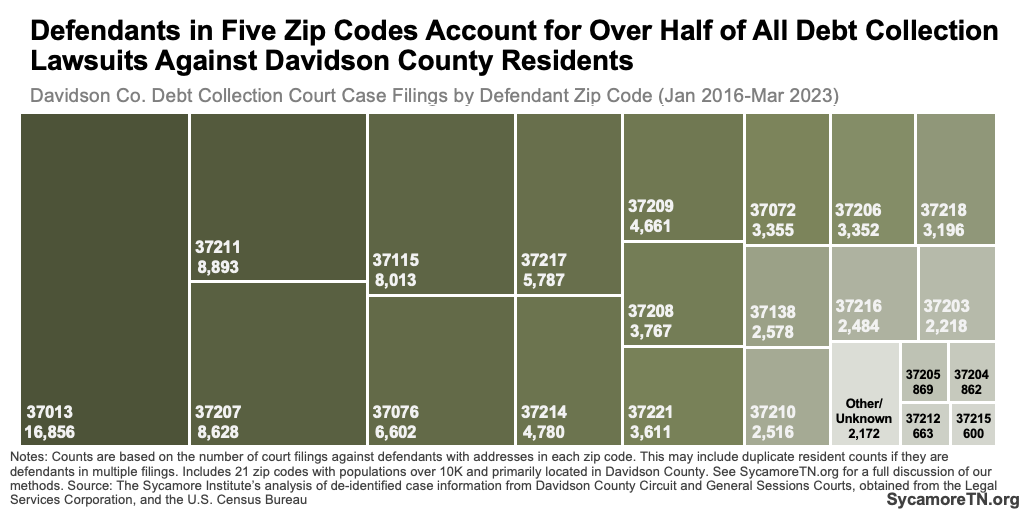
Figure 16
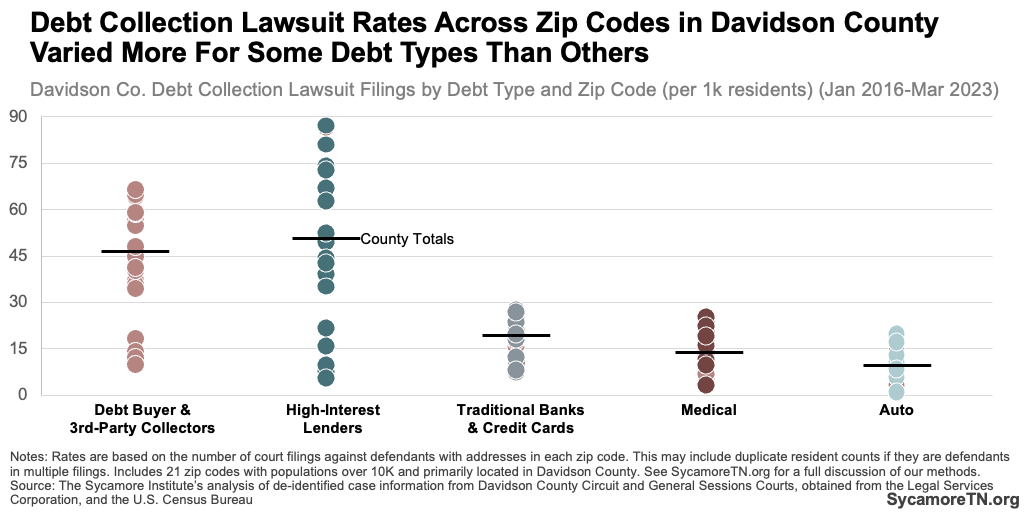
Figure 17
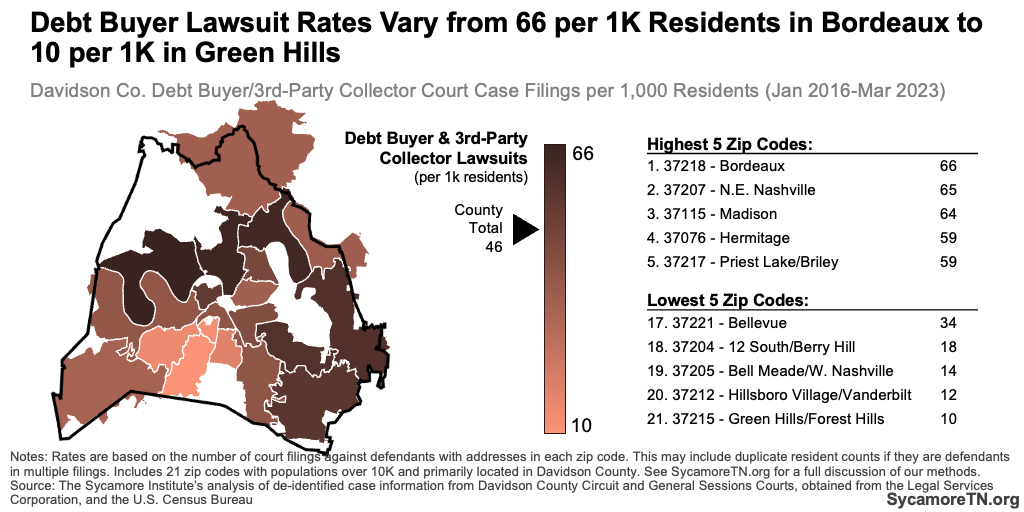
Figure 18
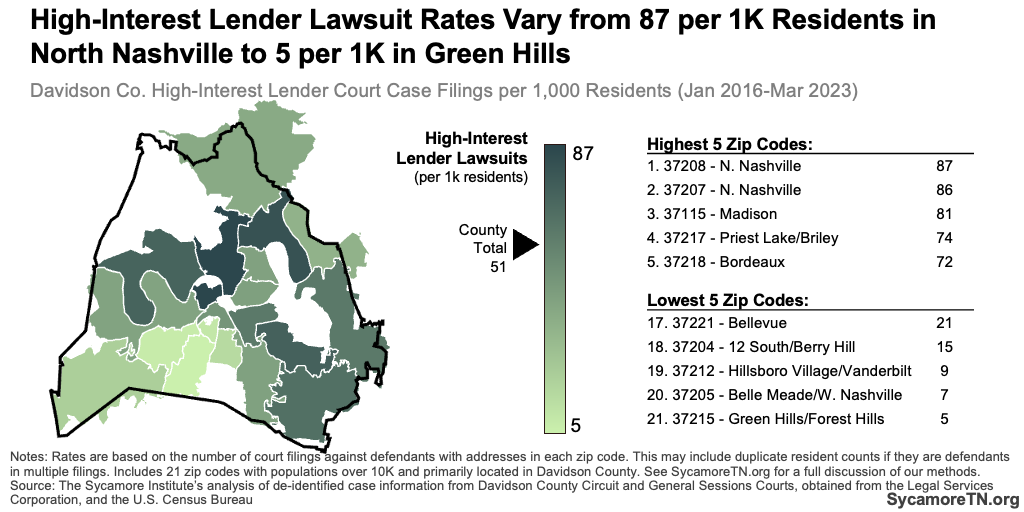
Figure 19
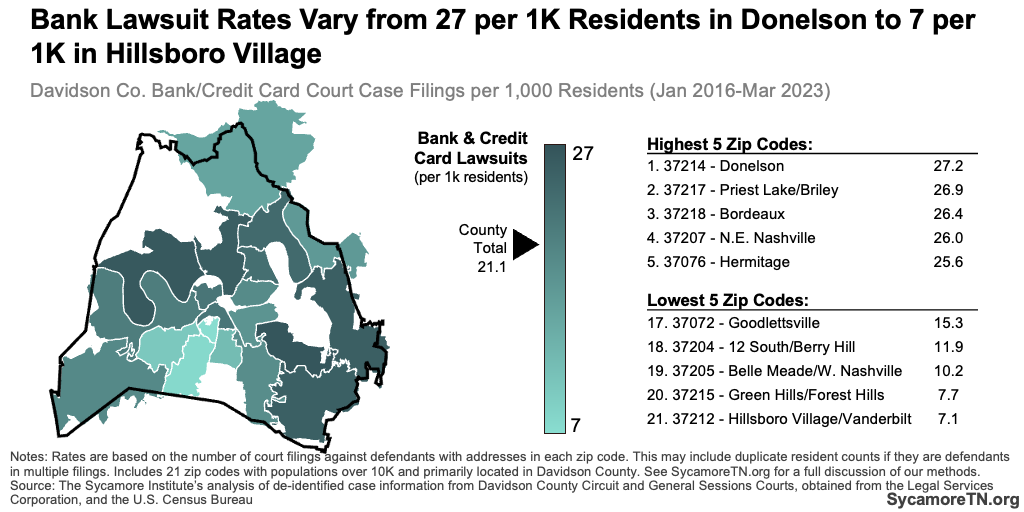
Figure 20
Figure 21
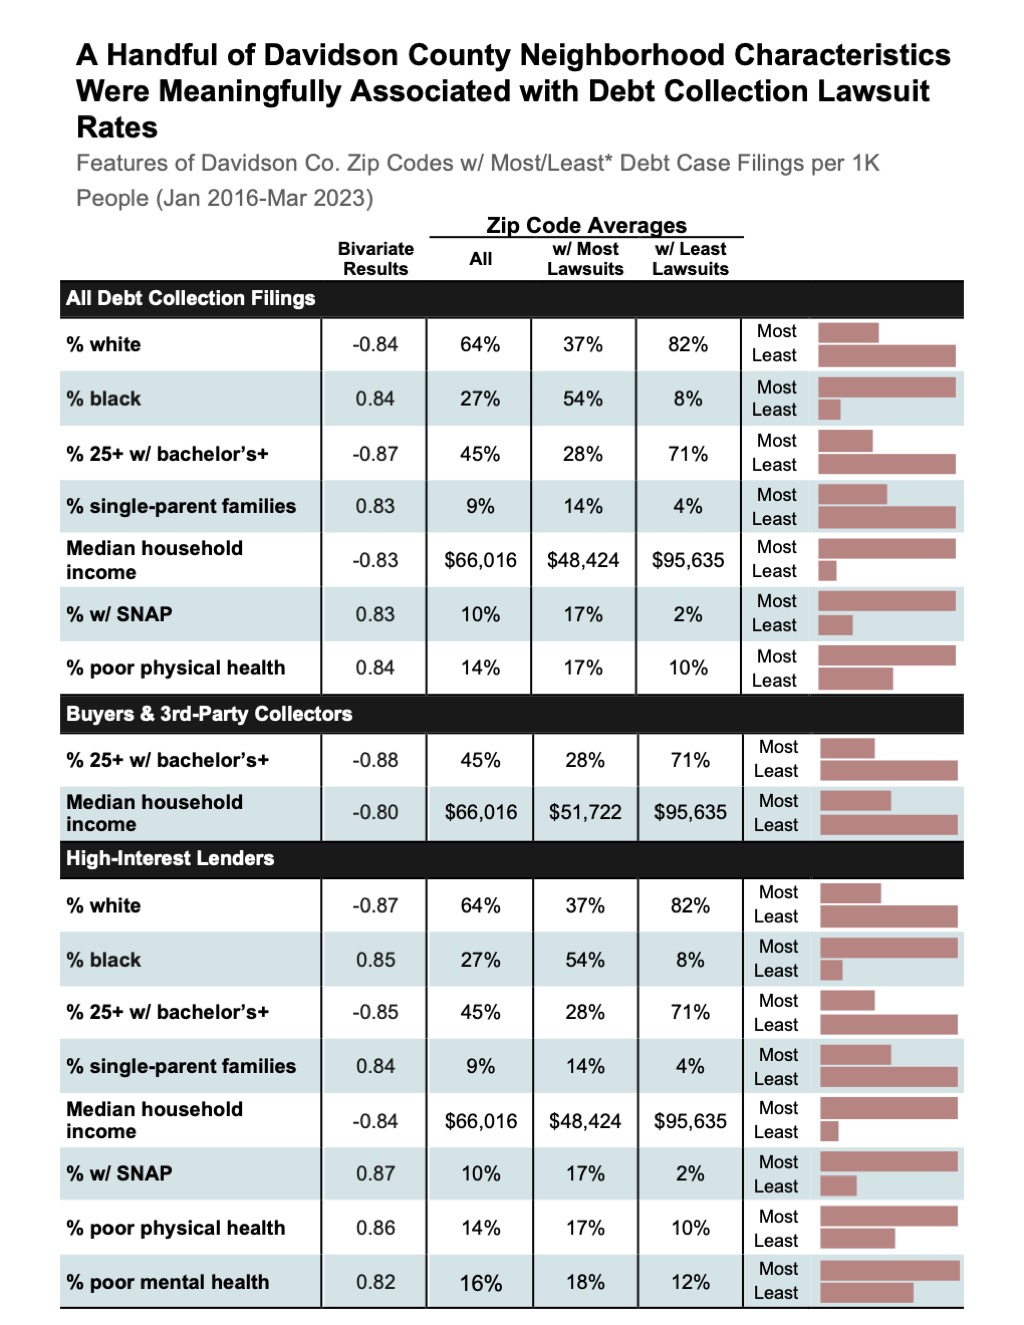
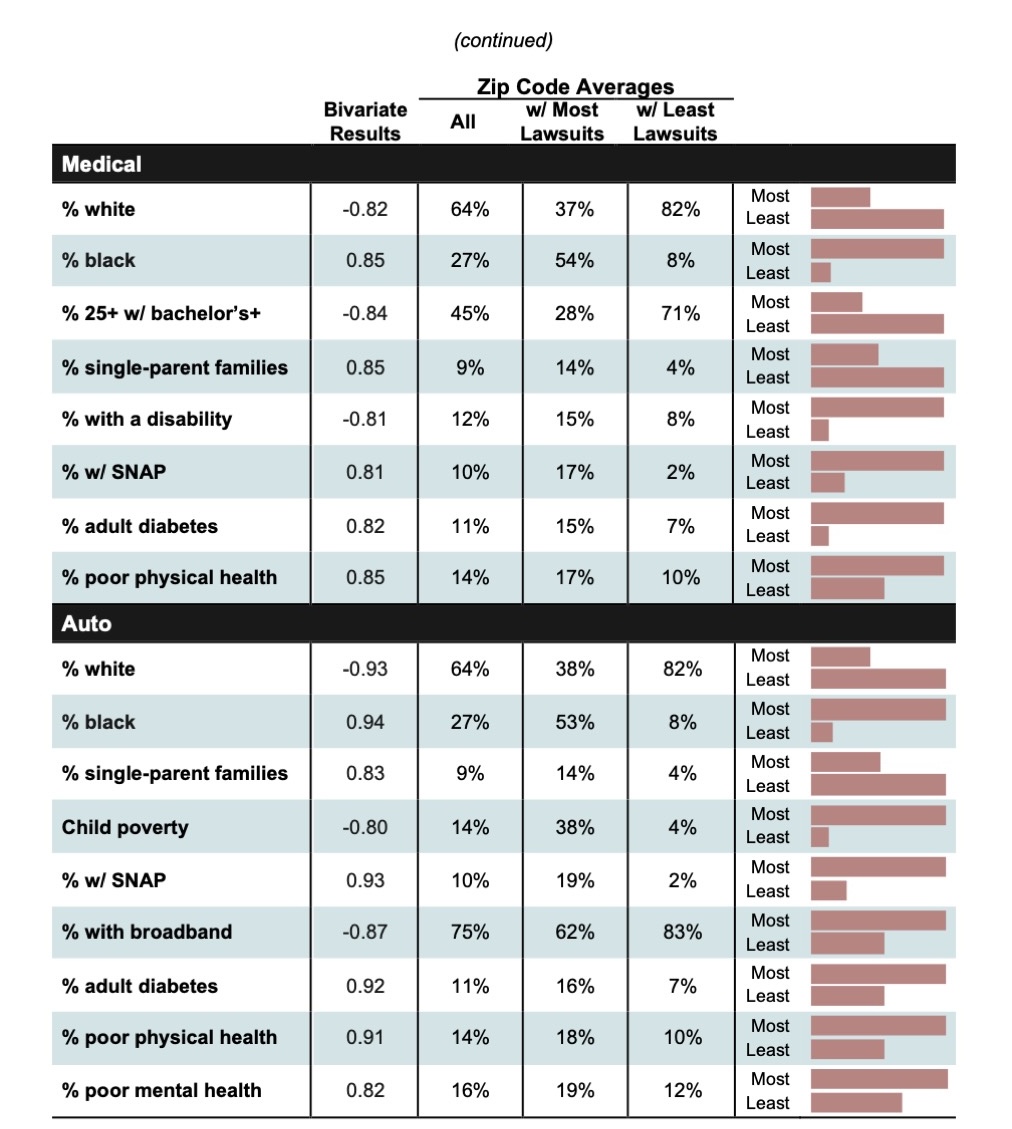
Among nearly 40 neighborhood characteristics we explored, just a handful emerged as having a meaningful association with debt collection case filing rates. We looked at 39 zip code-level metrics representing demographics, family structures, economic well-being, educational achievement, workforce and jobs, transportation, housing, use of services and supports, population changes, and health. Some – but not all – were associated with higher rates of debt collection lawsuits filed against defendants living in those zip codes. (3) (4) (6) (7) (8) See the Appendix for a full list of the metrics we explored, definitions, sources, and results.
The Nashville zip codes with the highest lawsuit rates had more black residents, single-parent families, lower incomes and education levels, poorer health, and greater reliance on food stamps (also known as the Supplemental Nutrition Assistance Program or SNAP) (Table 1). These findings are consistent with similar studies from other states. (4) (5) Meaningful associations with these characteristics, however, varied across debt types:
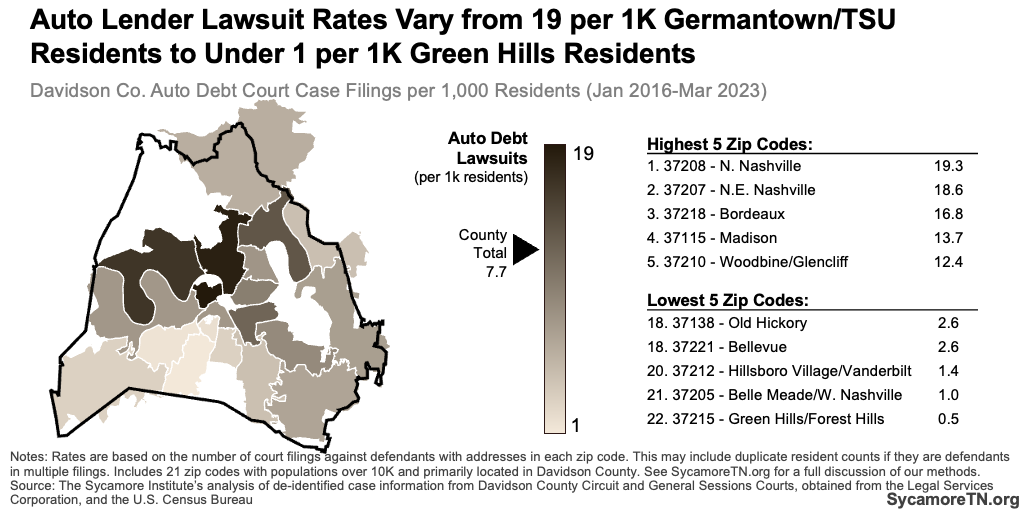
- High-interest lender, medical debt, and auto lender case rates shared many of the same associations as overall debt collection case rates. Notably, higher high-interest lender case rates were also associated with higher rates of poor mental health. Higher medical debt case rates were associated with higher rates of disability and adult diabetes, and higher auto loan case rates with higher child poverty and lower access to broadband.
- Higher debt buyer/collector case rates were only associated with lower education and income levels.
- Bank and credit card case rates had no meaningful associations with the characteristics we explored.
Table 1
What It Could Mean
These findings give us imperfect insights into debt collection practices and financial security.
Financial Security
Our analyses give us some insights about who in Nashville may be most affected by different types of debt, variations in access to credit, and overall financial security. The following are some potential explanations, but all would require further investigation to confirm:
Possible Explanations for Our Findings
- Residents of lower-income neighborhoods need access to small loans but have difficulty paying them back — at least as the options are structured today.
- Predictably, those with lower incomes may be more likely to have delinquent debt. The absence of meaningful associations with poverty rates, however, may mean that certain types of debt are a greater challenge for those with lower incomes but above poverty thresholds. It may be that impoverished individuals have less access to the types of credit represented by these lawsuits, or access to public programs may protect them from specific types of debt (e.g., medical debt and TennCare coverage).
- The auto lender associations suggest that people with the lowest incomes — and those less able to afford other services like broadband — may be the most likely to take out loans they ultimately cannot afford to access a vehicle.
- Lawsuits by banks/credit cards and debt buyers/collectors seem to have a comparatively more widespread impact across neighborhood characteristics — likely reflecting the latter as a traditional credit option that could be for any number of expenses (including those covered by other debt types) and the former as encompassing all debt types.
- The results suggest that medical debt lawsuits – and, by extension, medical debt – in Davidson County may be associated with having more medical needs.
A similar review of Shelby County cases did not find all the same correlations.
Debt Collection Practices
Debt collection lawsuits may tell as much about business models and debt collection practices as they do about delinquent debt and financial security. There are no uniform standards for when a creditor may file a lawsuit and no requirements for what types of efforts most creditors must exhaust before suing someone (except certain hospitals). As a result, these findings may partially reflect the degree to which different kinds of collectors rely on courts as a routine collection mechanism that allows them to garnish wages and assets directly. Prior studies show that certain collector types are more likely to take debtors to court than others. (11) (9)
Regardless of what may be driving the lawsuits, they can create challenges for both courts and the people sued. While the window covered by our data shows a decline in cases, reports at a national and state level indicate an increasing reliance on courts for debt collection. (5) (4) This can overwhelm courts and divert resources from other civil cases. (7) National studies also highlight several aspects of debt collection lawsuits that adversely impact those sued, including:
- Notification — Individuals may never receive clear or proper notification of a lawsuit. As debts can be sold or contracted out to collectors, plaintiff names may not be familiar and get disregarded.
- Unchallenged Lawsuits — Nationally, most debt lawsuits go unchallenged. In a 2015 Consumer Financial Protection Bureau survey, about 15% of Americans contacted by a debt collector in the past year reported being sued. Of those, only about 26% attended the court proceeding. (7) Some reasons people may not attend include lack of notice or legal representation, receiving incorrect or misleading information, confusion about the alleged debt, resignation to an adverse outcome, and income, job, or travel constraints. (13)(14) When people don’t show up, courts often issue default judgments — ruling in favor of the plaintiff without any substantive review of the facts or defendant circumstances. (13) (7)
- Legal Representation — There is no guaranteed right to legal representation in civil suits, and — as our data show — many people who do challenge them are unrepresented. (14)(13) This often gives debt collectors an advantage, as non-lawyers may not have the expertise to challenge the plaintiff’s allegations. (14) (7) Plaintiffs often drop cases when defendants have representation. (13)
- Inaccuracies — Some studies have reported that suits are brought based on inaccurate or incomplete information about the debt.(13) (14) For example, suits may be brought to collect on debts against the wrong individual or on amounts that have already been paid off. A 2009 review by the Federal Trade Commission found that only about 6% of purchased debt nationally came with any documentation. (13)
- Added Costs — On top of the original debt and any fees and interest that accrue pre-lawsuit, court settlements often add attorney’s fees, court costs, other reimbursable expenses, and post-judgment interest. Any settlement in Tennessee is subject to a pre-determined post-judgment interest rate set by state law — currently at 10.25%. (10) In default judgments, interest can significantly inflate this new total without the defendant’s awareness.(7) These settlements can drag on for years as Tennessee has no time limit for enforcing civil judgments, but they must be renewed by a judge every 10 years. (11)
Parting Words
Debt collection lawsuits are a legitimate business practice that helps ensure people meet their financial obligations and businesses stay afloat. However, when lawsuits are over- or misused, it can create trade-offs for the court system and people facing lawsuits. Court data provide a unique look into consumer creditors’ collection practices and Nashvillians’ financial security. These insights conjure additional questions to understand more about both.
Explore the Data
Explore neighborhood characteristics and compare debt types among zip codes with the interactive dashboard below.
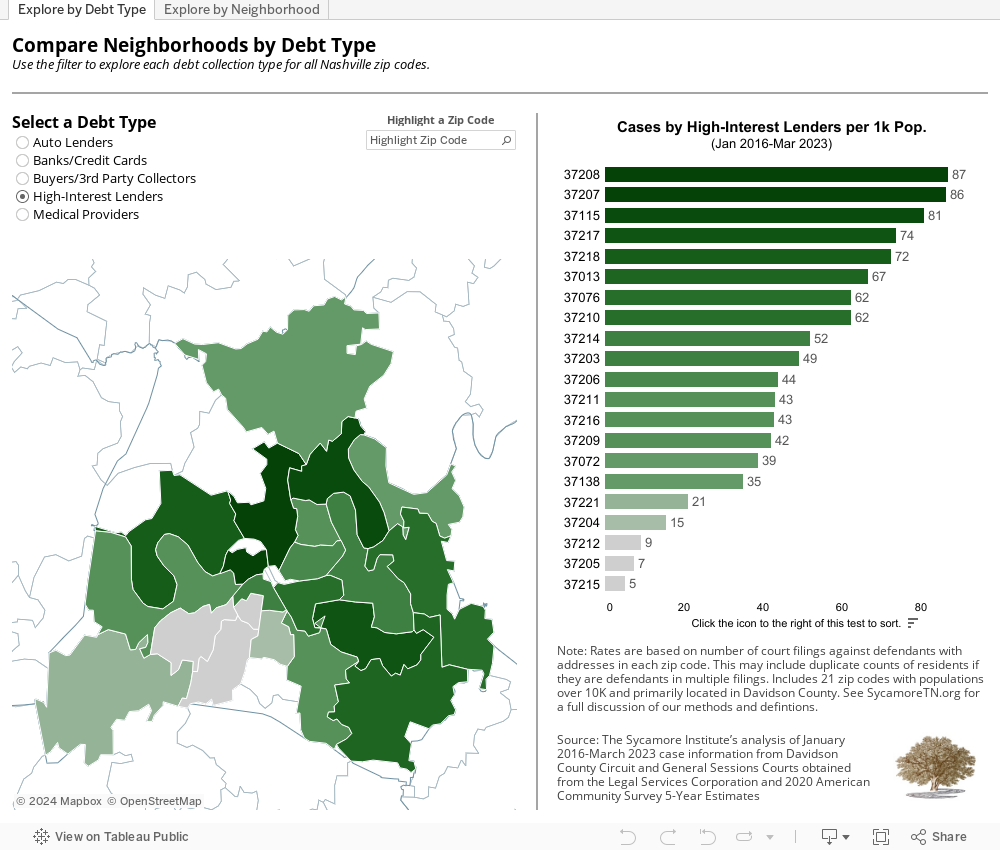
*Figure 3 was updated on January 22, 2024 to correct an error in the total number of Shelby Co. debt collection cases displayed.
References
Click to Open/Close
- Zywicki, Todd. The Law and Economics of Consumer Debt Collection and Its Regulation. Mercatus Center at George Mason University. September 29, 2015. https://www.mercatus.org/research/working-papers/law-and-economics-consumer-debt-collection-and-its-regulation
- Tennessee Bar Association. Court Policies and Procedures. [Cited: December 12, 2023.] https://www.tba.org/?pg=Coronavirus-Information-Center
- Davidson County Circuit and General Sessions Court. Data scraped from Tennessee Case Finder by the Legal Services Corporation. Civil court data obtained on March 28, 2023 under a data user agreement with LSC.
- U.S. Census Bureau. American Community Survey 5-Year Estimates for 2016-2020. December 2021. Obtained from http://data.census.gov.
- Karpman, Michael, Martinchek, Kassandra and Braga, Breno. Medical Debt Fell during the Pandemic. How Can the Decline Be Sustained? Urban Institute. May 2022. https://www.urban.org/sites/default/files/2022-05/Medical%20Debt%20Fell%20during%20the%20Pandemic%20How%20Can%20the%20Decline%20Be%20Sustained.pdf
- U.S. Census Bureau. County Business Patterns Economic Survey. Obtained from http://data.census.gov.
- U.S. Census Bureau. Decennial Census. Data obtained from http://data.census.gov.
- U.S. Centers for Disease Control and Prevention (CDC). PLACES: Local Data for Better Health. Data obtained from https://data.cdc.gov/500-Cities-Places/PLACES-ZCTA-Data-GIS-Friendly-Format-2020-release/bdsk-unrd/about_data.
- Keil, Paul. So Sue Them: What We’ve Learned About the Debt Collection Lawsuit Machine. ProPublica. May 5, 2016. https://www.propublica.org/article/so-sue-them-what-weve-learned-about-the-debt-collection-lawsuit-machine
- Michigan Justice for All Commission. Advancing Justice for All in Debt Collection Lawsuits. https://www.courts.michigan.gov/4ac33d/siteassets/reports/special-initiatives/justice-for-all/jfa_advancing_justice_for_all_in_debt_collection_lawsuits.pdf
- The Pew Charitable Trusts. How Debt Collectors Are Transforming the Business of State Courts. June 2020. https://www.pewtrusts.org/-/media/assets/2020/06/debt-collectors-to-consumers.pdf
- Consumer Financial Protection Bureau. Consumer Experiences with Debt Collection: Findings from the CFPB’s Survey of Consumer Views on Debt. 2017. https://s3.amazonaws.com/files.consumerfinance.gov/f/documents/201701_cfpb_Debt-Collection-Survey-Report.pdf
- Stifler, Lisa and Parrish, Leslie. Debt Collection & Debt Buying. Center for Responsible Lending. April 2014. https://www.responsiblelending.org/research-publication/state-lending-debt-collection-and-debt-buying
- Lieberman, Hannah E. M. and Hannaford-Agor, Paula. Meeting the Challenges of High-Volume Civil Dockets. National Center for State Courts. February 2016. https://ncsc.contentdm.oclc.org/digital/collection/civil/id/138
- TN Administrative Office of the Courts. TN Judgment Interest Rates. https://www.tncourts.gov/node/1232344
- —. Rule 69.04: Execution on Judgments – Extension of Time. Tennessee Rules of Civil Procedure. July 1, 2016. https://www.tncourts.gov/rules/rules-civil-procedure/6904
- Akoglu, Haldun. User’s Guide to Correlation Coefficients. Turk J Emerg Med 18(3): 91-93. September 2018. https://www.ncbi.nlm.nih.gov/pmc/articles/PMC6107969/#bib4
- Davidson County Circuit Court Clerk. General Sessions – Civil Division. December 11, 2023. https://circuitclerk.nashville.gov/general-sessions-clerk-civil/
- Tennessee Courts. About the Trial Courts. December 11, 2023. https://tncourts.gov/courts/circuit-criminal-chancery-courts/about
- Consumer Financial Protection Bureau. What is a Debt Collector and Why Are They Contacting Me? August 2, 2023. https://www.consumerfinance.gov/ask-cfpb/what-is-a-debt-collector-and-why-are-they-contacting-me-en-330/
- Tennessee Office of the Attorney General. Consumer Military Guide: Payday Lending and Rent-to-Own. https://www.tn.gov/content/dam/tn/attorneygeneral/documents/consumer/militaryguide/chapter05.pdf
- Rios, Charla. Red Alert Rates. Center for Responsible Lending. June 2023. https://www.responsiblelending.org/sites/default/files/nodes/files/research-publication/crl-red-alert-rates-payday-ratecap-map-jun2023.pdf