Sycamore recently co-hosted a fascinating conversation with renowned economist Raj Chetty on economic opportunity and COVID-19. Researchers like Dr. Chetty and others at Opportunity Insights are tapping into extremely large datasets from novel sources to understand things like economic opportunity and the impact of public policies – sometimes in nearly real-time. This brief highlights lessons and insights from some of this research on the American dream of upward mobility and the coronavirus recession’s impact in Tennessee.
Key Takeaways
- Children in Tennessee are less likely than kids from similar families nationwide to out-earn their parents in adulthood.
- Some neighborhoods offer much better prospects than others.
- The best places for upward mobility tend to have higher socioeconomic status, more married parents, and high employment rates – regardless of circumstances in a child’s own home.
- However, black and white children from the same neighborhoods and income levels often have very different rates of upward mobility.
- Timely information about the economic effects of the pandemic can help policymakers craft responses to mitigate longer-term negative impacts on economic opportunity.
When kids grow up, are they likely to earn more than their parents? Do some neighborhoods give children better prospects than others? Questions like these lie at the heart of Dr. Chetty’s most popular research. Since 1940, the share of children earning more than their parents has dropped from 90% to below 50%. (1) Researchers from Opportunity Insights, the Census Bureau, and others have analyzed millions of tax records to explore why upward mobility is declining, how it varies across the U.S., and which factors matter most.
Figure 1
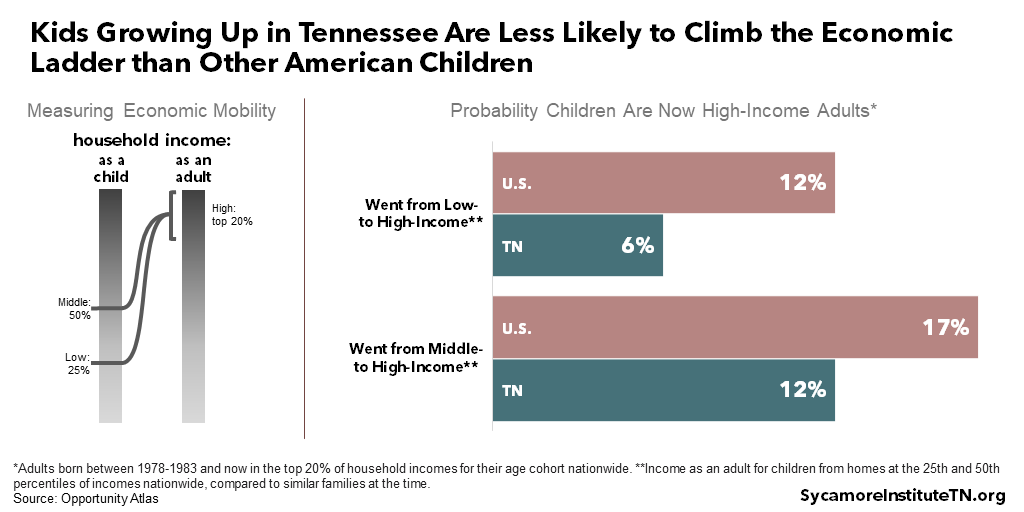
Economic Opportunity In and Across Tennessee
Children from Tennessee are less likely than kids from similar families nationwide to move up the economic ladder from their parents in adulthood (Figure 1). (2) A child growing up in America in the ‘80s and ‘90s in a low-income family had about a 10% chance of moving up and being in a high-income household as an adult. Those from middle-income families had about a 17% chance. (3) A child growing up in Tennessee had about a 6% and 12% chance, respectively. (4) Researchers also looked at comparisons within states and found similar results. (5) [i]
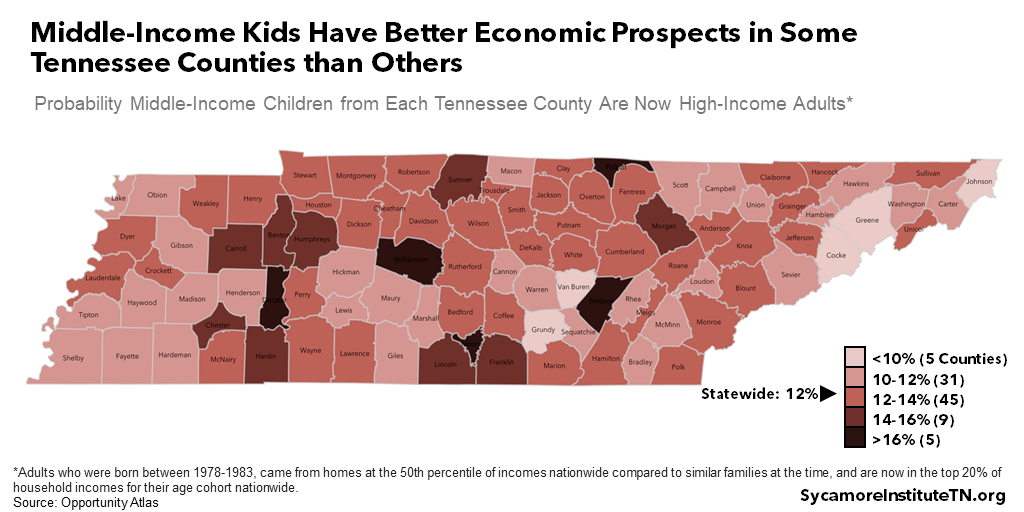
Economic mobility varies across the state. The odds that a low-income child became a high-income adult ranged from 3% for children who grew up in Lake County to 13% for those from Moore County (Figure 2). The chances of moving from middle to high ranged from 8% for those from Grundy County to 19% for Moore County (Figure 3). (2) This variation is even greater at the neighborhood level (discussed below).
On average, there isn’t much difference across Tennessee’s counties based on geography or population density. Counties in Middle Tennessee tended to have the highest rates of economic mobility, but their average advantage over the rest of the state was just one percentage point. Meanwhile, there is little difference, on average, in the economic prospects for children from urban counties and those from more rural ones. (6) (2) (7)
Figure 2
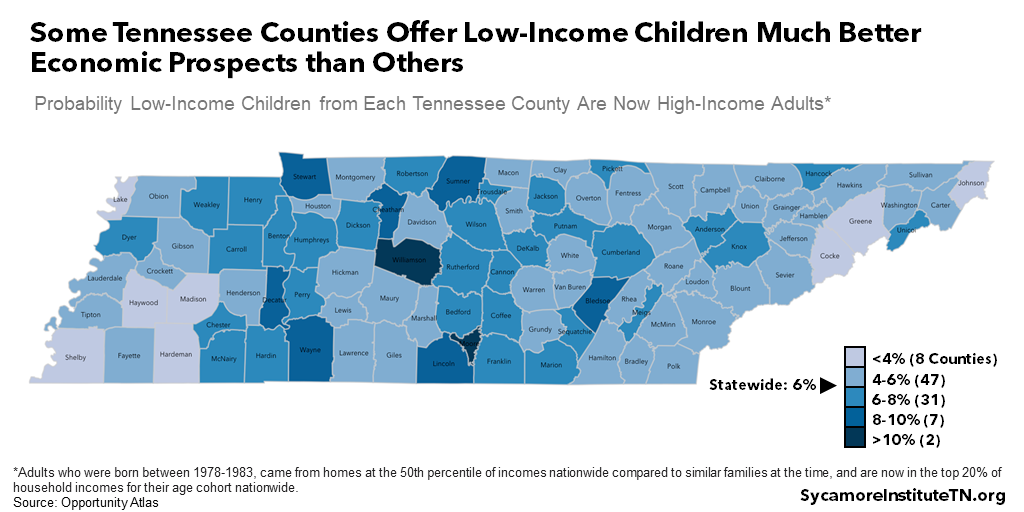
Figure 3
Economic Opportunity Across Neighborhoods
The biggest differences in economic mobility in Tennessee occur between neighborhoods – often just miles apart in the same city. Take these examples from Tennessee’s four largest cities for households in the same income bracket but different neighborhoods:
- Memphis (Figure 4) – A child who grew up in a low-income home in Midtown had about a 16% chance of becoming a high-income adult. One mile away in North Memphis, a low-income child had less than a 1% chance. The odds of moving from middle- to high-income were 19% for kids from Midtown and less than 1% for those from North Memphis. (2)
- Nashville (Figure 5) – A child who grew up in a low-income home in Green Hills had a 17% chance of becoming a high-income adult. A low-income child growing up in the College Heights—Clifton area just four miles away had about a 1% chance. The odds of moving from middle to high-income were 20% for kids from Green Hills and 2% for those from College Heights—Clifton. (2)
- Knoxville (Figure 6) – A child who grew up in a low-income home in West Hills had a 15% chance of becoming a high-income adult. About eight miles away in Morningside, a low-income child had about a 2% chance. The odds of moving from middle to high-income were 11% for kids from West Hills and 5% for those from Morningside. (2)
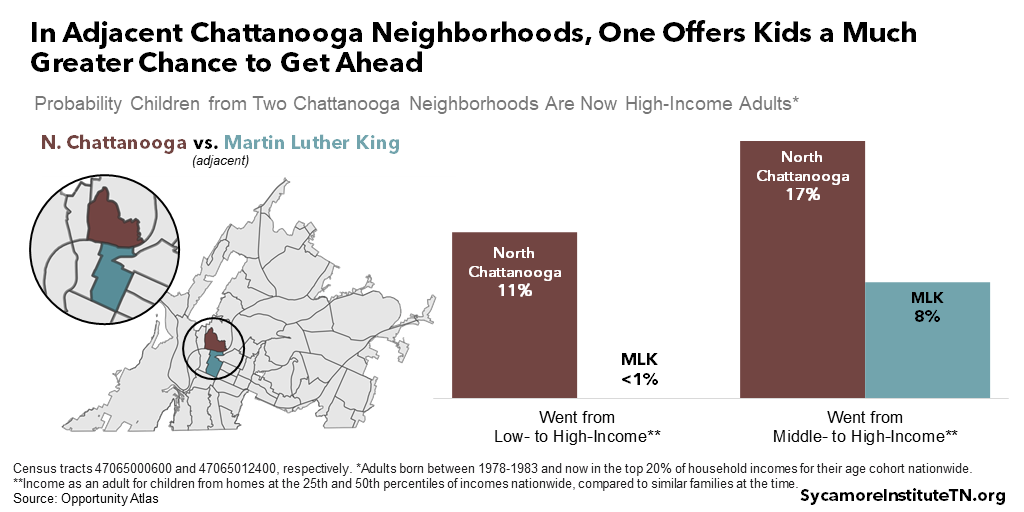
- Chattanooga (Figure 7) – A child who grew up in a low-income home in North Chattanooga had an 11% chance of becoming a high-income adult. A low-income child growing up in the Martin Luther King (MLK) area a mile away had virtually none. The odds of moving from middle to high-income were 17% for those from North Chattanooga and 8% for those from MLK. (2)
Figure 4
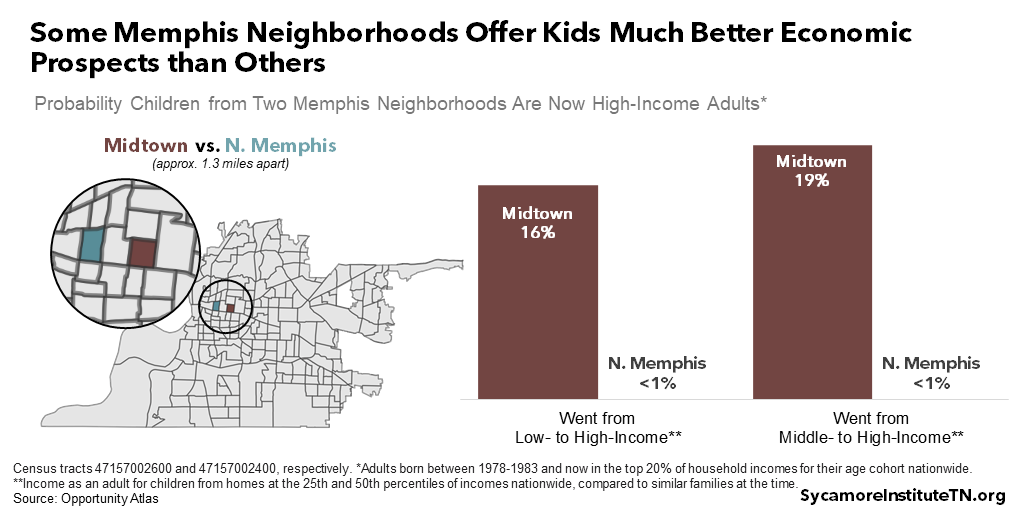
Figure 5
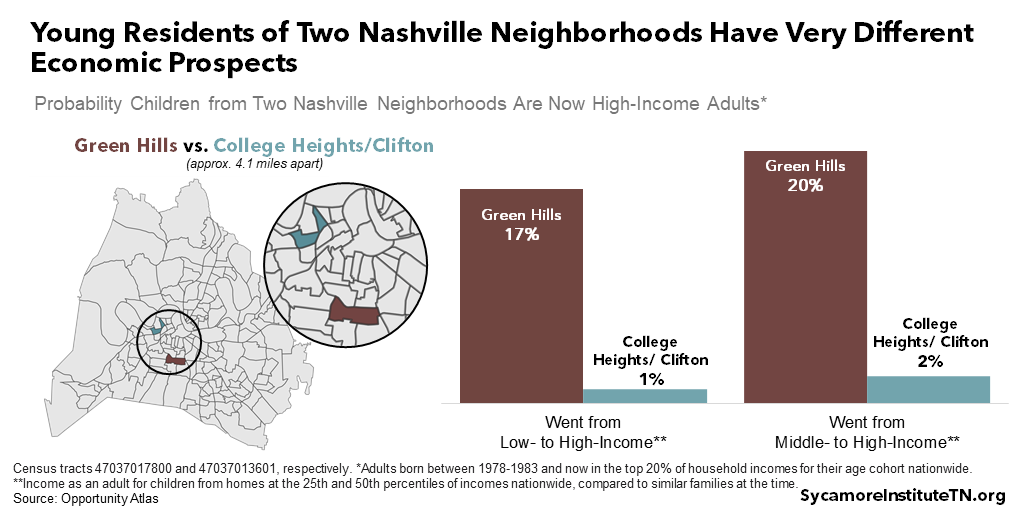
Figure 6
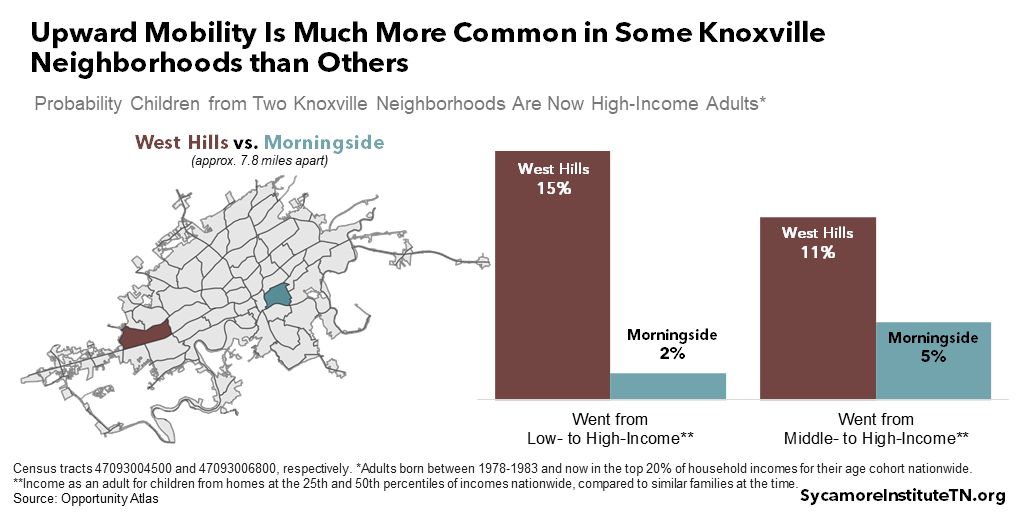
Figure 7
How Neighborhoods Influence Upward Mobility
The best neighborhoods for upward mobility tend to have residents with higher socioeconomic status, more married parents, and high employment rates, according to Chetty’s research. These trends persist regardless of circumstances in children’s own homes.
- Higher Socioeconomic Status – No matter their own socioeconomic status, children in neighborhoods with higher incomes, lower rates of poverty (Figure 8), and higher levels of education tend to have better economic prospects. (8)
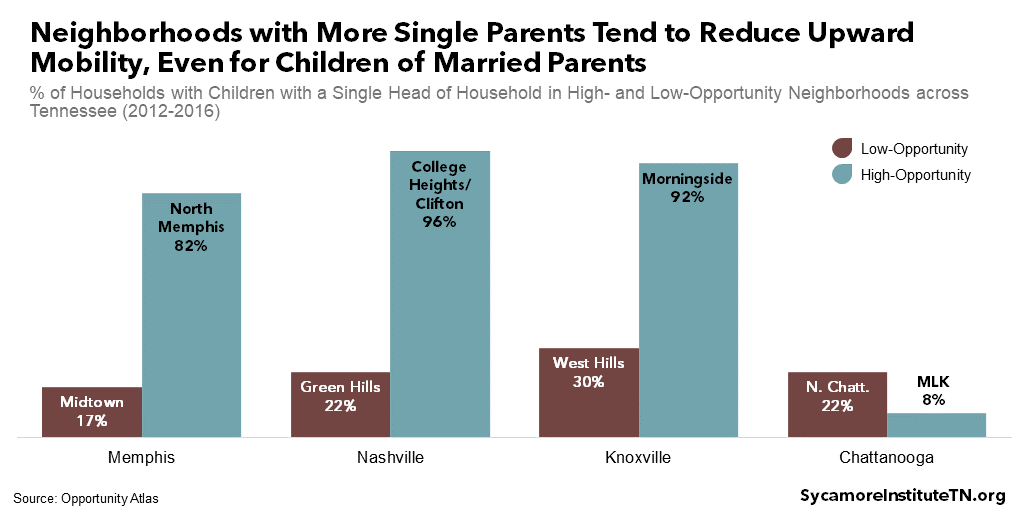
- Family Structures – Whether or not a child’s own parents are married, their prospects for moving up the economic ladder improve when they live in neighborhoods with more married couple families and fewer single parent families (Figure 9). (8)
- Employment Rates – Regardless of wage levels, neighborhoods where more people are employed tend to produce better economic outcomes for their children. And while job availability within the local labor market matters, the availability of jobs in the immediate neighborhood seems to have little impact. (8)
Figure 8
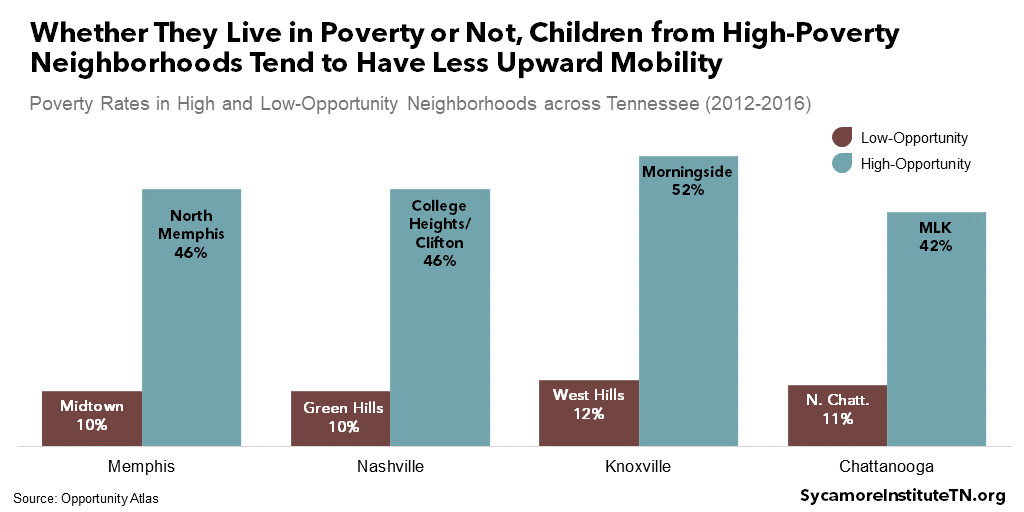
Figure 9
Economic Opportunity by Race in Tennessee
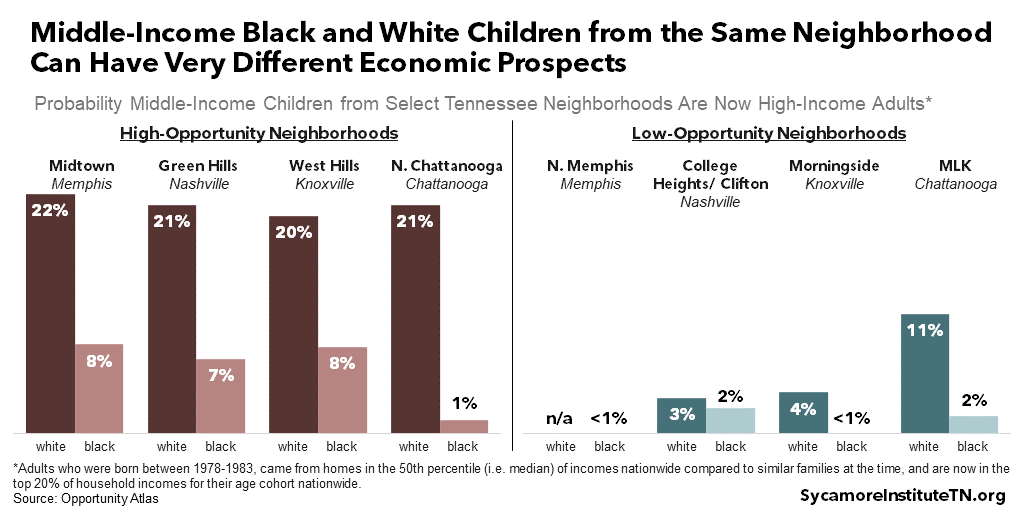
Black and white children from the same neighborhoods and income levels often have very different rates of upward mobility. Figure 10 shows the odds of becoming high-income adults for middle-income black and white children from the neighborhoods discussed above. North Chattanooga provides the most notable difference among these examples. In that neighborhood, middle-income children overall had a 17% chance of becoming high-income adults, but the odds were 21% for the white kids in this cohort and about 1% for the black kids. Nationally, black children from high-income families are as likely to fall to the lowest income quintile in adulthood as they are to stay in the highest – due in particular to the downward mobility of black men. (9) (10)
Data on other racial and ethnic groups are not available for much of Tennessee.
Figure 10
COVID-19 & Economic Opportunity
During the COVID-19 pandemic, Chetty is using large datasets to show economic activity at a granular level and the effects of policy responses to date. With real-time information from both public and private sources, his team created tracktherecovery.org to track these effects and the impact of public policy. Timely information like this can help policymakers craft responses to mitigate longer-term negative impacts on people’s economic security and upward mobility.
The pandemic has taken an economic toll, hitting Tennessee’s small businesses and low-wage, young, and black workers the hardest. Credit card data show that COVID-19 caused large and immediate drops in spending, particularly in at-risk industries – drops that are likely explained more by people’s risk-aversion than by elected officials’ formal shutdown orders. As a result, gaining control of the pandemic may be the only real path to a full economic recovery in the near future.
Some public policy responses appear to have been more effective than others. More generous unemployment benefits helped spending by lower-income households rebound, but economic activity among high-income households remained low. Other federal relief like stimulus payments and the Paycheck Protection Program appear to have had little impact on consumer spending. (11)
Parting Words
Dr. Raj Chetty’s work offers valuable insights for policymakers at every level of government. The new light it sheds on how economic opportunity varies across the U.S., Tennessee, and each community can help us understand what the path to broader prosperity looks like. While the economic toll of COVID-19 poses extra challenges, having timely evidence on its evolution and the effectiveness of our public policy responses may help policymakers mitigate the long-term economic effects.
References
Click to Open/Close
- Opportunity Insights. The American Dream is Fading: Only Half of Children Today Grow Up to Earn More than Their Parents. [Online] [Cited: October 27, 2020.] https://opportunityinsights.org/national_trends/.
- Opportunity Insights and the U.S. Census Bureau. The Opportunity Atlas. [Online] [Cited: October 27, 2020.] https://www.opportunityatlas.org/.
- Opportunity Insights. All Outcomes at the National Level by Race, Gender, and Parental Income Percentile. [Online] [Cited: October 27, 2020.] Data accessed from https://opportunityinsights.org/data/?geographic_level=0&topic=0&paper_id=1652#resource-listing.
- —. All Outcomes at the County Level by Race, Gender, and Parental Income Percentile. [Online] [Cited: October 27, 2020.] Data accessed from https://opportunityinsights.org/data/?geographic_level=0&topic=0&paper_id=1652#resource-listing.
- Chetty, Raj, et al. The Fading American Dream: Trends in Absolute Income Mobility Since 1940. [Online] December 2016. https://opportunityinsights.org/wp-content/uploads/2018/03/abs_mobility_paper.pdf.
- The Sycamore Institute. Analysis of data from Opportunity Insights and the Tennessee Advisory Commission on Intergovernmental Relations. October 28, 2020.
- Tennessee Advisory Commission on Intergovernmental Relations. Just How Rural or Urban. [Online] 2016. https://www.tn.gov/content/dam/tn/tacir/documents/2016JustHowRuralOrUrban.pdf.
- Chetty, Raj, et al. The Opportunity Atlas: Mapping the Childhood Roots of Social Mobility. [Online] January 2020. [Cited: October 27, 2020.] https://opportunityinsights.org/wp-content/uploads/2018/10/atlas_paper.pdf.
- Chetty, Raj, et al. Race and Economic Opportunity in the United States: An Intergenerational Perspective. [Online] December 2019. https://opportunityinsights.org/wp-content/uploads/2018/04/race_paper.pdf.
- Badger, Emily, et al. Extensive Data Shows Punishing Reach of Racism for Black Boys. The New York Times. [Online] March 19, 2018. https://www.nytimes.com/interactive/2018/03/19/upshot/race-class-white-and-black-men.html.
- Chetty, Raj, et al. How Did COVID-19 and Stabilization Policies Affect Spending and Employment? . [Online] 2020. [Cited: October 28, 2020.] https://opportunityinsights.org/wp-content/uploads/2020/06/tracker-summary.pdf.
[i] High-income adults include those born between 1978-1983 and who are now in the top 20% of household incomes for their age cohort nationwide. Their childhood family incomes represent those of their parents when they were children. “Low-income” families were at the 25th percentile of incomes nationwide, compared to similar families at the time. “Middle-income” were those at the 50th percentile (or median). The within-state analysis looked at incomes compared to others within the same state and found similar results.