Key Takeaways
- Tennessee’s state-funded primary care safety net focuses on services that help uninsured adults age 19-64 avoid more costly hospitalizations.
- Each type of primary care safety net provider — local health departments, community health centers, and community- and faith-based clinics — have unique missions, revenue sources, and service capacities.
Definitions of the “health care safety net” vary according to the state, community, or context in question. (1) (2) Depending on the definition, it can include everything from state Medicaid programs to a narrow set of providers offering charity care.
This report focuses on Tennessee’s state-funded primary care safety net, a subset of the broader safety net comprised of state-funded entities that provide primary care services to uninsured adults ages 19‑64.[i] In 2016, about 13% of Tennesseans ages 18-64 (or 535,000) were uninsured. (3) The state-funded safety net includes select community health centers, certain community- and faith-based clinics, and local health departments in 50 of the state’s 95 counties. (4)
Overview of Tennessee’s State-Funded Primary Care Safety Net
Background
Tennessee’s state-funded primary care safety net focuses on services that help uninsured patients avoid more costly hospitalizations. Services include preventive care, chronic disease management, and limited dental care. Research shows that access to and use of primary care services improves patient outcomes, reduces health disparities, and decreases hospitalization and emergency department visits. (5) (6) State funding also supports 4 regional “Project Access” programs that help coordinate specialty or diagnostic care through, for example, charitable or volunteer care resources and partnerships. (4)
Over 500,000 patient encounters were provided by Tennessee’s state-funded primary care safety net providers in FY 2016-2017. Of these, 48% occurred in federally qualified health centers (FQHCs), 34% in community- and faith-based clinics (CFBCs), and 18% in local health departments (LHDs). (4) The number of total patient encounters has ranged from 360,000 in FY 2005-2006 to 657,000 in FY 2013-2014. (Figure 1)
Figure 1
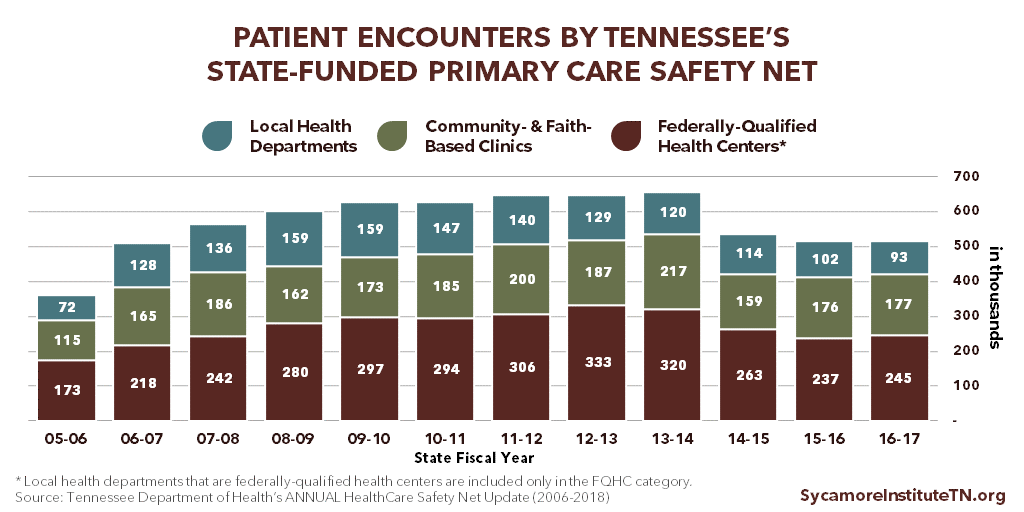
Tennessee codified and expanded state support for the primary care safety net in 2006, at least partly to provide basic care to adults who lost TennCare coverage in the 2005 disenrollment. (10) (11) The 2006 efforts were largely based on recommendations from a task force — representing state agencies, the legislature, counties, local health departments, and health care providers — convened in 2005 to explore options for strengthening the safety net with limited state resources. (10) (11) (12) The recommendations that were ultimately implemented included an expansion of LHDs’ capacity to provide primary care and state funding for FQHCs and other charitable health care providers. (8) (13)
What This Report Covers (and Doesn’t)
This report focuses on a subset of Tennessee’s health care safety net: the FQHCs and CFBCs that receive dedicated funding from the state’s primary care safety net fund and the LHDs that offer primary care services. For simplicity’s sake, we refer to them collectively as “Tennessee’s state-funded primary care safety net.”
Beyond the scope of this report, other providers, funding streams, and programs in Tennessee also contribute to a broader safety net for both health care coverage and services. For example, the Tennessee Department of Mental Health and Substance Abuse Services oversees a safety net for behavioral health services; while Tennessee’s hospitals provide billions in uncompensated charity care and bad debt each year. (32)
Funding
State funding for the primary care safety net comes through the Tennessee Department of Health (TDH). FQHCs and CFBCs receive dedicated primary care safety net funding, while LHDs use money from the general operating budgets they receive though TDH. Information on the breakdown of LHD budgets is not available.
For primary care safety net services at FQHCs and CFBCs, the 2005 task force recommended a combined total of $14.7 million in annual state funding. (12) Since 2006, the amount budgeted by the state has ranged from $6.0 million in FY 2006-2007 to $13.6 million in FY 2007-2008, although actual expenditures have been lower in the years for which expenditure data are available (Figure 2). Recent changes to how funds get distributed are expected to bring actual expenditures closer to budgeted amounts. Most safety net providers also have other sources of revenue, which vary by community and provider type.
Figure 2

Primary Care Safety Net Providers
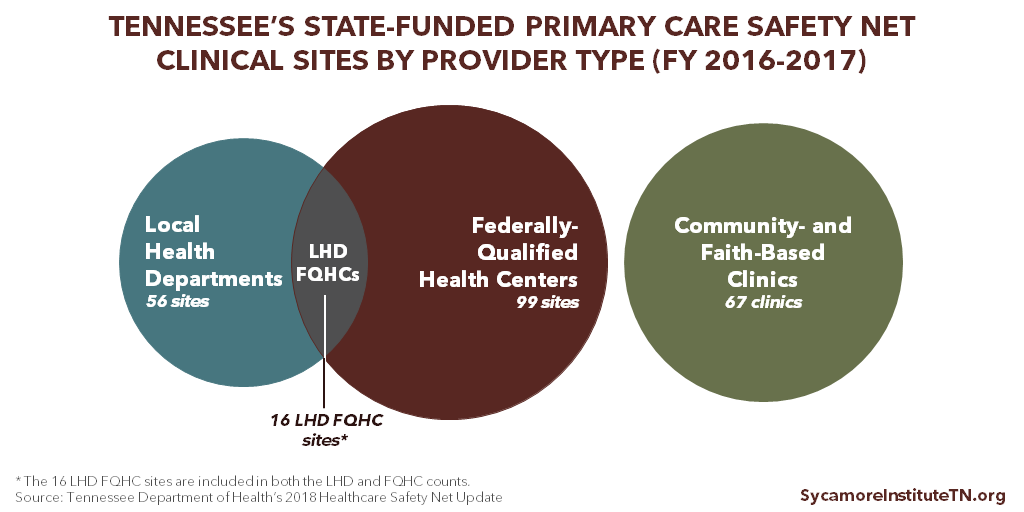
Tennessee’s state-funded primary care safety net included over 200 clinics and care delivery sites operated by LHDs, FQHCs, and CFBCs in FY 2016-2017. (4) (Figure 3) It also supports care coordination in 4 metro areas through Project Access. The remainder of this report describes each provider type in greater detail. To the extent that data are available, it also discusses how state-funded primary care safety net services fit into each provider type’s other functions, services, and funding sources.
Figure 3
Local Health Departments
State and local health departments exist to identify, monitor, and help address community health problems. (15) Each of Tennessee’s 95 counties has a local health department (LHD), of which 89 are run by TDH while 6 in more urban counties are operated locally. (16) The specific work performed by LHDs varies based on local needs and available funding, but all generally provide core public health services like immunizations, community health and disease monitoring, primary prevention and health education, food safety activities, and the federally-funded Women, Infants, and Children (WIC) nutrition program. (17) (18)
In FY 2016-2017, local health departments in 50 Tennessee counties provided primary care services at 56 sites (including 16 sites also designated as FQHCs). (4) The 2006 expansion of primary care services in LHDs prioritized areas of rural west Tennessee with the greatest shortage of primary care providers. (12)
LHDs that provide primary care services do not receive dedicated safety net funding. Instead, primary care services are supported by their operating budgets from TDH, which support a range of public health services provided by LHDs. Information on the breakdown of LHD budgets is not available.
Tennessee is unusual for the fact that a majority of its LHDs provide primary care. Prior to the state’s 2006 expansion of the primary care safety net, 22 LHDs in Tennessee (or 23%) provided primary care services. (8) Today, 53% of Tennessee’s LHDs provide them. Nationally, about 11% of LHDs directly provided comprehensive primary care in 2016, down from 14% in 2005. (19) (17)
Nationwide, LHDs get most of their funding from a mix of federal, state, and local grants and contracts. In 2016, about 75% of LHD revenues nationally were from these 3 sources while 15% came from Medicare, Medicaid, private health insurance, and patient fees. The remainder came from other sources. (17) LHDs often get government grants and contracts for targeted work in specific program areas (e.g. HIV/AIDS prevention). (20) The majority of federal grants, which are a mix of formula grants and competitive grants, are awarded to state departments of health, which then distribute them to LHDs. (21)
Federally Qualified Health Centers
To be designated a federally qualified health center (FQHC), a provider must meet specific federal guidelines for funding, services, fee-structure, and patients. Most FQHCs must serve a medically underserved area or population, provide comprehensive services with a sliding fee scale, have a patient- and community-oriented governing board, and be awarded a competitive grant from the Health Resources and Services Administration (HRSA). The FQHC designation also comes with other benefits like bundled payments under Medicaid and Medicare and opportunities to participate in federal programs like 340B drug pricing. (22) “FQHC look-alikes” are centers that meet all FQHC requirements and qualify for but do not receive HRSA funding.
In FY 2016-2017, state safety net funding supported care at 99 sites operated by FQHCs in Tennessee. (4) In total, Tennessee has nearly 190 clinical care delivery sites operated by 30 federally-funded FQHCs and 1 “FQHC look-alike.” (4) (23) (24) Of those 190 sites, 16 are run by LHDs that have been designated as FQHCs.
The dedicated TDH safety net funding helps FQHCs offset the cost of caring for uninsured adult patients. Funding amounts are based on total available funding and each clinics’ number of eligible patient encounters.
The following information encompasses care supported by both state and federal funding.
FQHC Patients and Staff
Tennessee’s FQHCs served nearly 400,000 patients during 1.4 million clinic visits with over 2,500 full-time staff — including over 1,000 full-time medical personnel — in federal FY 2016. The safety net-supported visits reported for state FY 2015-2016 (Figure 1) would account for roughly 17% of total FQHC visits (although the measurement periods do not perfectly align).
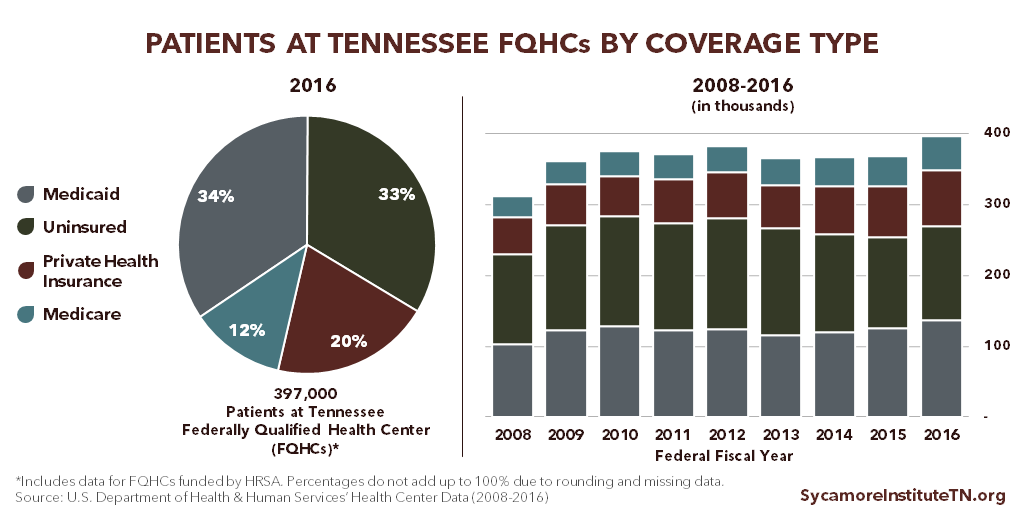
Between 2008 and 2016, patients served by Tennessee FQHCs increased by 27% and clinic visits by 37%. (23) (Figure 4) While the proportion of low-income patients served remained the same during this period, the share of uninsured patients declined. Patients with incomes below poverty and below 200% of poverty respectively accounted for around 56% and 67% of all patients from 2008-2016. The share of uninsured patients fell from 40% in 2008 to 33% in 2016, while small gains occurred for patients enrolled in TennCare (33% to 34%), private coverage (17% to 20%), and Medicare (10% to 12%). (23)
Figure 4
FQHC Revenues
Revenues for Tennessee’s FQHCs come from a mix of public and private health insurance payments and federal, state, and local government support. (Figure 5) In federal FY 2016, Tennessee’s federally-funded FQHCs had combined expenditures of about $235 million ($8 million per FQHC, on average), and their top 3 sources of revenue were federal grants (33%), TennCare (26%), and private health insurance coverage (12%). State and local contracts and grants (which includes state funding for the primary care safety net) accounted for 9%.
As a share of all revenues, private insurance and federal grants increased between 2008 and 2016 while other sources remained steady or declined. This largely reflects trends in the underlying funding sources and patients’ sources of insurance coverage:
- Private health insurance payments grew from 8% of all revenues in 2008 to 12% in 2016. This may reflect, at least in part, the increase in the share of patients with private coverage.
- Federal grants went from 27% of revenues to 33%. This reflects greater federal funding for HRSA’s health center program, which increased from $1.2 billion in federal FY 2010 to about $5.0 billion in federal FY 2016.(25)
- Reimbursements from TennCare declined from 40% of all revenues to 26%.
- State and local grants and contracts grew slightly as a share of all funding, from 7% to 9%.
The Affordable Care Act (ACA) created a dedicated fund for these health centers beginning in federal FY 2011 in expectation that more individuals living in underserved areas would become insured. This dedicated fund provides about 70% of the federal money that Tennessee FQHCs receive. (26)
Figure 5

Community- and Faith-Based Clinics
Community- and faith-based clinics (CFBCs) are non-FQHC charitable clinics that provide health care services to uninsured, underinsured, or underserved individuals for free or at a reduced cost. There is considerable variation in the size and types of services provided at Tennessee’s community-and faith-based clinics. (27)
In FY 2016-2017, 67 CFBCs in Tennessee received state safety net funding. (4) Although a precise number is unknown, other CFBCs also provide care in Tennessee but do not get money from the state’s primary care safety net fund.
The dedicated TDH safety net funding helps CFBCs offset the cost of caring for uninsured adult patients. Beginning in FY 2017-2018, state funding is distributed to both FQHCs and CFBCs based on total available funding and each clinics’ number of eligible patient encounters. Previously, CFBC payments were based on a set rate per-encounter. This new methodology is expected to result in actual expenditures that are more in line with budgeted amounts.
Comprehensive data on CFBCs’ revenue sources, staffing, and services are largely unavailable. Generally, these clinics largely rely on charitable donations and volunteers to operate. (28) Over 1,100 volunteer health professionals and 2,000 lay volunteers helped Tennessee’s CFBCs provided services in FY 2015-2016. (29)
Project Access
Project Access networks coordinate specialty care for uninsured individuals in 4 areas of Tennessee. (4) The 4 networks, which all receive state safety net funding, include Project Access Nashville, Appalachian Mountain Project Access, Hamilton County Project Access, and Knox County Project Access.
State funding only supports the networks’ coordination functions. Any care provided as a result of these services is covered by Project Access hospitals and physician volunteers through donations, charity care, or separate funding streams. According to the Tennessee Charitable Care Network, Project Access networks assisted nearly 11,000 uninsured patients in FY 2015-2016 connecting individuals to over $53 million in donated health care services and over 64,000 patient visits. (29) (30)
Annual Safety Net Report
TDH publishes an annual report on access to care and safety net adequacy — including in rural and underserved areas. (31) These reports cover primary care safety net locations, patient encounters, and patient characteristics, along with information about other safety net services (i.e. dental, HIV/AIDs, behavioral health) and coverage options. The annual report also includes a listing of areas considered underserved by the federal government known as health professional shortage areas (HPSAs) and medically underserved areas (MUAs). (4)
[i] In 2016, 96.5% of Tennessee children under 18 and 99.6% of Tennessee adults 65 and older were insured. (3)
References
- Taylor, Jessamy. The Primary Care Safety Net: Strained, Transitioning, Critical. The National Health Policy Forum. [Online] September 28, 2010. http://www.nhpf.org/library/background-papers/BP79_PrimaryCareSafetyNet_09-28-10.pdf.
- Institute of Medicine. America’s Health Care Safety Net: Intact but Endangered. [Online] 2000. Accessed via https://doi.org/10.17226/9612 .
- U.S. Census Bureau. American Community Survey 1-year estimates. [Online] 2016. [Accessed on April 3, 2018.] Accessed via https://factfinder.census.gov/faces/nav/jsf/pages/index.xhtml.
- Tennessee Department of Health. Healthcare Safety Net Update. [Online] January 2018. https://www.tn.gov/content/dam/tn/health/documents/Safety%20Net%20Report_FY17.pdf.
- Starfield, Barbara, Hi, Leiyu and Macinko, James. Contribution of Primary Care to Health Systems and Health. The Milbank Quarterly. [Online] September 2005. https://www.ncbi.nlm.nih.gov/pmc/articles/PMC2690145/.
- Shi, Leiyu. The Impact of Primary Care: A Focused Reveiw. Scientifica. [Online] 2012. https://www.hindawi.com/journals/scientifica/2012/432892/.
- Tennessee Department of Health. Update on the Health Care Safety Net. [Online] January 15, 2009. https://www.tn.gov/content/dam/tn/health/documents/HealthCareSafetyNet_AnnualReport_2009.pdf.
- —. Update on the Healthcare Safety Net. [Online] January 15, 2014. https://www.tn.gov/content/dam/tn/health/documents/HealthCareSafetyNet_AnnualReport_2014.pdf.
- —. Healthcare Safety Net Update. [Online] January 2017. https://www.tn.gov/content/dam/tn/health/documents/2016_Update_on_the_Healthcare_Safety_Net_Report.pdf.
- The Tennessee Tribune. Bredesen Statement On Executive Order Establishing The Governor’s Task Force On The Health Care Safety Net. [Online] February 2, 2005. Accessed via http://interfaithhealthclinichere.blogspot.com/2012/09/bredesen-statement-on-executive-order.html.
- State of Tennessee. Executive Order by the Governor, No. 22. [Online] January 24, 2005. Accessed via https://sos.tn.gov/products/division-publications/2003-2010-executive-orders-governor-bredesen.
- The Governor’s Task Force on the Healthcare Safety Net. The Recommendations of the Governor’s Task Force on the Healthcare Safety Net. May 24, 2005.
- State of Tennessee. TN Code § 71-5-148 (2016). [Online] Accessed via https://law.justia.com/codes/tennessee/2016/title-71/chapter-5/part-1/section-71-5-148/.
- Tennessee General Assembly. HB 2644. [Online] 2018. [Accessed on April 30, 2018.] http://wapp.capitol.tn.gov/apps/BillInfo/Default.aspx?BillNumber=HB2644&GA=110.
- U.S. Centers for Disease Control and Prevention (CDC) . The Public Health System and the 10 Essential Public Health Services. [Online] September 20, 2017. [Accessed on December 4, 2017.] https://www.cdc.gov/stltpublichealth/publichealthservices/essentialhealthservices.html.
- Tennessee Department of Health. Local and Regional Health Departments. [Online] [Accessed on January 17, 2017.] https://www.tn.gov/health/health-program-areas/localdepartments.html.
- National Association of County and City Health Officials (NACCHO). 2016 National Profile of Local Health Departments. [Online] August 2017. http://nacchoprofilestudy.org/wp-content/uploads/2017/10/ProfileReport_Aug2017_final.pdf.
- Tennessee Department of Health. Services Offered by Local Health Departments. [Online] April 2, 2018. https://www.tn.gov/health/health-program-areas/localdepartments/lrhd/local-services.html.
- National Association of County and City Health Officials (NACCHO). 2005 National Profile of Local Health Departments. [Online] July 2006. [Accessed on December 5, 2017.] http://archived.naccho.org/topics/infrastructure/profile/upload/NACCHO_report_final_000.pdf.
- U.S. Centers for Disease Control and Prevention (CDC). FY 2016 Grants Summary Profile Report for Tennessee. [Online] 2017. https://wwwn.cdc.gov/FundingProfilesApp/Report_Docs/PDFDocs/Rpt2016/Tennessee-2016-CDC-Grants-Profile-Report.pdf.
- —. Public Health Financing. [Online] June 2013. [Accessed on December 4, 2017.] https://www.cdc.gov/stltpublichealth/docs/finance/Public_Health_Financing-6-17-13.pdf via https://www.cdc.gov/stltpublichealth/grantsfunding/index.html#phsf.
- Health Resources and Services Administration (HRSA). What is a Health Center? U.S. Department of Health and Human Services (HHS). [Online] [Accessed on December 1, 2017.] https://bphc.hrsa.gov/about/what-is-a-health-center/index.html.
- —. National Health Center Data (2008-2016). [Online] [Accessed on November 3, 2017.] Accessed via https://bphc.hrsa.gov/uds/datacenter.aspx.
- National Association of Community Health Centers. Key Health Center Data by State, 2016. [Online] November 2, 2017. http://www.nachc.org/wp-content/uploads/2017/11/Key-HC-Data-by-State-2016-11.2.17.pdf.
- Health Resources and Services Administration (HRSA). Congressional Budget Justifications for FFYs 2014-2018. [Online] 2013-2017. [Accessed on December 5, 2017.] Accessed via https://www.hrsa.gov/about/budget/index.html.
- National Association of Community Health Centers. The Health Center Funding Cliff and Its Impact. [Online] September 2017. https://d3n8a8pro7vhmx.cloudfront.net/nachc/pages/297/attachments/original/1506523575/The_Health_Center_Funding_Cliff_and_Its_Impact_September_2017.pdf?1506523575.
- Tennessee Charitable Care Network. Member Charitable Clinic Organizations. [Online] 2017. [Accessed on January 18, 2018.] http://www.tccnetwork.org/find-a-clinic.html.
- The National Association of Free and Charitable Clinics. Getting To Know America’s Free & Charitable Clinics. [Online] June 2016. http://www.tccnetwork.org/uploads/8/0/4/9/80493622/clinic_talking_points_jun_2016_final.pdf.
- Tennessee Primary Care Association / Tennessee Charitable Care Network. Health Care Safety Net Fact Sheet. December 2017. Obtained from the Tennessee Charitable Care Network.
- Switzer-Nadasdi, Rhonda. Letter to Governor Bill Haslam. Tennessee Charitable Care Network. November 2, 2017. Obtained from the Tennessee Charitable Care Network.
- State of Tennessee. TN Code § 68-1-123 (2016). [Online] https://law.justia.com/codes/tennessee/2016/title-68/health/chapter-1/part-1/section-68-1-123/.
- Tennessee Department of Health. 2014 Joint Annual Report of Hospitals Summary Report. [Online] September 26, 2015. https://www.tn.gov/content/dam/tn/health/documents/Annual_Report_on_Hospital_Statistics_2015.pdf.
Featured Image at top by Andrew Skudder