Key Takeaways
- Between 2021 and 2022, Tennessee’s uninsured rate declined overall and across most demographic and socioeconomic characteristics.
- Men, Hispanics, younger adults, the unemployed, and people with less education and income remain the most likely to be uninsured in Tennessee.
The U.S. Census Bureau released new data in September 2023 on income, poverty, education, and health insurance coverage in 2022. These metrics paint a picture of the social and economic circumstances across America. Here’s what stands out from Tennessee’s 2022 health insurance coverage estimates.[1]
Background
In 2022, 91% of Tennesseans had health insurance — more than half of them through an employer (Figure 1). (1) Compared to 2021, the number of Tennesseans with each type of coverage remained relatively stable (Figure 2) — although the share of Medicaid, known as TennCare in Tennessee, declined slightly. Different age groups also relied on each source of coverage to varying degrees (Figure 3). For historical trends going back to 2010, see A Deep Dive into Health Insurance Coverage in Tennessee.
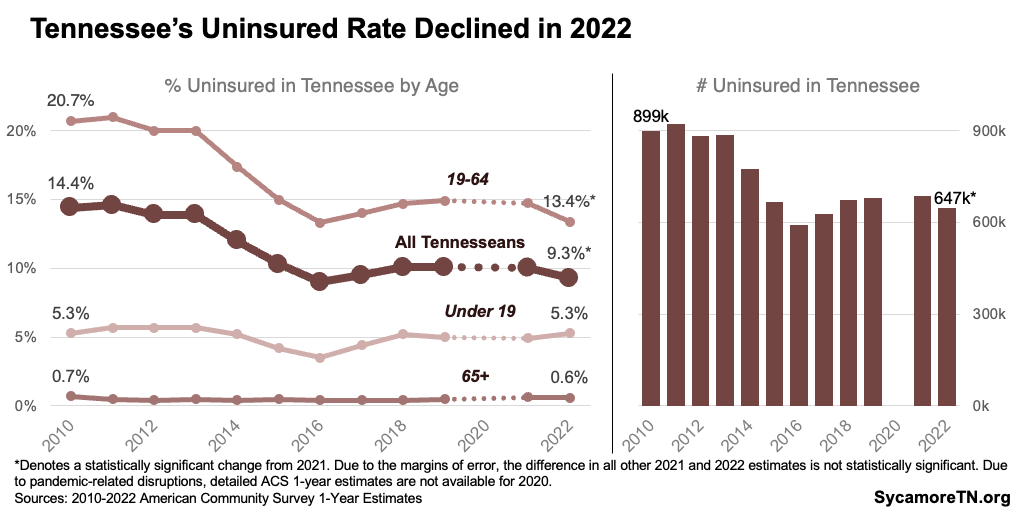
Tennessee’s uninsured rate declined to 9.3% last year (Figure 4). (1) Around 647,000 Tennesseans were uninsured in 2022. This includes about 195,000 people who might become Medicaid-eligible if the state expands the program (ages 19–64 with household incomes under 138% of poverty) — although some may be ineligible due to their immigration status.[2] The uninsured rate declined among adults 19-64 by over two percentage points from 2021 to 2022. Small changes from 2022 in the rates for children and older adults were within the margins of error and not considered statistically significant.
Figure 1
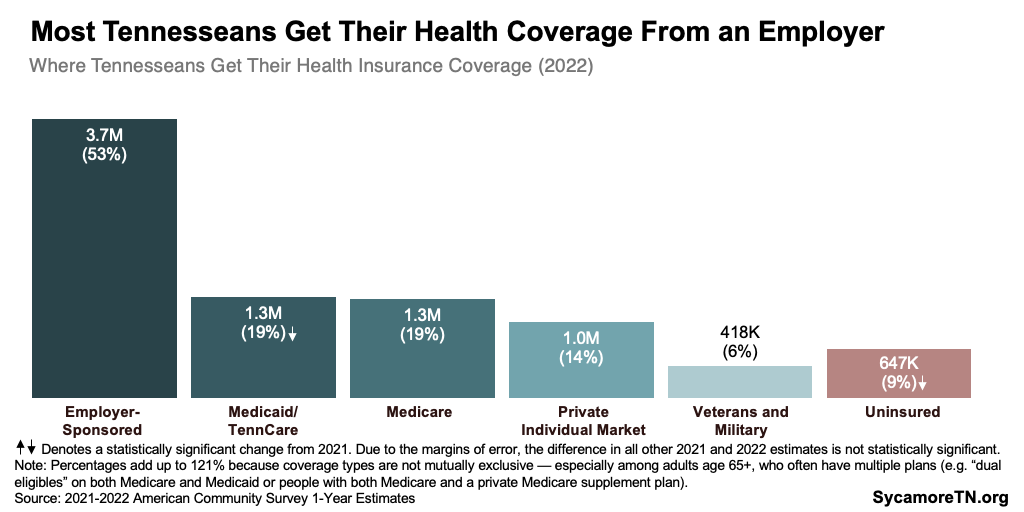
Figure 2
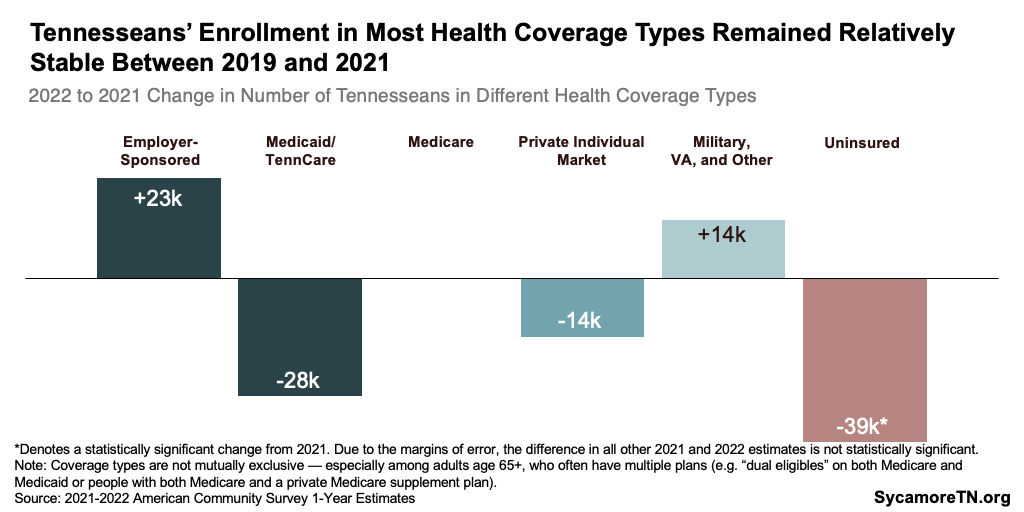
Figure 3
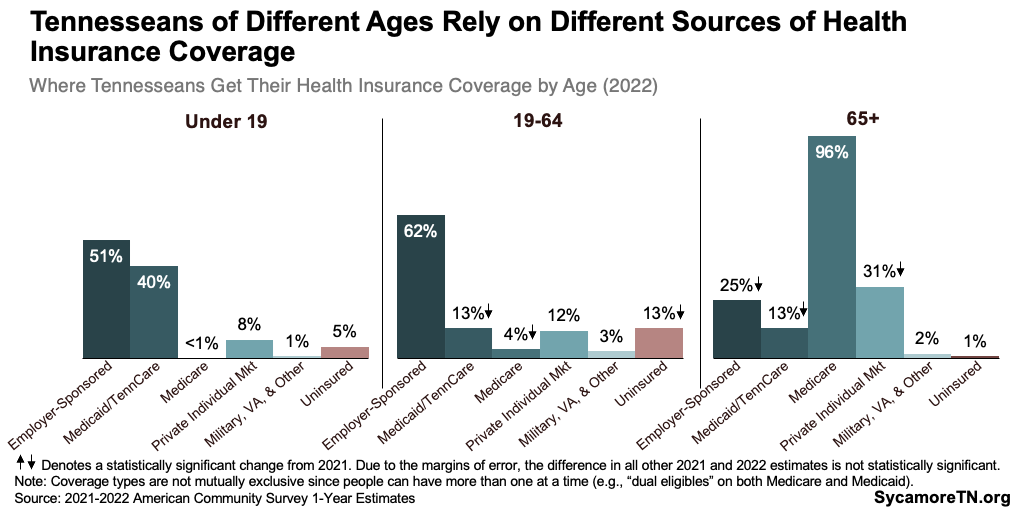
Figure 4
Demographic Variation
Some Tennesseans are more likely than others to be uninsured — including men, Hispanics, younger adults, the unemployed, and those with less education and income (Figures 5 and 6). (1) The uninsured rate declined for many demographic and socioeconomic groups between 2021 and 2022. However, uninsured rates among children under six and those in households making between $75,000-$100,000 experienced statistically significant increases.
Differences in the uninsured rate by race and ethnicity narrowed over the last decade (Figure 7). (1) In 2021, the uninsured rate was 3.2 percentage points higher among black Tennesseans than whites — compared to 4.1 points in 2010. The Hispanic uninsured rate was 22.2 points higher than that of white residents – versus 28.3 in 2010.
Figure 5
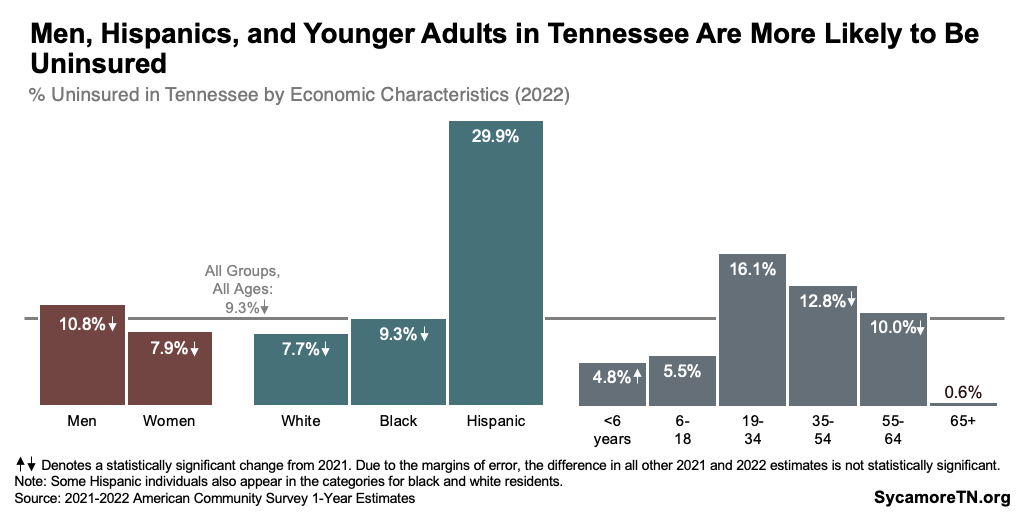
Figure 6
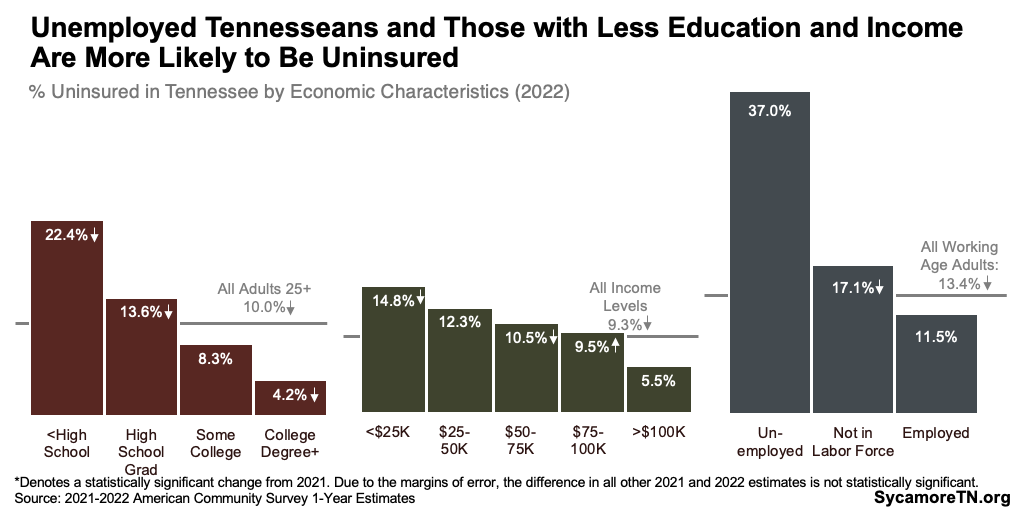
Figure 7
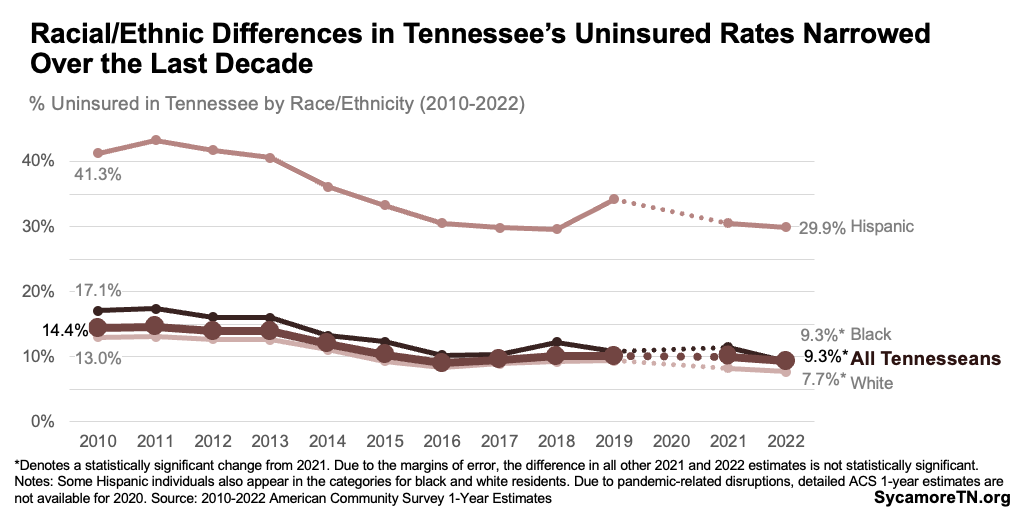
Figure 8
Geographic Variation
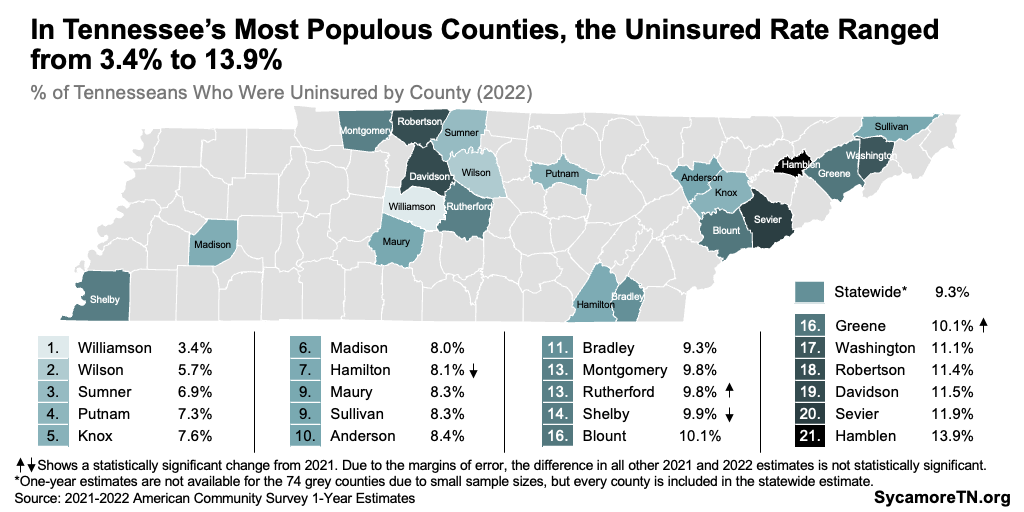
Uninsured rates vary by geography in Tennessee. (1) The Census Bureau’s September data release includes 2022 estimates for counties with populations above 65,000. Among the 21 Tennessee counties with available data, the uninsured rate ranged from 3.4% in Williamson County to 13.9% in Hamblen County (Figure 8). Due to margins of error, the difference in 2021 and 2022 values was statistically significant for only four counties — Hamilton and Shelby Counties’ rates declined while Greene and Rutherford’s increased. See Table A1 in the Appendix for additional county data.
[1] Due to the margins of error, the difference in some 2021 and 2022 estimates is not statistically significant. Due to pandemic-related disruptions, detailed ACS year estimates are not available for 2020. The Census Bureau’s American Community Survey generates estimates based on a sample of the total population. The margin of error measures the likely range of the true value if every person were surveyed. When the error margins for two values overlap, the difference may simply be due to sampling or estimation issues. To learn more about the importance of samples, read our tips for interpreting statistics.
[2] People living in the U.S. without legal authorization (a.k.a. undocumented immigrants) are not eligible for Medicaid. Methods for estimating their share of the uninsured population vary, but one 2019 study estimated that as many as 29,000 uninsured adults in Tennessee under 138% of FPL would not qualify for Medicaid due to their immigration status.
References
Click to Open/Close
- U.S. Census Bureau. 2010-2022 American Community Survey 1-Year Estimates. [Online] September 2023. Available via https://data.census.gov/.