The latest U.S. Census Bureau data for all 95 of Tennessee’s counties continue to show large differences in household income, poverty, education level, and health insurance coverage.
To explore the data for specific counties, use the interactive map and tool at the bottom of this post. If you’re looking for statewide or regional estimates for 2018, go here.
Key Takeaways
- On average, Tennessee’s more densely populated counties and those in Middle Tennessee continue to have higher incomes, less poverty, and more education.
- Most — but not all — counties experienced growth in their residents’ education levels compared to previous estimates, while the majority of counties saw increases in their uninsured rates.
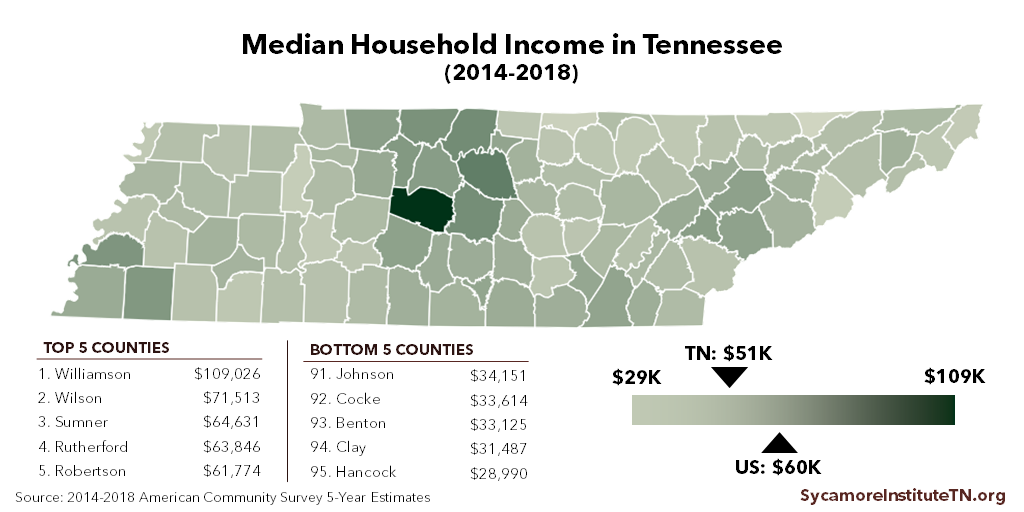
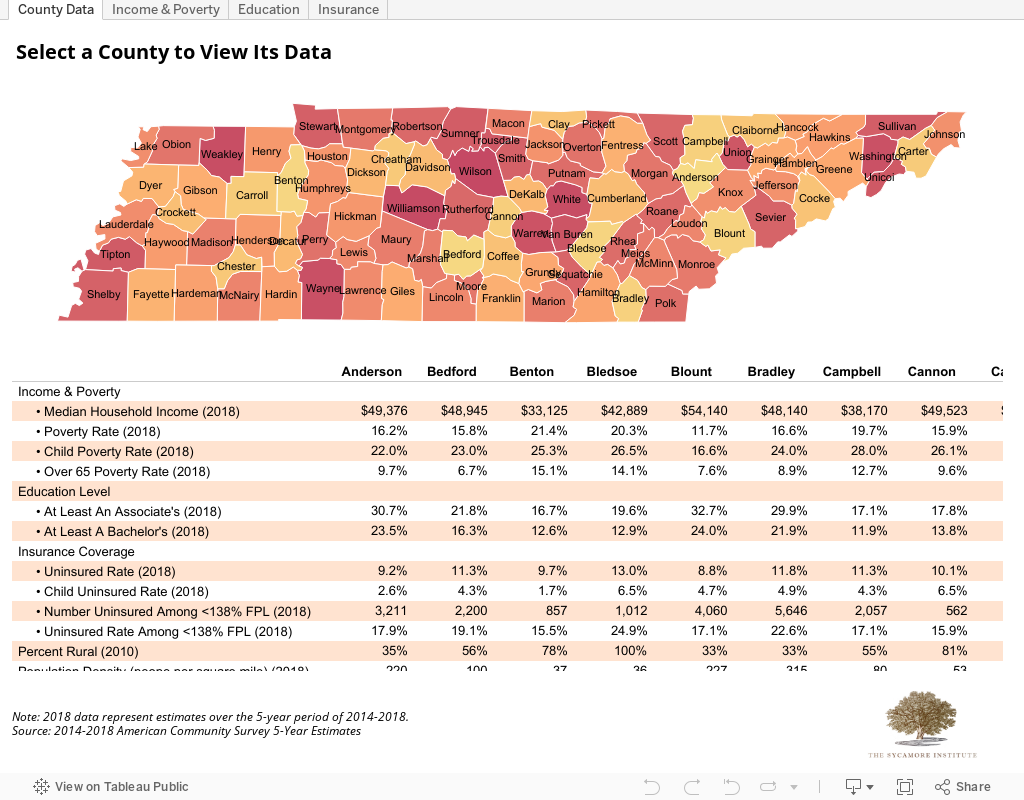
Figure 1
Income and Poverty
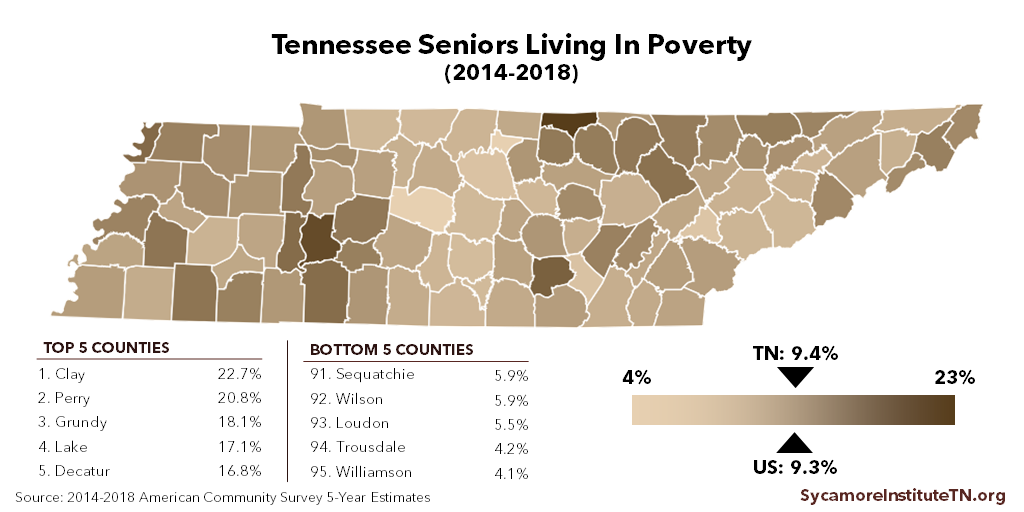
Income and poverty levels vary significantly across the state. For example, median income (where half of all incomes are higher and half are lower) was as high as $109,000 in Williamson County and as low as $29,000 in Hancock County (Figure 1). Many of the same counties with the lowest median incomes had the highest poverty rates (Figures 2, 3, 4). While every county has its own unique circumstances, other notable trends include:
- Suburban Middle Tennessee Counties: Many of the suburban counties surrounding Davidson County in Middle Tennessee have the state’s highest incomes and lowest poverty rates — including Williamson, Wilson, Sumner, and Rutherford Counties.
- Rural Counties: The state’s rural, less densely-populated counties tend to have lower incomes and higher poverty rates than average.
- Urban Counties: The four most urban counties have mixed outcomes. Davidson, Hamilton, and Knox Counties all have above-average median incomes. While Hamilton and Knox Counties also have less poverty than average, Davidson has above-average poverty. Shelby County has an average median income but higher-than-average poverty.
Counties also varied significantly in income changes compared to prior estimates. Almost a quarter of Tennessee’s counties saw median income drop since 2017 (after adjusting for inflation). Van Buren County’s median household income, for example, dropped from an estimated $45,000 (adjusted for inflation) over the 2013-2017 period to $37,000 in 2014-2018 — a 17% reduction. Meanwhile, Trousdale County’s median income grew from $43,000 to $53,000 — a 24% increase.
Figure 2
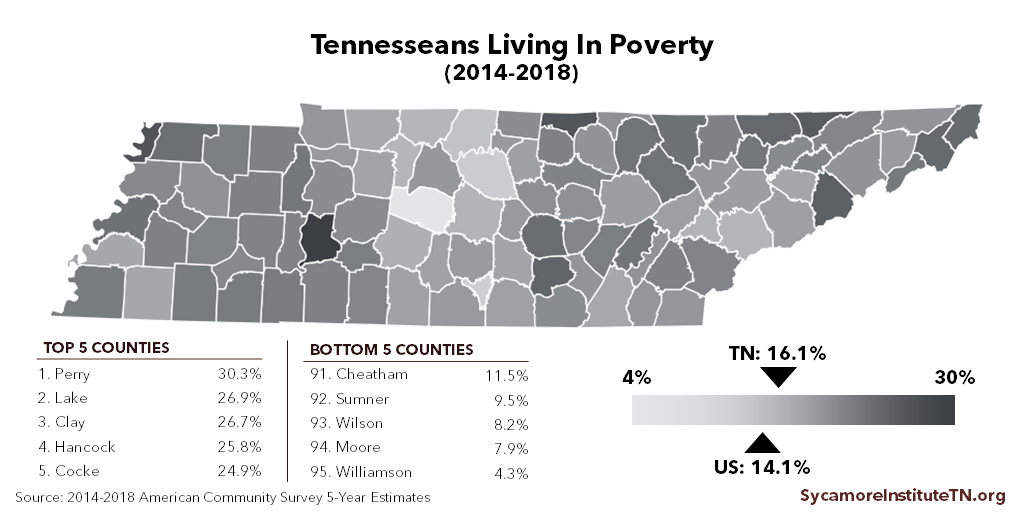
Figure 3
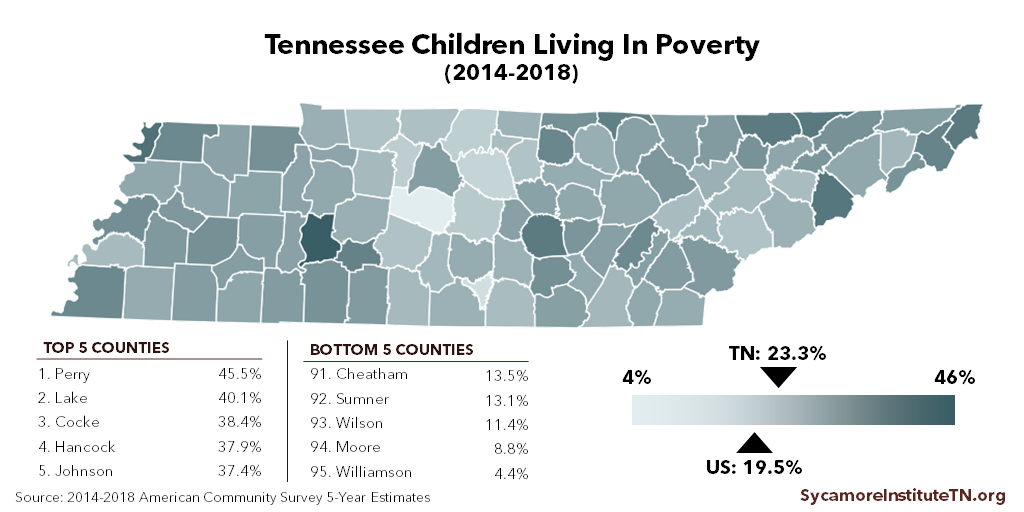
Figure 4
Level of Education
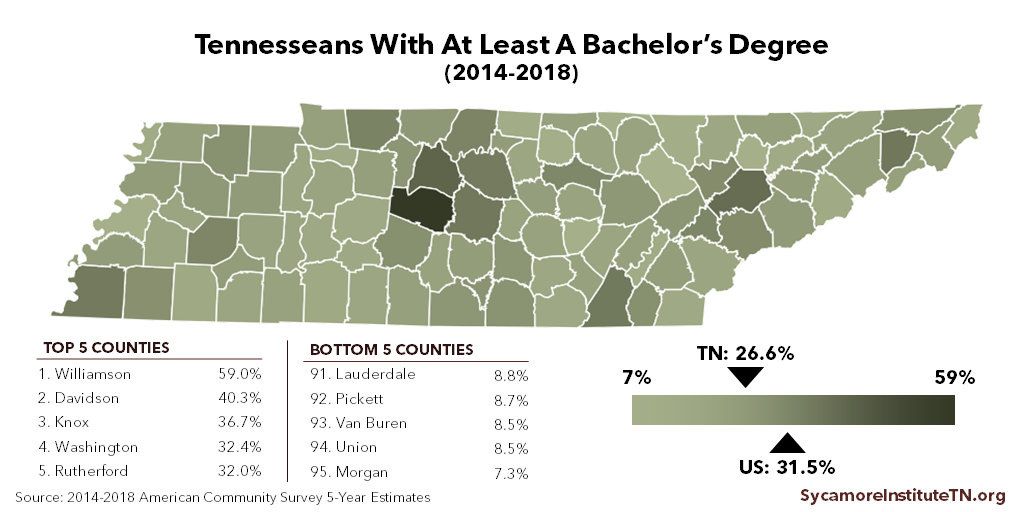
There is considerable variation in levels of education across Tennessee’s 95 counties. For example, about 66% of adults 25 and older in Williamson County had at least an associate’s degree compared with just 13% in Van Buren County (Figure 5). In Williamson County, 59% had at least a bachelor’s degree compared with 7% in Morgan County (Figure 6).
Variation in levels of education is closely tied to urban-rural differences. The most educated populations tend to live in or around the state’s largest and most densely populated counties. Meanwhile, the least densely-populated counties have the lowest rates of residents with an associate’s or bachelor’s degree.
Most — but not all — counties experienced growth in their residents’ education levels compared to previous estimates. However, 19 counties saw declines in the share of residents with at least an associate’s degree between the 2013-2017 and 2014-2018 estimates, and 23 saw declines in those with a bachelor’s degree. Among the largest drops was in Van Buren County where an estimated 13% of adults had at least an associate’s degree and 8% had at least a bachelor’s degree in 2014-2018— down from 16% and 10%, respectively, in the prior period.
Figure 5
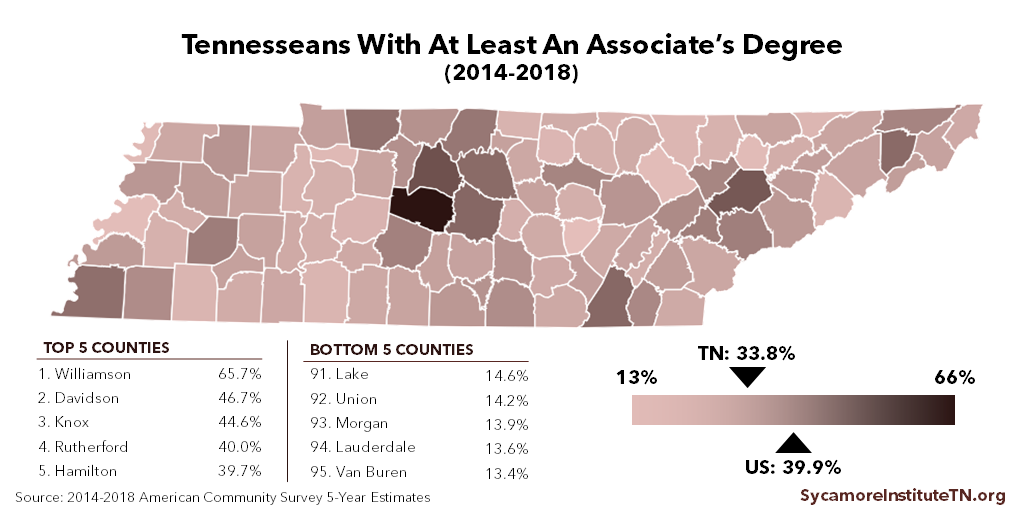
Figure 6
Uninsured Rates
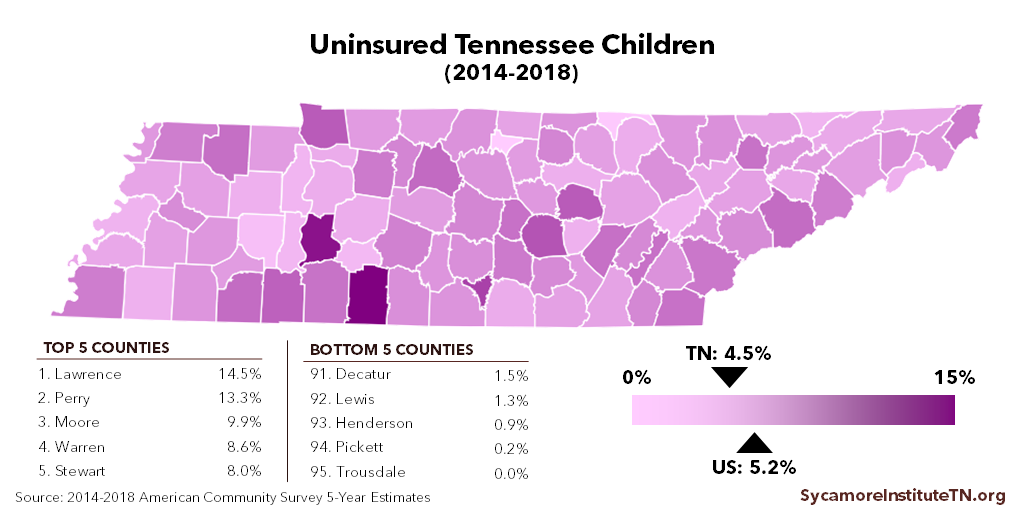
Some counties had significantly higher uninsured rates than statewide averages. For example, about 1 in 6 people in Sevier and Grundy Counties were uninsured — compared with the statewide rate of 1 in 10 (Figure 7). Meanwhile, 14.5% of children in Lawrence County were uninsured —more than three times the statewide rate of 4.5% (Figure 8).
The majority of counties saw increases in their uninsured rates over the previous period. In fact, the overall uninsured rate grew in 74 counties, and 56 experienced increases in the rate of uninsured children. The largest increases occurred in Polk County, where the overall uninsured rate rose from about 9% to 11% between the 2013-2017 and 2014-2018 estimates, and White County, where the uninsured rate among children increased from 3% to 8%.
Figure 7
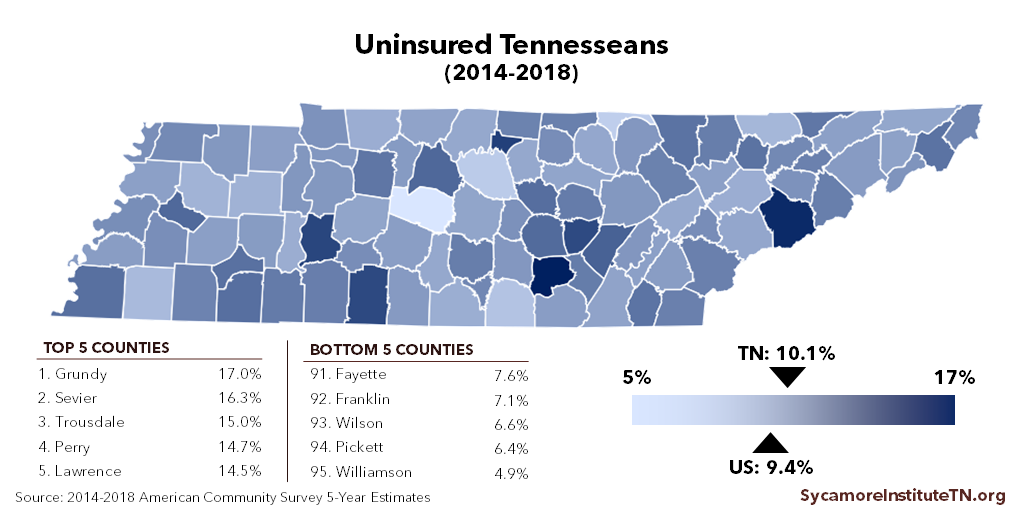
Figure 8
About the Data
The 5-year average data shown here are based on the U.S. Census Bureau’s 2014-2018 American Community Survey 5-year estimates. While many metrics are often discussed in the context of a single year, the Census Bureau does not publish 1-year estimates for areas with small populations, which excludes many Tennessee counties. These multi-year estimates are more reliable than 1-year estimates for areas with smaller populations and provide comparable data for all counties in Tennessee.
References
Click to Open/Close
- U.S. Census Bureau. 2014-2018 American Community Survey 5-Year Estimates. [Online] December 19, 2019. Accessed on December 19, 2019 via http://www.data.census.gov.