Transportation infrastructure comes in many forms and impacts our lives in many ways. Highways, roads, bridges, bikeways, sidewalks, and public transit each offer distinct benefits and trade-offs. One aspect to consider is how transportation systems can directly and indirectly affect health and well-being. Below, we discuss what the research says about several points of intersection between transportation and public health.
Accessing Needed Goods and Services
Access to healthy food, places for physical activity, and health care has a significant impact on individuals’ health and well-being. Some form of transportation – whether public or private– must generally be used to access these goods and services. The need for adequate transportation becomes greater when these resources are not readily available within a community.
Research shows:
- Individuals are less likely to access needed services when they face transportation difficulties.
- Individuals who depend on public transportation with lengthy transit routes, multiple transfers, inadequate or irregular service, or the inability to pay for transit are at an increased risk of foregoing needed services.[1]
- Public transportation that is convenient, fast, and easy to navigate is associated with increased access to health care services and healthy food.[2]
Physical Activity
Physical activity is one of the most important behaviors that drives health and well-being. Regular physical activity is associated with decreased risk of type 2 diabetes, some cancers, cardiovascular disease, and premature mortality.[3] Transportation and infrastructure systems can impact the amount of time and the types of opportunities people have to engage in physical activity.
Research shows:
- The amount of time an individual spends in a car is associated with obesity. Every 60 minutes spent in a car each day increases a person’s odds of being obese by 6%. On the other hand, each mile walked per day decreases the odds of obesity by 7.7%.[4]
- Commute distances of 15 miles or more are associated with increased odds of obesity and decreased odds of meeting physical activity recommendations.[5]
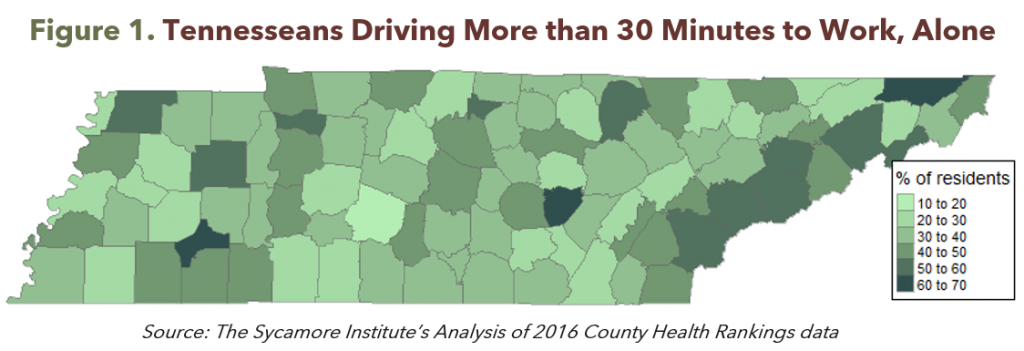
- Long commutes not only impact physical health but are also a source of stress. More time spent in the car means less time for family and friends or physical activity. 33% of Tennesseans drive more than 30 minutes to work each day alone. Residents in Fayette, Tipton, Stewart, Cheatham, Union, and Grainger counties have some of the longest commutes in the state.
- People living in more walkable communities are more likely to use physically active modes of transportation (e.g. walking, biking), have a lower body mass index (BMI), drive less, and produce less air pollution than people who live in less walkable communities. Characteristics of walkable neighborhoods include connected streets with direct routes to places, high residential density, pedestrian-oriented retail, homes near commercial businesses and institutional destinations, and mixed land use.[5]
- 4.5% of Tennesseans’ transportation trips are made by walking or bicycling.[6]
Pollution
Over the last century, air pollution has increased as the number of vehicles on the road has climbed – even with improvements in emissions standards. There is considerable research that connects pollution with a number of adverse health outcomes.
Research shows:
- Air pollution is associated with respiratory diseases such as asthma and lung disease. Populations at greater risk include children, older adults with preexisting respiratory diseases, people who work and exercise outdoors, people who live in close proximity to highways and interstates, and individuals without access to needed health care.[7]
- Neighborhoods that are 0.2 to 0.3 miles from a highway are most affected by air pollution. Living next to a major road is associated with increased risk of asthma, cardiovascular disease, adverse reproductive outcomes, and mortality.[8]
- Minorities and individuals with lower socioeconomic status are more likely to live within 150 meters (0.09 miles) major roads and experience traffic related air pollution.[9]
- Approximately, 0.04% of Tennesseans live within 0.12 miles of a high traffic roadway.[6]
Motor and Pedestrian Injuries and Deaths
The most direct impact of transportation on health is vehicle-related injuries and deaths. Motor vehicle accidents are not limited to cars and their occupants but include accidents involving trucks, vans, busses, pedestrians, and bicyclers. Transportation systems can impact health and well-being in other surprising ways.
Research shows:
- Motor vehicle crashes are the leading cause of death for people between the ages of 1 and 34.[10]
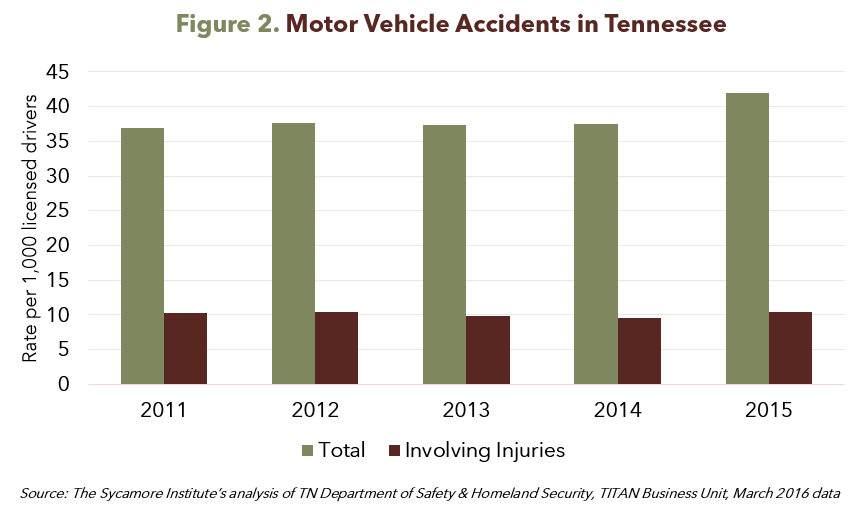
- In 2016, there were 1,042 traffic fatalities in Tennessee.[11]
- As the number of vehicles on the road grows, so too does traffic congestion, motor vehicle injuries, and pedestrian injuries and deaths.[7]
- Pedestrians and bicyclists have an increased risk of motor vehicle-related death than people who are in vehicles. Public transportation is associated with a lower risk of injury and death than traveling in a personal vehicle, but commuting in a personal vehicle is still the most popular method of transportation.
References
Click to Open/Close
[1] Farhang, Lili and Bhatia, Rajiv. Transportation for Health. Race, Poverty & the Environment. 2005/2006. https://reimaginerpe.org/files/13.Lili.Farhang.pdf.
[2]Litman, Todd. Evaluating Public Transportation Health Benefits. Victoria Transport Policy Institute. November 2016. http://www.vtpi.org/tran_health.pdf.
[3] Centers for Disease Control and Prevention. Physical Activity and Health. 2015. https://www.cdc.gov/physicalactivity/basics/pa-health/index.htm.
[4] Andresen, Martin A, Frank, Lawrence D and Schmid, Thomas L. Obesity Relationships with Community Design, Physical Activity, and Time Spent in Cars. American Journal of Preventive Medicine, 27(2). August 2004. http://www.ajpmonline.org/article/S0749-3797(04)00087-X/pdf.
[5] Hoehner, Christine M, et al. Commuting Distance, Cardiorespiratory Fitness, and Metabolic Risk. American Journal of Preventive Medicine, 42(6). June 2012. http://www.ajpmonline.org/article/S0749-3797(12)00167-5/pdf.
[6] U.S. Department of Transportation. Transportation and Health Indicators. Transportation and Health Tool. https://www.transportation.gov/transportation-health-tool/indicators/detail/tn/state/tennessee#indicators.
[7] Srinivasan, Shobha, O’Fallon, Liam R and Dearry, Allen. Creating Healthy Comunities, Healthy Homes, Healthy People: Initiating a Research Agenda on the Built Environment and Public Health. American Journal of Public Health, 93(9). September 2003. http://courseresources.mit.usf.edu/sgs/ph6934/webpages/CC/module_1/read/1446.pdf.
[8] Health Effects Institute Panel on the Health Effects of Traffic-Related Air Pollution. Traffic-Related Air Pollution: A Critical Review of the Literature on Emissions, Exposure, and Health Effects. Health Effects Institute: Boston. 2010. https://www.healtheffects.org/publication/traffic-related-air-pollution-critical-review-literature-emissions-exposure-and-health.
[9] Boehmer, Tegan K, et al. Residential Proximity to Major Highways – United States, 2010. Morbidity and Mortality Weekly Report (MMWR), 62(3). https://www.cdc.gov/mmwr/preview/mmwrhtml/su6203a8.htm.
[10] Centers for Disease Control and Prevention. CDC Recommendations for Improving Health through Transportation Policy. 2011. https://www.cdc.gov/transportation/docs/final-cdc-transportation-recommendations-4-28-2010.pdf.
[11] TN Department of Safety and Homeland Security, TITAN Division. Tennessee Traffic Fatalities Historical Report 2012-2016. https://www.tn.gov/assets/entities/safety/attachments/dailyfatality2016.pdf.