Key Takeaways
Deaths in 2021
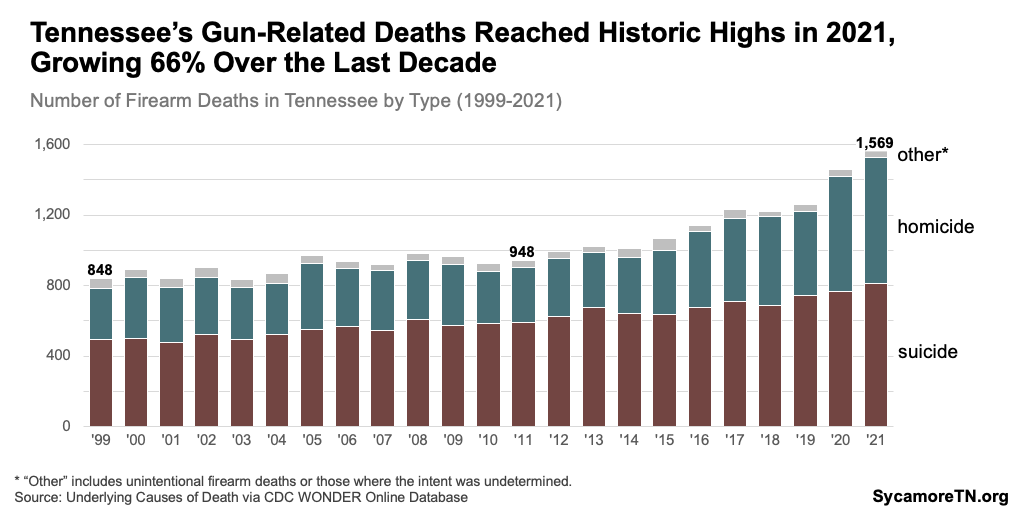
- In 2021, gunfire was the 10th leading cause of death in Tennessee, killing 1,569 residents or about 22 of every 100,000 people.1 It was the leading cause of death for those ages one to 18.
- Our firearm death rate was the 11th highest in the U.S. and 53% (7.8 deaths per 100,000) higher than the national rate. That gap has grown over time.
Demographics and Type
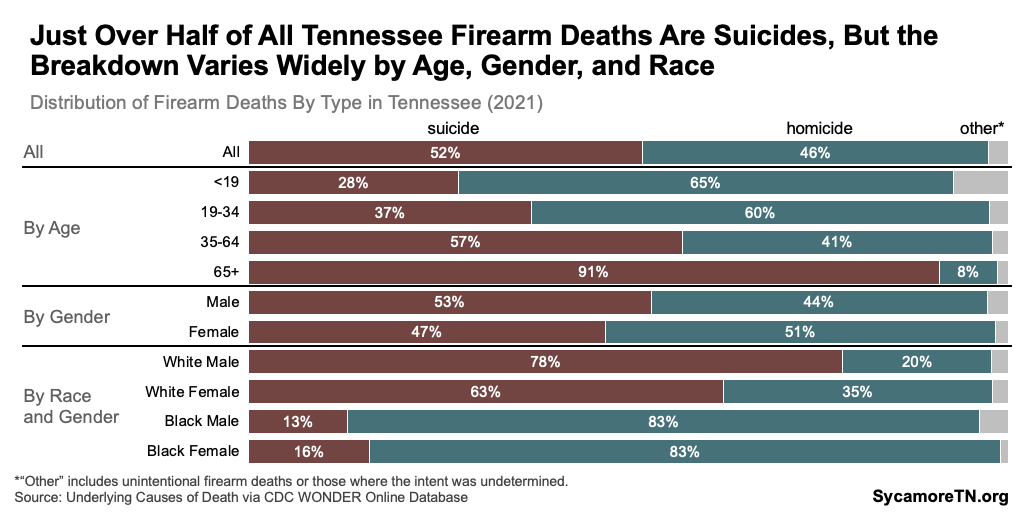
- Just over half of firearm deaths were suicides, but homicides accounted for the most among zero to 35-year-olds and black Tennesseans.
Trends
- Shooting deaths in the state have been rising for about a decade — largely driven by spikes in homicides. Those under 19 and black Tennesseans had the fastest growth in firearm death rates.
- Over the same period, state crime data show a rise in offenses involving firearms — both fatal and non-fatal — while all other crime rates declined.
Across Tennessee
- From the 2000s to the 2010s, firearm death rates rose in about three-quarters of the 80 counties with available data. The counties with the highest rates are mostly in West Tennessee.
Shooting deaths in Tennessee have been rising for about a decade and reached an all-time high in 2021. (1) This brief breaks these numbers and trends down by demographics and geography and compares them to related crime trends and the rest of the country using the latest available data. Throughout this report, we use the terms firearm death, gunfire death, shooting death, and gun death interchangeably to refer to all reported deaths that were the result of gunfire. See “About the Data” at the end of this report for more information.
Figure 1
Tennessee Firearm-Related Deaths in 2021
Firearm-related deaths reached record highs in 2021 — claiming the lives of nearly 1,570 Tennesseans, or about 22 deaths for every 100,000 people (Figure 1). For context, the leading cause of death in 2021 — cardiovascular disease — killed over 18,000 Tennesseans or about 265 deaths for every 100,000 people. Gunfire was the 10th leading cause of death in the state (Figure 2). Here’s how those deaths broke down by demographics and type.
- By Age: Of all gun deaths in 2021, 42% were among those ages 35-64, and 37% were 19 to 34-year-olds (Figure 3). When adjusted for population size, young adults ages 19 to 34 had the highest rate of gun-related deaths at 39.1 per 100,000 people in that age group.[1] Children and adolescents had the lowest rate at 7.6 deaths per 100,000 (Figure 4). Firearm deaths are much less frequent among minors than any other age group because deaths among this cohort are rare in general. However, gunfire was the leading cause of death for Tennesseans ages one to 18 in 2021 (Figure 5). Those deaths were largely concentrated among teens, with 15 to 18-year-olds making up 77% of shooting deaths among Tennessee children and adolescents during the 2018-2021 period (Figure 6).
- By Type: Just over half (52%) of all Tennessee firearm deaths in 2021 were by suicide[2] (Figure 3), but this varied by age, gender, and race (Figures 6 and 7).
- By Gender: Men accounted for over 80% of Tennessee’s firearm deaths in 2021 (Figure 3). In fact, the rate of gun deaths among men was nearly five times higher than the rate among women (Figure 4).
- By Race: About 60% of shooting deaths were among white Tennesseans (Figure 3). However, black Tennesseans had a much higher rate of death by firearm — almost three times higher (Figure 4).
- By Age and Type: Suicide was most common among Tennesseans age 35+ while homicides account for most firearm-related deaths among those under 35 (Figure 7).
- By Race, Gender, and Type: Suicides accounted for most firearm deaths among white Tennesseans, while homicides accounted for the majority among black Tennesseans (Figure 7). Deaths among men and women split about evenly overall between suicides and homicides. However, white men and women were much more likely to die from suicide and black men and women from homicide.
Figure 2
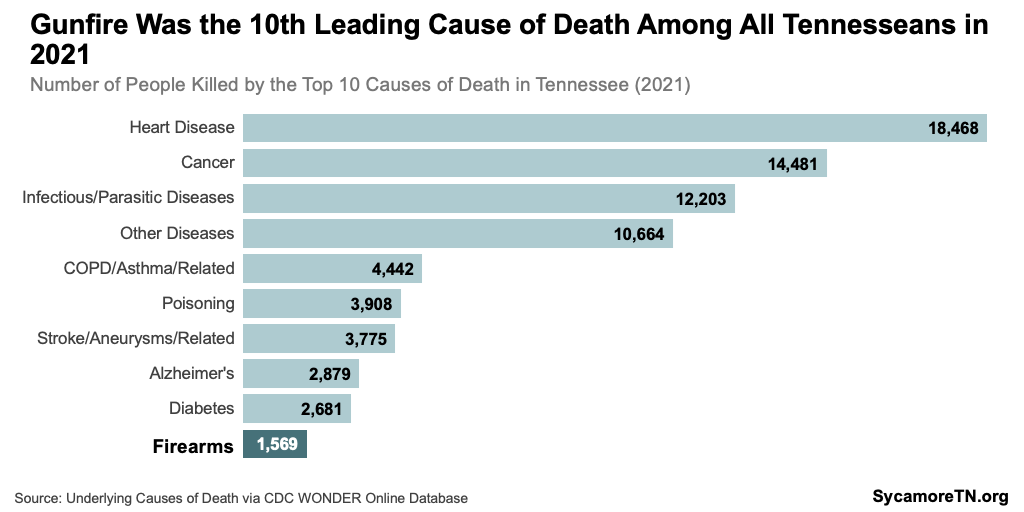
Figure 3
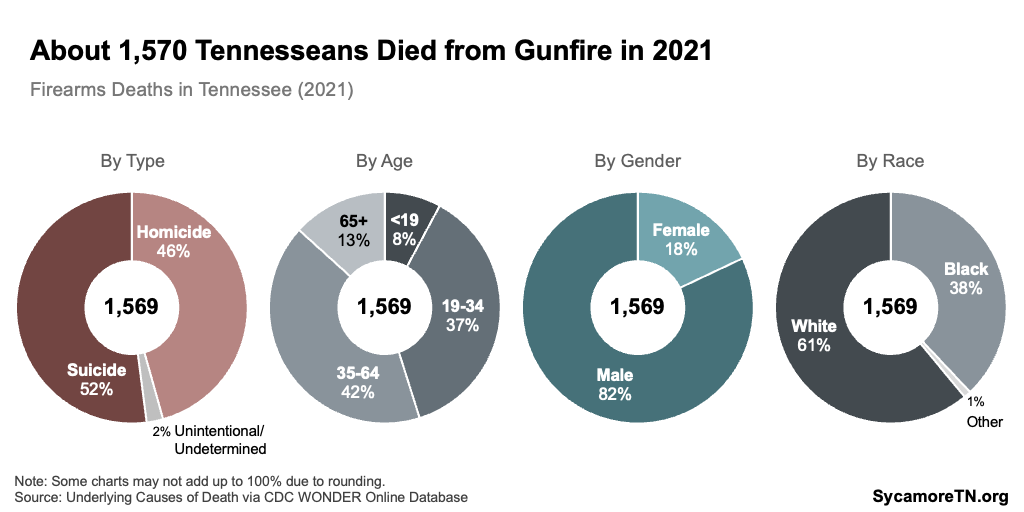
Figure 4
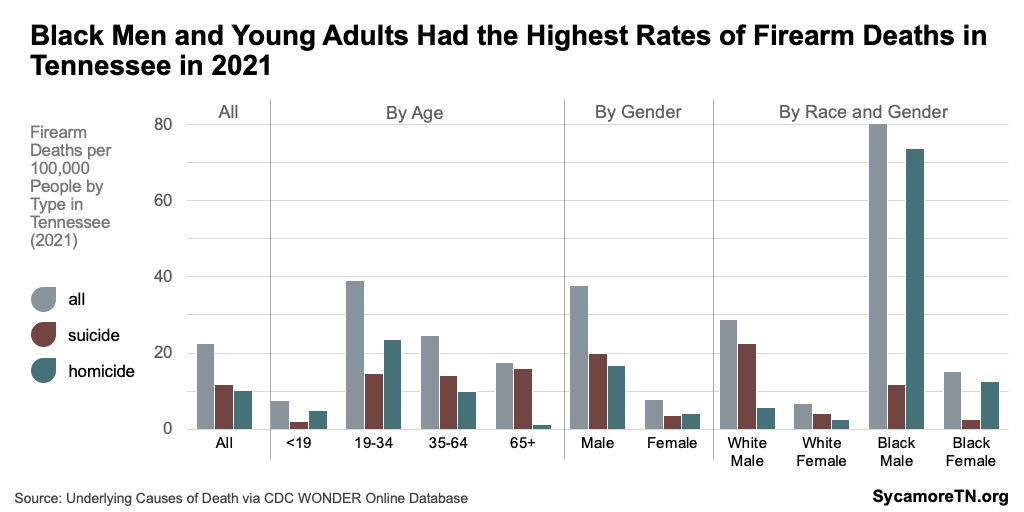
Figure 5
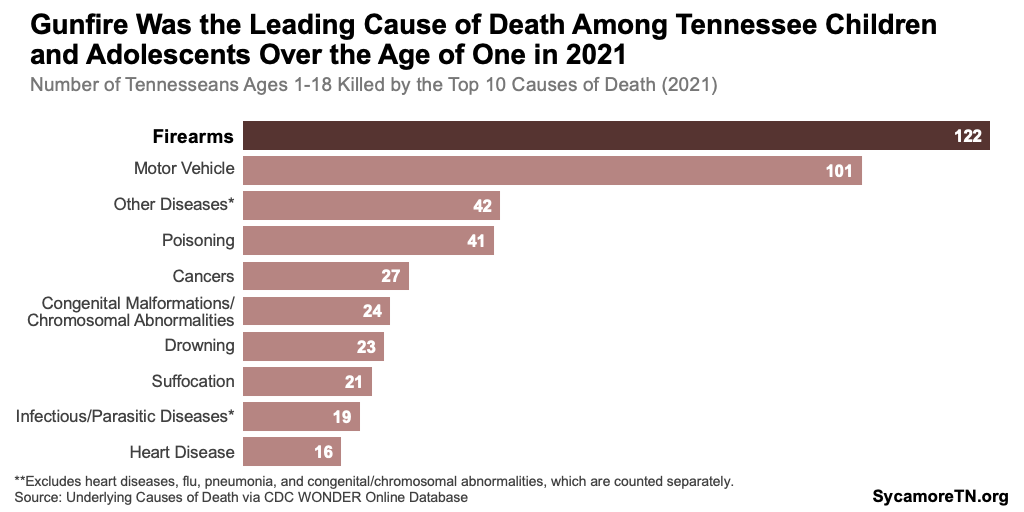
Figure 6

Figure 7
Trends in Tennessee Firearm-Related Deaths
Shooting death rates in Tennessee have been rising for about a decade (Figure 8). From 2011 to 2021, the annual number of firearm deaths in Tennessee increased by 66% or 623 additional deaths each year — compared to a 12% jump or an additional 99 people per year from 2001 to 2011. The rate of shooting deaths — which accounts for changes in population — rose by 52% or 7.7 deaths per 100,000 people during the most recent decade versus about 1% or 0.1 deaths over the ten years before.[3]
By age, gun death rates grew the most for young adults but the fastest for minors — overtaking car crashes as the leading cause of death among children and adolescents in 2017 (Figures 9 and 10). Between 2011 and 2021, the shooting death rate grew by 4.7 deaths (162%) among Tennesseans under 19, 18.8 deaths (93%) among those ages 19 to 34, and 6.2 deaths (34%) among 35 to 64-year-olds. Gunfire caused more deaths among one to 18-year-olds than any other cause in 2017, 2018, 2020, and 2021.[4] Nationally, gunfire became the leading cause of death among one to 18-year-olds in 2020.
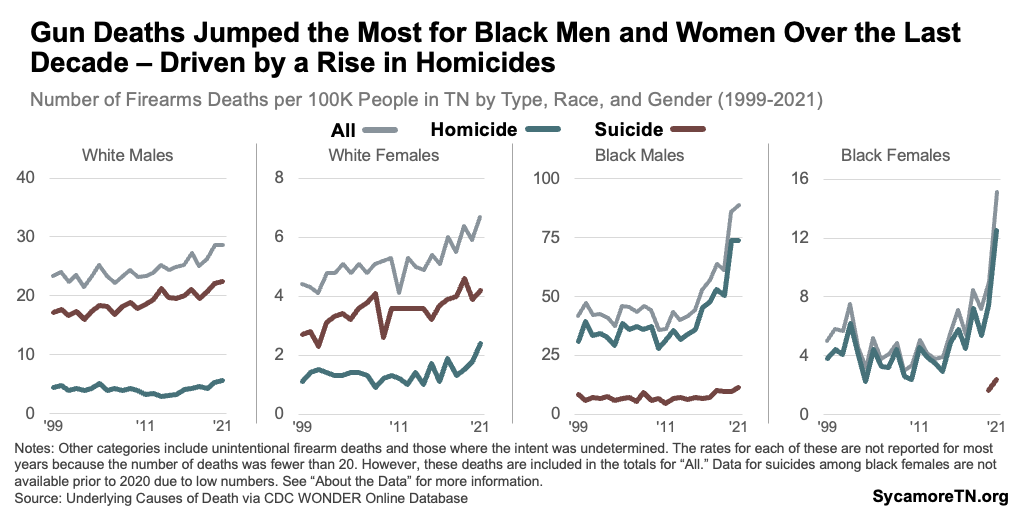
By race and gender, black men and women experienced the largest and fastest increase in firearm death rates between 2011 and 2021 (Figure 11). The rate of deaths from gunfire rose by 10.0 deaths (196%) among black women, 52.4 deaths (144%) among black men, 2.6 deaths (63%) for white women, and 5.4 deaths (23%) among white men.1
Figure 8
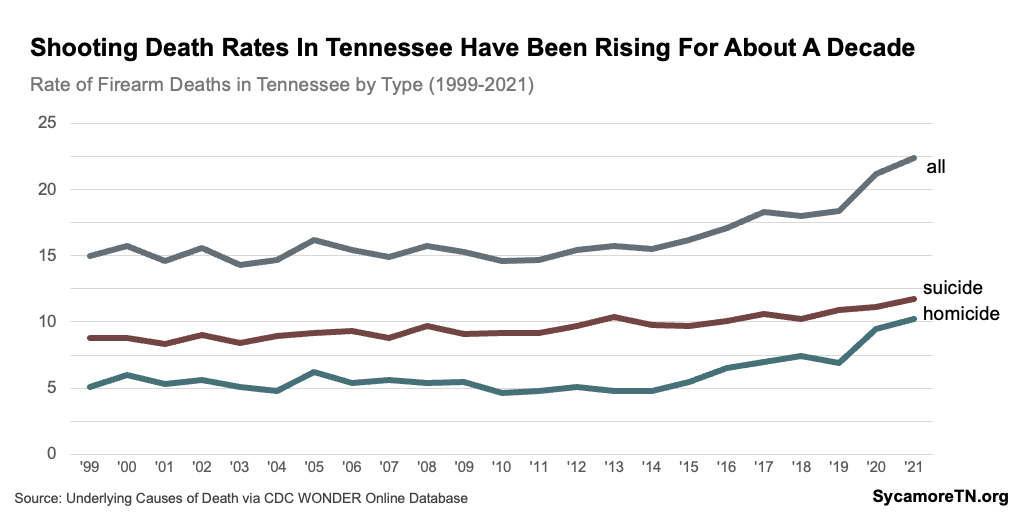
Figure 9
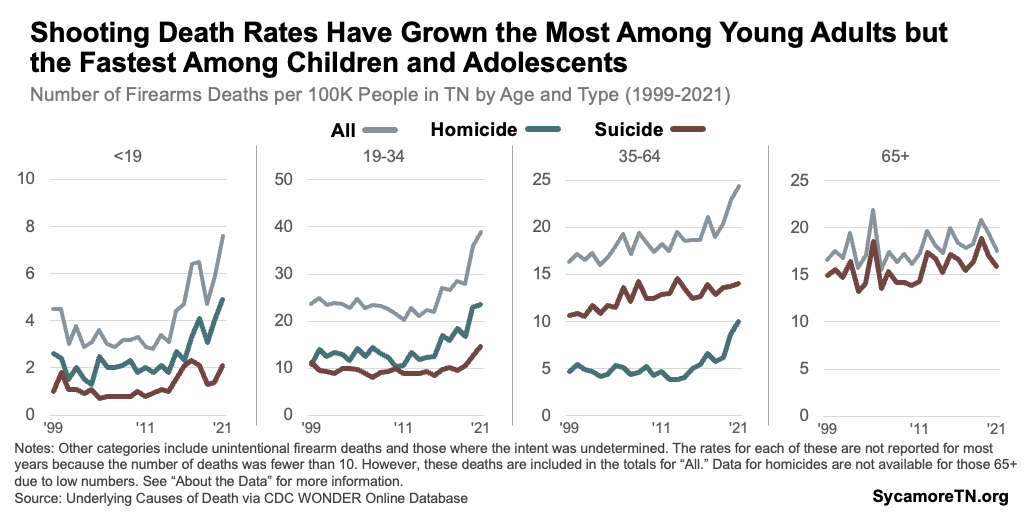
These trends were mostly propelled by an increase in homicides2 (Figures 9 and 11). The annual rate of homicides with guns more than doubled between 2011 and 2021 — growing by 5.4 deaths per 100,000 people. These rates also more than doubled for all individual age groups except for those over 65. During this period, firearm homicide rates rose by 5.4 deaths (113%) overall, 2.9 deaths (145%) for those under 19, 12.9 deaths (122%) for 19 to 34-year-olds, and 5.3 deaths (113%) among those ages 35-64.1 The number of homicide deaths among those 65+ were too few to be reported. The rate of homicides also more than doubled for each of the race/gender combinations we looked at other than white men (Figure 10).
Figure 10
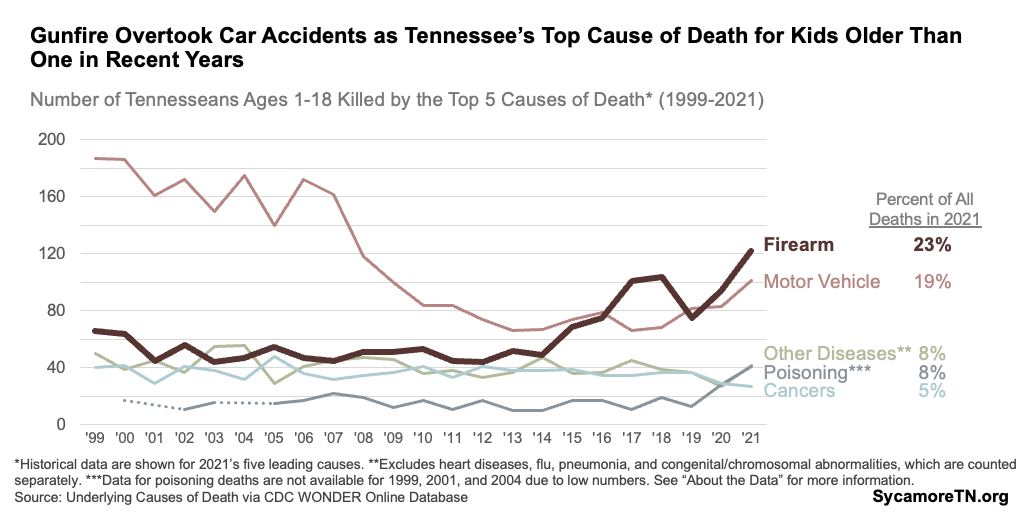
Figure 11
Related Trends
As homicides involving firearms increased during this period, homicides with other weapons and means declined (Figure 12). Between 2011 and 2021, the rate of homicide deaths involving other weapons and means fell by 0.7 deaths (35%) per 100,000 people. As a result, homicides involving a firearm grew from 70% of all homicide deaths in 2011 to 88% ten years later.
Figure 12
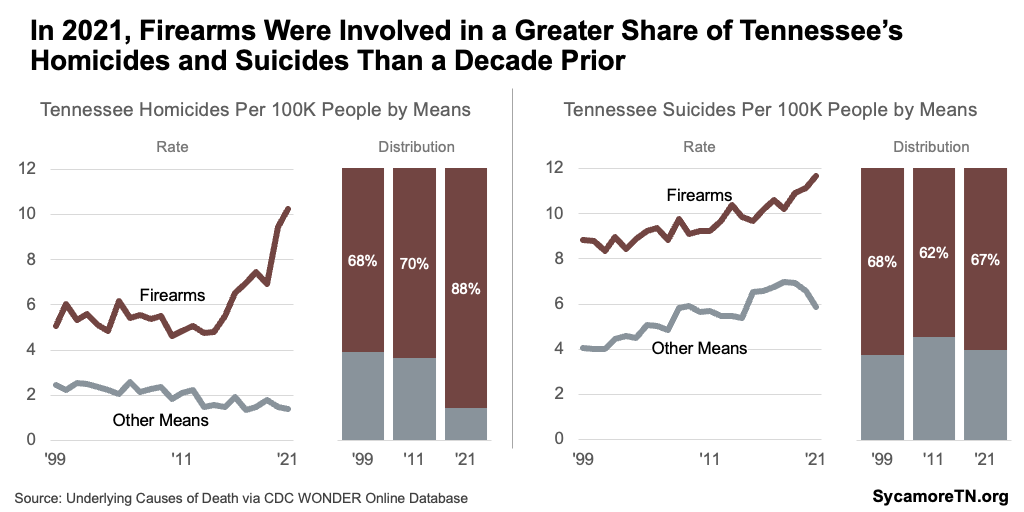
Figure 13
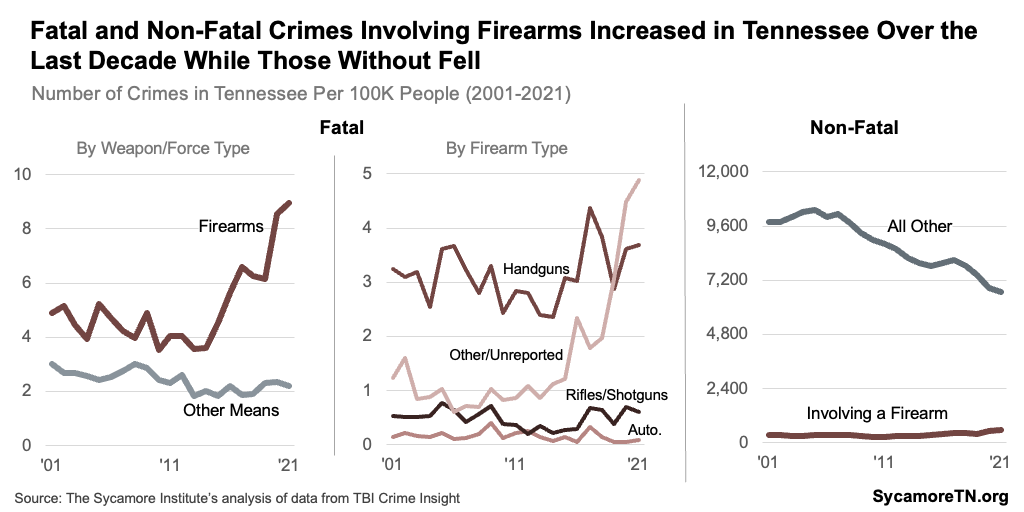
Similarly, state crime data show a rise in offenses involving firearms — both fatal and non-fatal — while all other crime rates declined (Figure 13). Between 2011 and 2021, the rate of fatal crimes involving a firearm rose by 4.9 crimes (122%) per 100,000 people. Meanwhile, the fatal crimes rate involving other means of force fell by 0.1 crimes (-5%). Among non-fatal crimes, the rate of those involving guns grew by 297.1 crimes (104%) — compared with a decline of 2,141.5 (-24%) instances per 100,000 people for all other crimes. (3) Some national studies suggest that many crimes involving a gun are likely committed by people who did not legally possess the firearm, but state-level data to support these findings were not readily available for this report. (4) (5) (6)
The rate of suicides with firearms also rose over the last decade, while those involving other means grew rapidly before falling back to near-prior levels in 2021 (Figures 11). Overall, the rate of suicide deaths involving a firearm increased by about one-quarter or 2.4 deaths per 100,000 people between 2011 and 2021. Across all demographic groups, black men had the largest changes in firearm-related suicides with a rate increase of 7.0 deaths (152%) (Figure 10). Suicides involving other means increased from 5.7 deaths per 100,000 people in 2011 to a peak of 7.0 in 2018 before falling back down to 5.9 in 2021 (Figure 11).
Figure 14
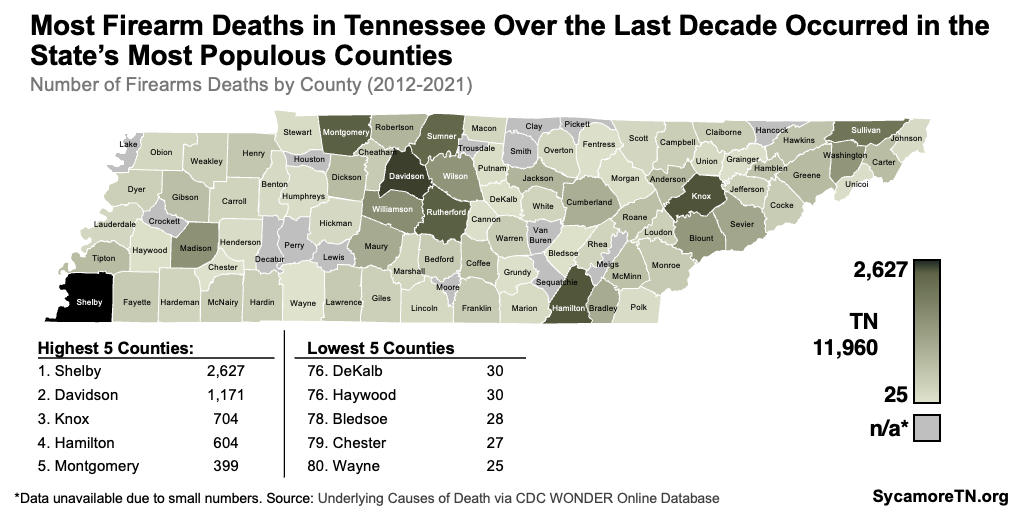
Shooting Deaths Across Tennessee
Most firearm deaths occur in Tennessee’s most populous counties, but the counties with the highest rates are largely concentrated in West Tennessee (Figure 14 and 15). Because of low numbers, we combined data across multiple years for each of the 80 counties with counts high enough to be reported. In the decade spanning 2012-2021, 43% of the state’s nearly 12,000 shooting deaths occurred in the four largest counties — Shelby, Davidson, Knox, and Hamilton, which together accounted for about 36% of the state’s population during this period (Figure 14). Of these, only Shelby County was also among the counties with the highest rates of death from gunfire (Figure 15). Other counties with the highest rates tended to concentrate in West Tennessee.
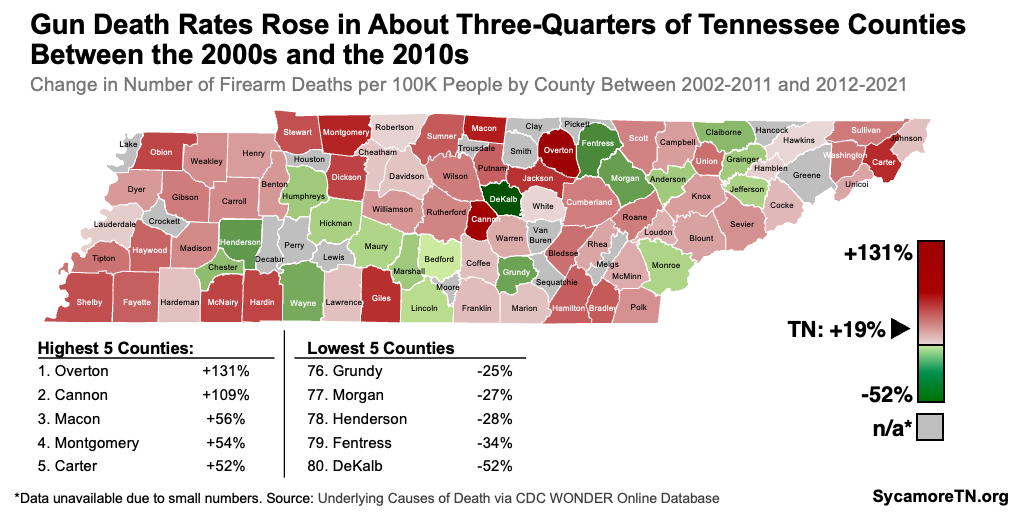
Between the 2000s and the 2010s, gun death rates rose in about three-quarters of the 80 Tennessee counties with available data (Figure 16). Between the 2002-2011 and 2012-2021 periods, the firearm death rate in Tennessee increased by about 19% or 2.9 deaths per 100,000 people. Across the 80 counties with complete data, that change ranged from an increase of 12.2 deaths (131%) in Overton County to a decrease of 16.4 deaths (-52%) in DeKalb County.
Figure 15
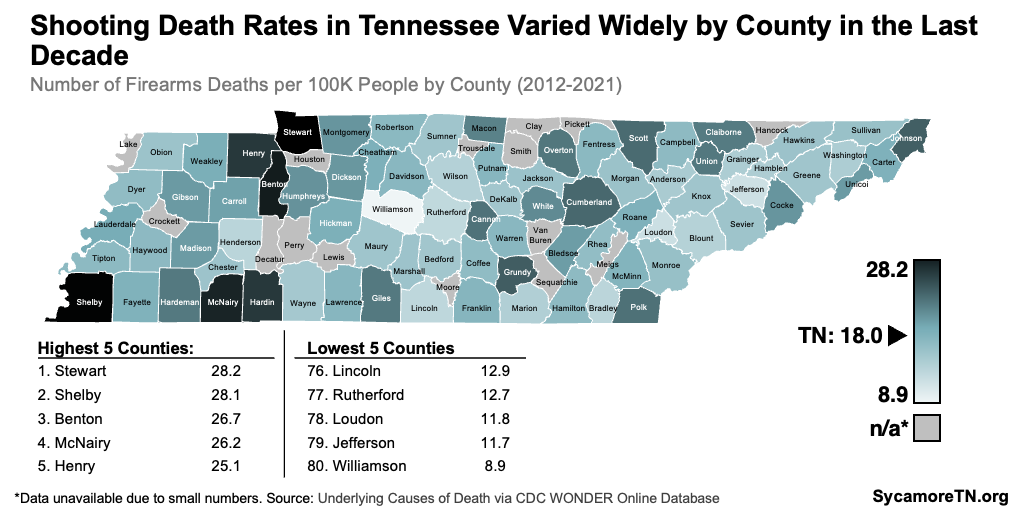
Figure 16
Tennessee’s Firearm-Related Deaths in Context
In 2021, Tennessee’s overall firearm death rate was 53% — or 7.8 deaths — higher than the national rate (Figure 17) and the 11th highest in the country (Figure 18). For other measures:
- Tennessee’s rate of homicide deaths involving a firearm was 3.9 deaths (62%) higher than the national rate of 6.3 deaths per 100,000 and tied with Illinois as the 7th highest among the states with available data (Figure 19).
- Suicides involving guns were 3.8 deaths (48%) higher than the national rate and the 18th highest rate among all states (Figure 20).
- Among those under 19, the shooting death rate was 3.0 deaths (65%) higher than the national rate and the 9th highest among the states with available data (Figure 21).
- The largest disparities by age and type between Tennessee and the country as a whole were for the rates of homicides among those 18 and younger (69% or 2.0 deaths) and suicides among adults (47% or 4.7 deaths1) (Figure 17).
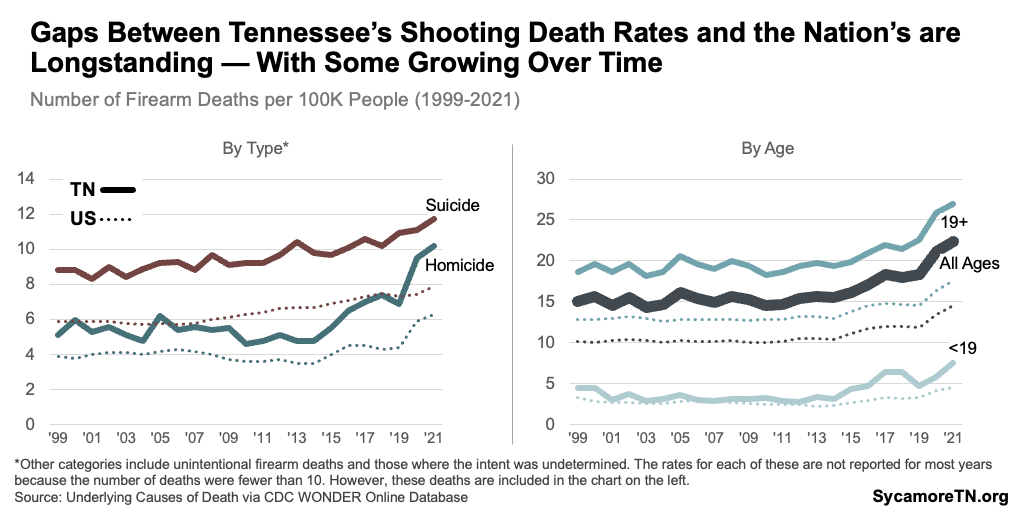
Persistent gaps in firearm-related death rates between Tennessee and the U.S. have widened over time, particularly among minors and for homicides (Figure 22). For example, the rate of gun-related deaths among those under 19 in 2011 was 0.4 deaths (16%) higher in Tennessee than for the nation and 3.0 deaths (65%) higher by 2021. Similarly, Tennessee’s gun homicide rate was about one-third (1.2 deaths) higher than the national rate in 2011 but two-thirds (3.9 deaths) higher by 2021.
Figure 17
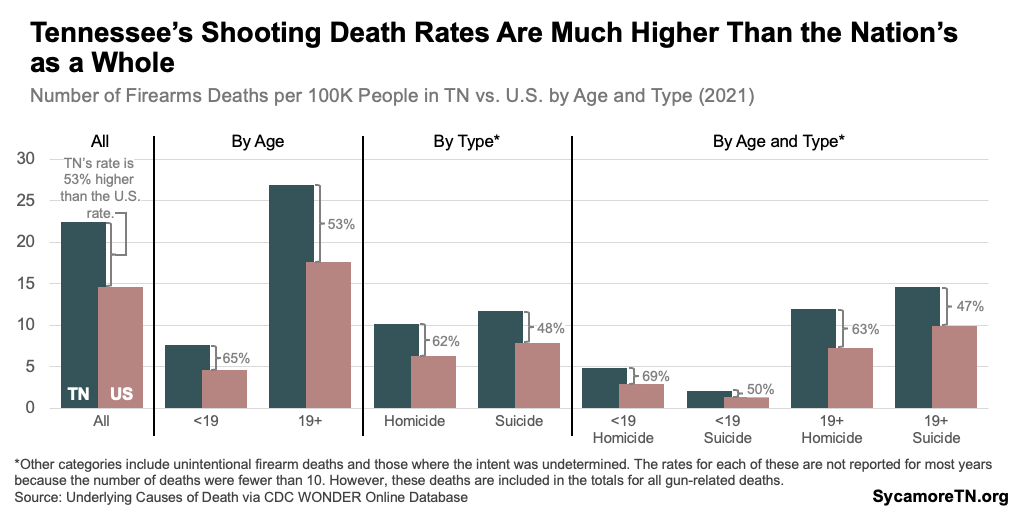
Figure 18
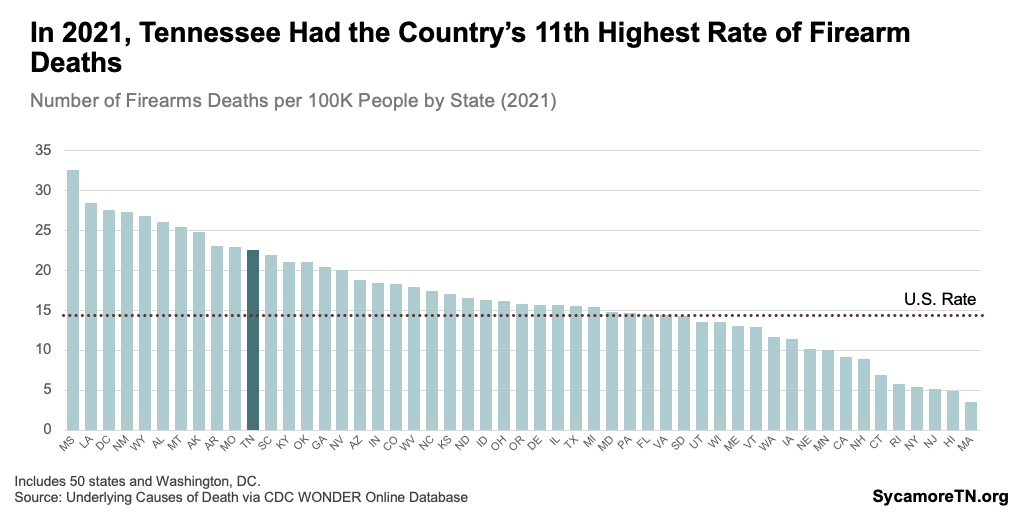
Figure 19
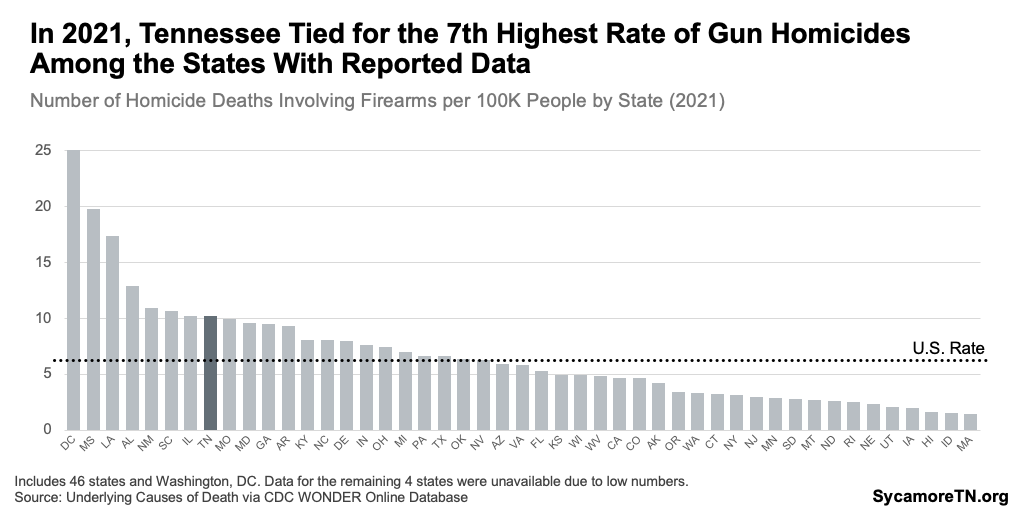
Figure 20
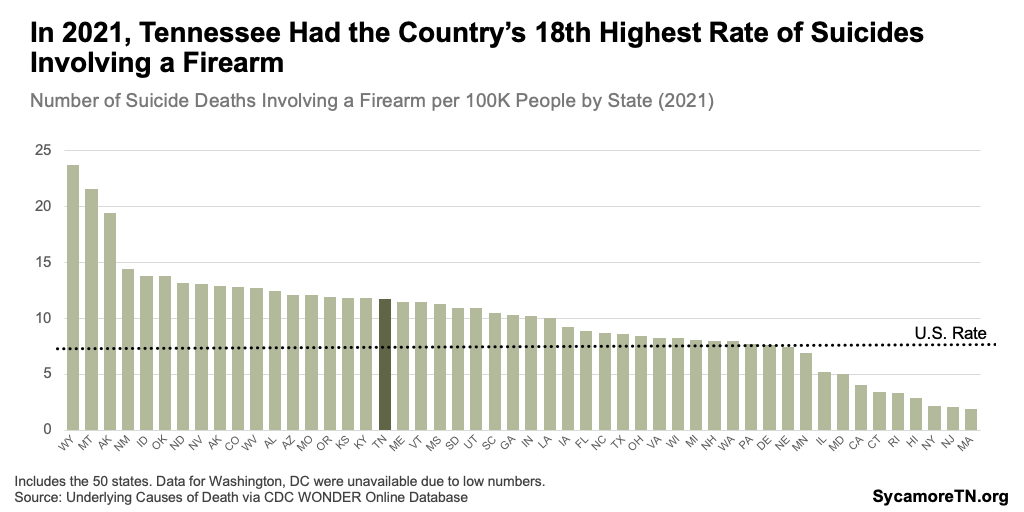
Figure 21
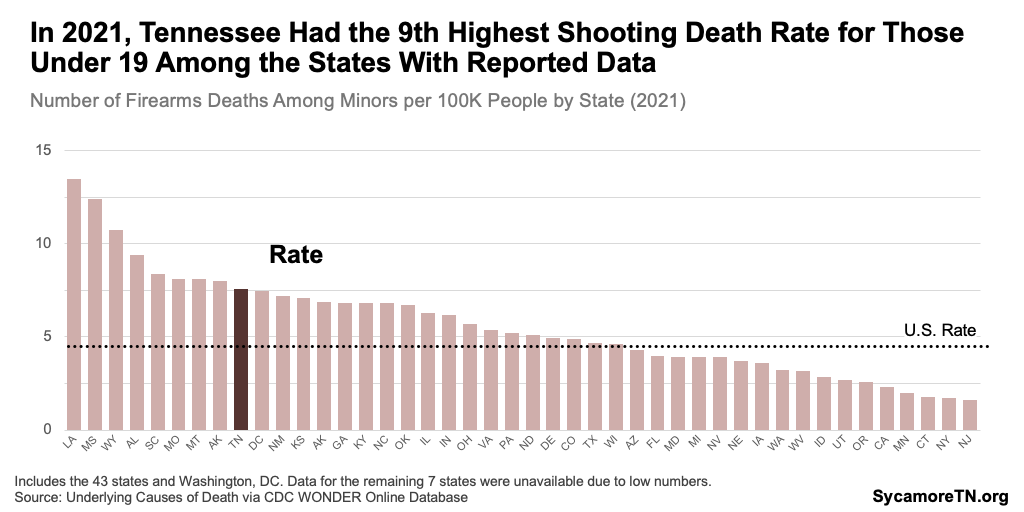
Figure 22
About the Data
Click to Open/Close
This analysis draws from the latest state and local death certificate data compiled by the federal government and state crime data reported by the Tennessee Bureau of Investigation (TBI).
Death Certificate Data
The death certificate data are reported and made available by cause of death, county of residence, race and ethnicity, age, and sex according to the following processes. (7) (8)
- Cause of Death: Causes of death are determined by the deceased’s attending physician or a county medical examiner. These causes are based on ICD-10 medical diagnosis codes — which means that, for example, homicides are based on a medical examiner’s determination, not a criminal code definition.(7) In the case of suspected suicides, state law lays out specific steps that medical examiners must take that involve additional documentation and involvement of family. (8)
- Local and State Reporting: These medical certifications are reported to the deceased’s funeral director, who is required to file a death certificate with the Tennessee Department of Health’s (TDH) Office of Vital Records. TDH reviews, compiles, and maintains the records.(9) (10) Those data are then reported to the U.S. Centers for Disease Control and Prevention (CDC).
- Data Availability: CDC’s National Center for Health Statistics compiles data from 57 vital statistics jurisdictions (e.g. states, territories). Data for 1999-2021 are made available to the public through the WONDER database.(11)
- Data Limitations: When the number of deaths is fewer than 10 for any specific query (e.g. gun deaths among white 25-year-olds in Davidson County in 2020), the data are not reported. (7) While this protects privacy, it can limit the ability to obtain and analyze information dissected across multiple characteristics (e.g. by race and by age and by geography and by type).
Crime Data
The crime data are reported and made available by offense type, incident circumstances, and demographics of arrestees, offenders, and victims according to the following processes. (12) (3) (13)
- Crimes and Other Details: TBI’s Tennessee Incident Based Reporting System (TIBRS) database collects details about 54 specific offenses in 24 crime categories, arrestees and offenders, victims, and the relationship between the individuals involved. Depending on the offense, details about specific crimes include things like the type of weapon or force used, bias motivation, method of entry, types of property, gang involvement, and circumstances (e.g., location, time of day). We constructed our own totals for fatal and non-fatal crimes. Fatal crimes include murder, negligent manslaughter, justifiable homicide, and negligent vehicular manslaughter. Non-fatal includes all other offenses.
- Reporting: These data are collected and reported to TBI monthly through the TIBRS database by over 300 state, county, and municipal law enforcement and correctional agencies, courts, and colleges and universities within Tennessee.
- Data Availability: TBI compiles the data reported through TIBRS and makes it available to the public through the Crime Insights database. Data are currently available for 2001-2021. TBI also reports TIBRS data to the Federal Bureau of Investigation’s (FBI) National Incident Based Reporting System (NIBRS), which is used to report national crime statistics and trends.
- Data Limitations: The TBI strongly cautions against using TIBRS data to evaluate or rank law enforcement agencies or locations due to differences in jurisdictions (e.g., population characteristics, economic conditions). Furthermore, the level of detail reported to and available in Crime Insights does not allow us to answer additional research questions of interest (e.g., What proportion of gun-related crimes involved an illegally possessed firearm?). Finally, due to differences and changes in federal reporting, TIBRS data are not always comparable to FBI-reported trends and statistics.
[1] Rates are the number of deaths among a particular demographic group for every 100,000 people in that group.
[2] Throughout this brief, suicide and homicide rates and numbers refer only to those occurring with a firearm, unless otherwise noted.
[3] To analyze differences in firearm death rates, we report both absolute and relative changes. The absolute change states the difference between two rates. Relative change measures the percentage difference between two rates, and—over time—represents the pace of change. Each comes with limitations. For example, the absolute and relative changes to an initially small value could give very different impressions of the magnitude of change. To illustrate, the absolute increase between a beginning rate of 1.0 death per 100,000 and a later rate of 2.0 deaths per 100,000 is 1.0 deaths. The relative increase is 100%. (14) (15)
[4] For comparisons to other causes of death, we narrowed our age range for minors from under 19 to one through 18 based on similar national analyses. Children under one are typically excluded from these analyses due to high rates of death from causes unique to infants – including birth defects, pre-term birth, low birthweight, sudden infant death syndrome, suffocation, and pregnancy complications. (16) (17) (18)
*This report was updated on June 30, 2023, to provide additional data on shooting deaths among minors and clarify the terminology used for this population.
References
Click to Open/Close
References
- U.S. Centers for Disease Control and Prevention (CDC), National Center for Health Statistics, National Vital Statistics System. Underlying Causes of Death for 1999-2021 on CDC WONDER Online Database. 2022. Accessed on April 11, 2023 via https://wonder.cdc.gov/Deaths-by-Underlying-Cause.html.
- U.S. Centers for Disease Control and Prevention (CDC), National Center for Health Statistics, National Vital Statistics System. Underlying Causes of Death for 1999-2021 on CDC WONDER Online Database. 2022. Accessed on April 11, 2023 via https://wonder.cdc.gov/Deaths-by-Underlying-Cause.html.
- Tennessee Bureau of Investigation (TBI). Tennessee Incident Based Reporting System (TIBRS). Accessed on May 18, 2023 via https://crimeinsight.tbi.tn.gov/public.
- Alper, Mariel and Glaze, Lauren. Source and Use of Firearms Involved in Crimes: Survey of Prison Inmates, 2016. U.S. Department of Justice. [Online] January 2019. https://bjs.ojp.gov/content/pub/pdf/suficspi16.pdf
- Planty, Michael and Truman, Jennifer L. Firearm Violence, 1993-2011. U.S. Department of Justice. May 2013. https://bjs.ojp.gov/content/pub/pdf/fv9311.pdf
- U.S. Bureau of Alcohol, Tobacco, Firearms and Explosives(ATF) . National Firearms Commerce and Trafficking Assessment (NFCTA): Crime Guns – Volume Two, Part V (page 23). 2023. https://www.atf.gov/firearms/docs/report/nfcta-volume-ii-part-v-firearm-thefts/download via https://www.atf.gov/firearms/national-firearms-commerce-and-trafficking-assessment-nfcta-crime-guns-volume-two
- U.S. Centers for Disease Control and Prevention (CDC). About Underlying Cause of Death, 1999-2020. CDC WONDER Online Database. 2023. Accessed on April 12, 2023. https://wonder.cdc.gov/ucd-icd10.html
- State of Tennessee. Tennessee Code Annotated § 68-3-502. Accessed on April 30, 2023 via Lexis.
- Tennessee Department of Health. General Health Data: Death Statistics. Accessed on April 30, 2023. https://www.tn.gov/health/health-program-areas/statistics/health-data/death-statistics.html
- —. Office of Vital Records. Accessed on April 30, 2023. https://www.tn.gov/health/health-program-areas/vital-records.html
- U.S. Centers for Disease Control and Prevention (CDC), National Center for Health Statistics. CDC WONDER Online Databases: Data Summary Descriptions. Accessed on April 30, 2023. https://wonder.cdc.gov/DataSets.html
- Tennessee Bureau of Investigation (TBI). Crime in Tennessee: 2021. July 18, 2022. https://www.tn.gov/content/dam/tn/tbi/documents/2021%20Crime%20in%20Tennessee%20FINAL%20Secured.pdf
- —. Rules of Tennessee Bureau of Investigation, Chapter 1395-1-2: Tennessee Incident Based Reporting System Program. March 2008. https://publications.tnsosfiles.com/rules/1395/1395-01-02.pdf.
- The Data School. Relative vs. Absolute Change. Avoid Misrepresenting Data. December 19, 2019. https://dataschool.com/misrepresenting-data/relative-vs-absolute-change/
- King, Nicholas, Harper, Sam and Young, Meredith. Use of Relative and Absolute Effect Measures in Reporting Health Inequalities: Structured Review. BMJ 345: e5774. September 3, 2012. https://www.ncbi.nlm.nih.gov/pmc/articles/PMC3432634/
- Cunningham, Rebecca, Walton, Maureen and Carter, Patrick. The Major Causes of Death in Children and Adolescents in the United States. New England Journal of Medicine 379: 2468-2475. December 20, 2018. https://www.nejm.org/doi/full/10.1056/NEJMsr1804754.
- McGough, Matt, et al. Child and Teen Firearm Mortality in the U.S. and Peer Countries. Kaiser Family Foundation. July 8, 2022. https://www.kff.org/global-health-policy/issue-brief/child-and-teen-firearm-mortality-in-the-u-s-and-peer-countries/
- U.S. Centers for Disease Control and Prevention (CDC). Infant Mortality. June 22, 2022. https://www.cdc.gov/reproductivehealth/maternalinfanthealth/infantmortality.htm