Key Takeaways
- Federal, state, and local governments share financial responsibility for Tennessee’s public roads.
- It’s been 45 years since Tennessee borrowed money for road construction.
- Vehicle-related excise taxes set at specific, fixed levels are the largest funding sources for transportation projects in Tennessee.
- The state’s vehicle-related excise taxes are not responsive to road funding needs.
- The pressures on these transportation funding sources could get worse.
- The state’s federal funding and locals’ state funding face these same challenges.
Overview
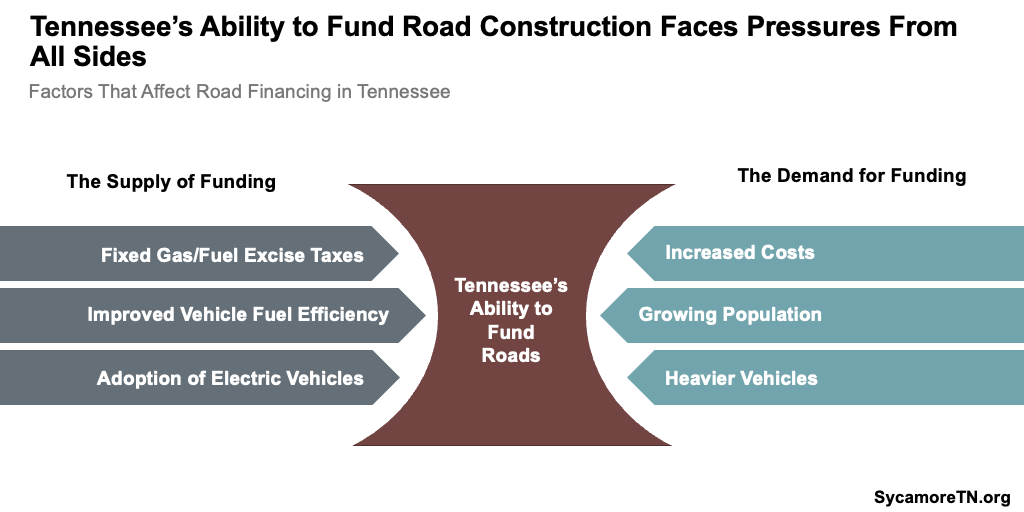
Tennessee’s ability to fund road construction and maintenance faces pressures from all sides (Figure 1). Governor Bill Lee has floated several ideas to address some of these pressures — including paid express lanes using public-private partnerships, higher fees on electric vehicles, and strategies to reduce construction timelines and costs. This policy brief explores six key facts about how Tennessee pays for transportation projects today and growing challenges to that model.
Figure 1
1. Federal, state, and local governments share financial responsibility for Tennessee’s public roads.
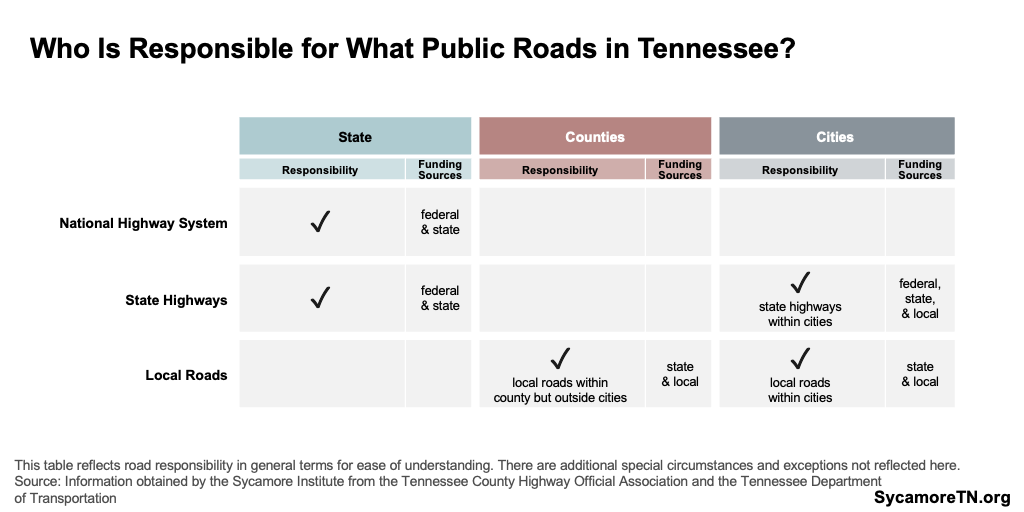
Tennessee has over 96,000 miles of public roads — nearly all of which are owned by state and local governments and supported by a mix of federal, state, and local dollars (Figures 2 and 3). While local governments own about 85% of all public roadways, over two-thirds of Tennessee’s traffic travels on roads owned by the state (Figure 2). (1) In general, the state uses federal and state dollars to build and maintain all state highways — including interstates and U.S. routes that are part of the National Highway System and general state highways. Counties use state and local dollars for all public roads within their borders excluding state highways, interstates, and municipal roads. Finally, most cities have access to federal, state, and local dollars for all public roads within their boundaries— including state highways but not interstates. (2) (3).
Figure 2
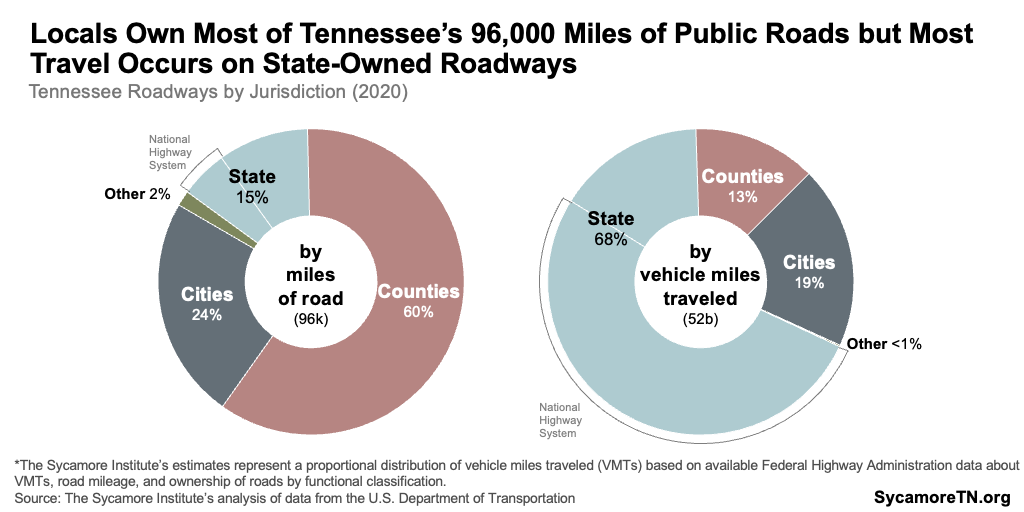
Figure 3
Altogether, Tennessee’s state and local governments spent an estimated $2.8 billion on transportation in FY 2020 (Figure 4). (1) (4) According to National Highway Administration data, the state’s direct spending, which excludes transportation dollars for local governments, made up roughly 75% of that. Both total spending and the state’s share of that spending were down compared to FY 2005, after adjusting for inflation. (1) (5)
Figure 4
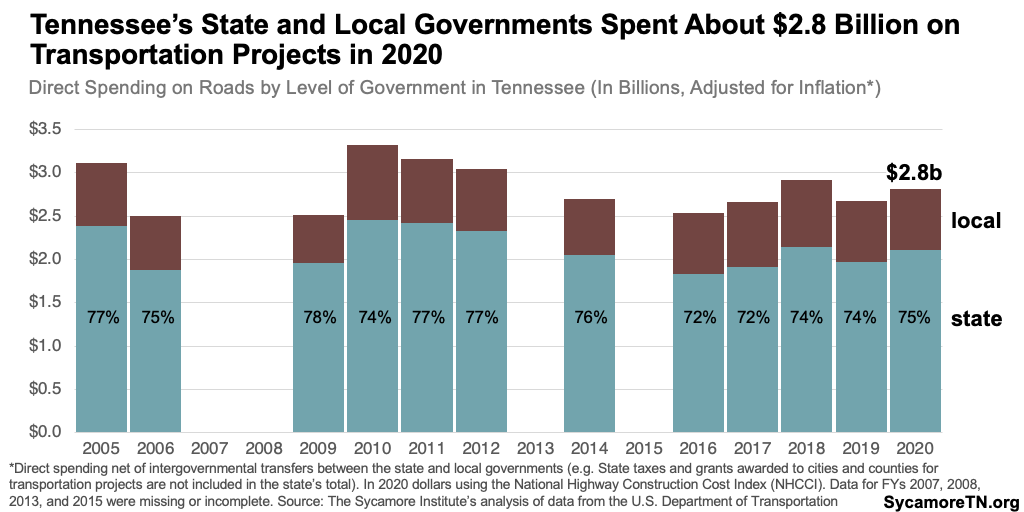
Figure 5
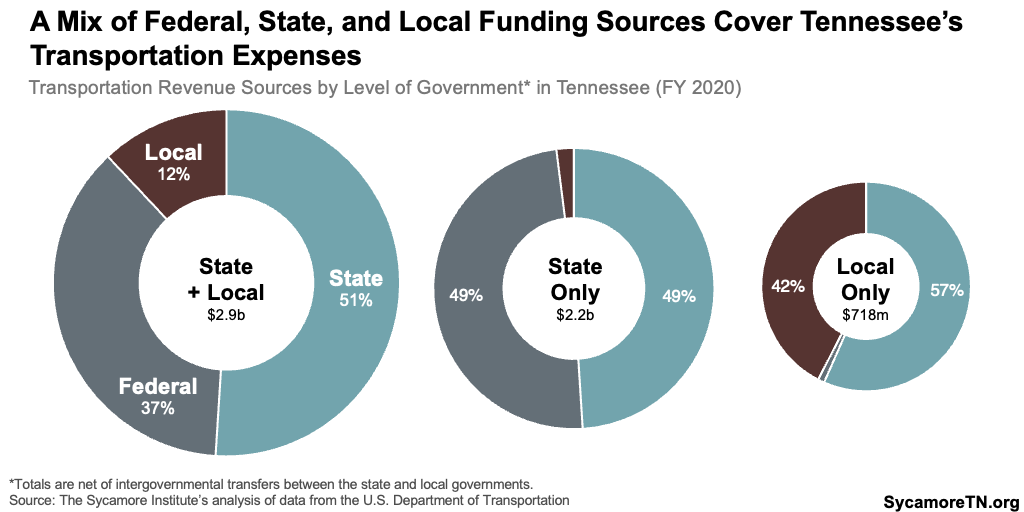
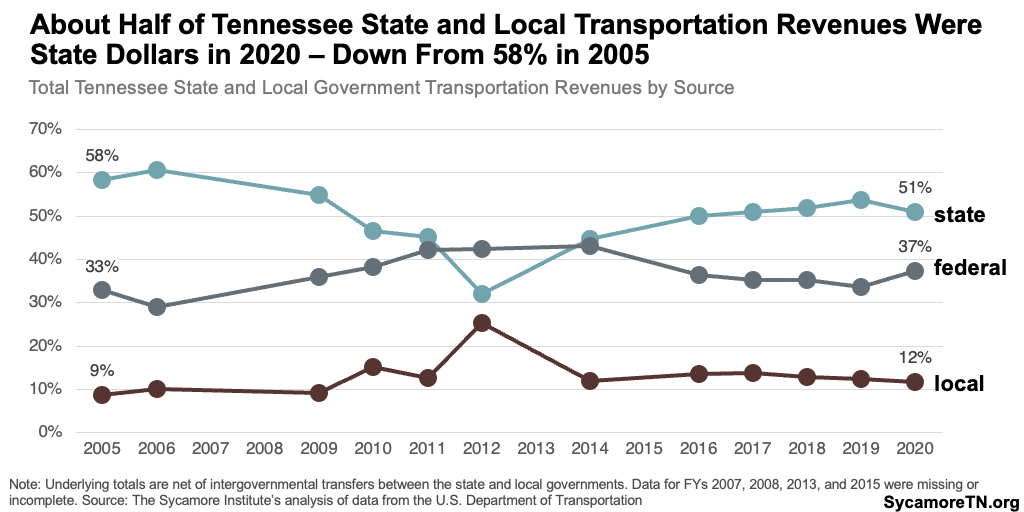
Transportation spending is covered by a mix of federal, state, and local funding (Figure 5). In FY 2020, for example, just over half of all the transportation revenues of Tennessee’s state and local governments were state dollars — down from about 58% in FY 2005 (Figure 6). As a share of all revenues, local governments are more dependent on state revenues than the state itself, which gets about half its money from the federal government. Federal dollars can only be spent on federal highway system roads and come with strings attached. Locals also contribute their dollars — often through allocations from property, local option sales, and mineral severance (e.g. coal) taxes. (1) (6)
Figure 6
2. It’s been 45 years since Tennessee borrowed money for road construction.
Tennessee is one of six states that does not use bonds to finance road construction — a matter of tradition, not law. (7) (1) Most other states and some local governments in Tennessee finance road construction using bonds. Tennessee has a constitutional balanced budget requirement for current operations, but the state is allowed to finance projects with a longer lifespan and does so for many capital projects. However, Tennessee has not issued bonds for transportation projects since 1977 and instead uses a “pay-as-you-go” model that pays for projects in real time with the state’s cash on hand. (8)
Issuing debt for transportation projects comes with trade-offs. Because Tennessee has one of the best credit ratings in the country, it could finance transportation projects at a relatively low cost (i.e. lower interest rates). The state’s current debt burden is also one of the lowest — declining 33% from $2.7 billion to $1.8 billion between FYs 2018-2022, after adjusting for inflation. (9) (10) (8) (11) Up-front debt commitments also provide more certainty for the state to begin larger, more expensive projects. The interest costs associated with borrowing, however, increase the overall costs of a project, and the state attributes its credit rating, in part, to the “pay-as-you-go” approach. (8) If Tennessee did issue debt for transportation projects, that might also affect the state’s interest rates on future debt.
3. Vehicle-related excise taxes set at specific, fixed levels are the largest funding sources for transportation projects in Tennessee.
Both the state and federal governments levy taxes and fees on the use of motor vehicles to fund transportation projects. For example, the state charges a $16.75 fee to register most personal vehicles, an additional $100 fee to register an electric vehicle, a 26¢ tax per gallon of gasoline, and a 27¢ tax per gallon of diesel. (12) (13) (14) (15) Each of these are excise taxes—a fixed amount per unit (e.g. per gallon of gas, per vehicle registration), and their amounts do not automatically adjust from year to year without legislative action.
Gas and fuel taxes have long been thought of as a type of user fee for roads. For decades, how much gas someone consumed roughly correlated with their use of roads. As a result, gas and fuel taxes long distributed the burden of funding roads proportionately based on usage of those roads. (7) However, advances in fuel efficiency and new technologies have effectively cut the ties between fuel consumption and road usage (see below).
Figure 7
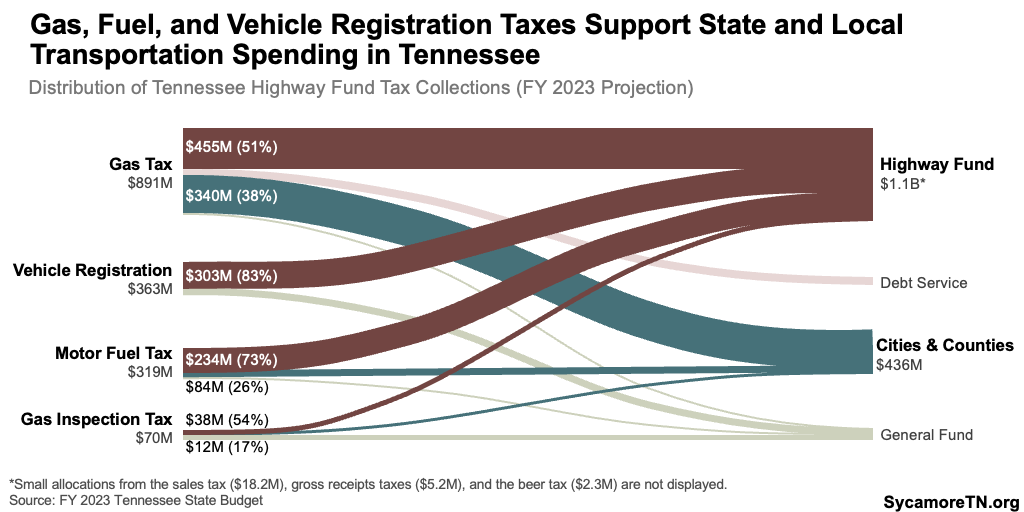
From state taxes and fees, a projected $1.1 billion will flow to Tennessee’s Highway Fund in FY 2023, and another $436 million will go to counties and cities for transportation (Figure 7). The specific allocations are dictated by the law associated with each individual tax and fee. For example, about 51% of the state’s gas tax collections, 83% of vehicle registration fees, 73% of diesel and other motor fuel taxes, and 54% of gas inspection taxes will be allocated to the state’s Highway Fund in FY 2023. (16)
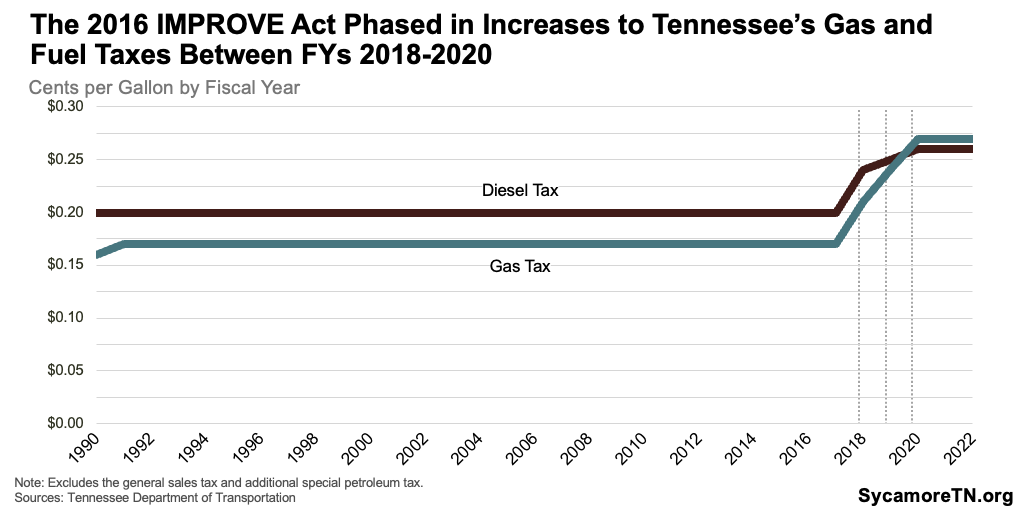
Tennessee increased many of these taxes and fees over the course of FYs 2018-2020 under the 2017 IMPROVE Act. For example, the IMPROVE Act raised the gas tax from 17¢ per gallon — set in 1990 — to 24¢ beginning in FY 2018, 25¢ in FY 2019, and ultimately 26¢ in FY 2020 (Figure 8). (14) The IMPROVE Act also increased diesel taxes and car registration fees, and it established a new $100 annual registration fee for electric vehicles. The law was intended to address a backlog of 962 specific projects that are now listed in law. (17)
Figure 8
4. The state’s vehicle-related excise taxes are not responsive to road funding needs.
The purchasing power of Tennessee’s transportation-related taxes and fees tend to fall over time because of their structure (Figure 9). For example, because the gas tax is an excise tax, the revenue it generates rises and falls with the number of gallons sold rather than the price per gallon—even as the costs of or demand for road construction rise.
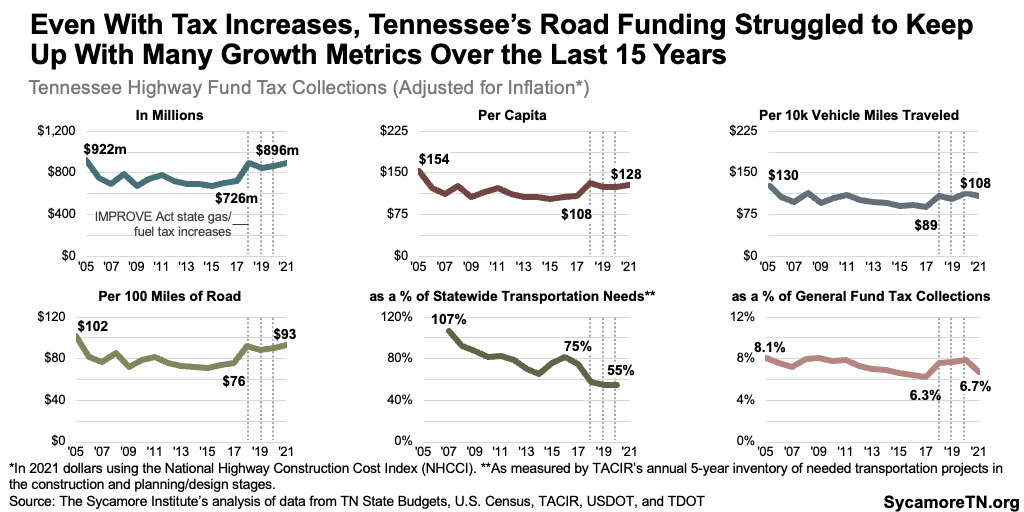
Even with recent tax increases, Tennessee’s Highway Fund revenues have struggled to keep up with many measures of growth and need over the last 15 years (Figure 9). The purchasing power of Highway Fund dollars declined in the years before the IMPROVE Act increases took effect. Those increases boosted collections, but no matter how it’s measured, that money didn’t go as far in FY 2021 as it did 15 years prior. Between FYs 2005-2021, the purchasing power of Tennessee’s Highway Fund collections fell 3% after adjusting for inflationary changes in road construction costs. Looking at other measures of growth and need, inflation-adjusted transportation revenues (16) (5):
- Road Mileage – Ticked down 9% relative to the number of miles of road in the state — from $102 per 100 miles of road in FY 2005 to $93 in FY 2021. (19)
- Other Taxes – Dropped 17% compared to General Fund tax collections — from 8.1% of General Fund revenues in FY 2005 to 6.7% in FY 2021. (16)
- Population Growth – Slid 17% after accounting for population growth — from $154 per capita to $128 between FYs 2005-2021. (20) (21)
- Vehicle Miles Traveled – Declined 17% against the number of miles traveled on Tennessee roads — dropping from $130 for every 10,000 vehicle miles traveled to $108. (19)
- Statewide Transportation Needs – Fell 48% relative to statewide transportation project needs estimates. In FY 2007, Highway Fund collections represented about 107% of needed transportation projects in the construction and planning/design stages as identified in the Tennessee Advisory Commission on Intergovernmental Relations (TACIR) 2007 5-year inventory. In FY 2020, these collections represented just 55% of the annual inventory total. (22)
Figure 9
In recent years, policymakers have supplemented the Highway Fund’s dedicated revenues with over $800 million from the General Fund to keep up with growing needs. These transfers included $200 million from the General Fund in FY 2022 and $630 million planned for FY 2023. (16) (7)
Of those transfers, $100 million was specifically to expedite the 962 approved IMPROVE Act projects – the timelines and costs for which have ballooned since the law’s initial introduction. Governor Haslam’s original IMPROVE Act proposal envisioned addressing all projects at a cost of $11 billion over 10 years. The final enacted version of the law retained every project but, compared to the initial proposal, raised taxes by less, phased the increases in over three years, and did not automatically adjust the tax rate for inflation. Due to these changes and recent cost increases, Governor Lee’s administration anticipates it would require $16 billion to complete the remaining projects, which would take over 50 years to finish at current funding levels. (23)
5. The pressures on these transportation funding sources could get worse.
Together, new and anticipated trends in fuel efficiency and vehicle weight could reduce transportation revenues while increasing road funding needs.
TACIR recently estimated that the switch to more fuel-efficient, hybrid, and electric vehicles could decrease the state’s annual transportation revenues by as much $130 million in 2030. (7) These estimates reflect recent trends and projections:
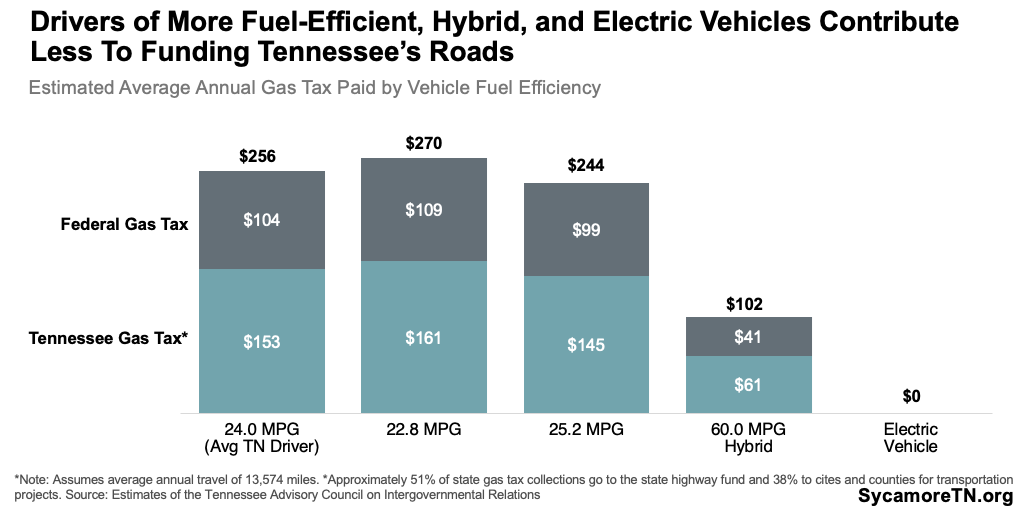
- Fuel Efficiency — Drivers of more fuel-efficient and hybrid vehicles spend less on gas and contribute less to funding roads — even without reducing their time on roads (Figure 10). In 2021, new cars got 25.4 miles per gallon, on average — a 32% gain since just 2004, and additional improvements are expected. (24) TACIR projects these trends will cause a $110 million hit to annual transportation revenues in 2030 and $171 million by 2040. (7)
- Electric Vehicles — EVs use no gasoline or diesel, so their owners contribute nothing in gas taxes (Figure 10). The IMPROVE Act included a new $100 EV registration fee — which out-of-state EV owners driving through Tennessee do not pay. It is also roughly 50% less than the estimated average gas tax paid by Tennesseans driving gas-powered vehicles (i.e. $153). (7) The state has invested heavily in attracting EV manufacturers to Tennessee (e.g. Ford’s Blue Oval City) and has plans for EV charging infrastructure across the state. TACIR estimated an annual impact of up to $16 million in 2030 and $52 million in 2040. (7)
Figure 10
Vehicles have also gotten heavier, which puts additional wear and tear on roads. Between 2004 and 2021, the weight of new cars increased by about 4%. (24) Meanwhile, EVs weigh more than comparable gas-powered models because of their heavier batteries. (25) (26) Increases in vehicle weight are associated with exponential growth in road wear and tear. According to TACIR’s research on the topic, “a 6,000-pound vehicle causes five times the wear of a 4,000-pound vehicle, not 1.5 times.” (7)
6. The state’s federal funding and locals’ state funding face these same challenges.
The same kind of fixed gas and fuel taxes finance the federal government’s Highway Trust Fund, from which most of Tennessee’s federal transportation funding comes. The federal Highway Trust Fund is largely funded by federal excise taxes on gas and diesel, which have not changed since 1993. For over a decade, federal funding allocations have outstripped collections. As a result, Congress has supplemented these funds with federal general fund dollars since FY 2008. (27)(28) Most of the state’s transportation spending that comes from the federal government (Figure 5) is financed by these dollars.
Tennessee currently only shares its gas and fuel taxes with local governments — but not other fees that are more immune to changes in vehicle technology (Figure 7). Like gas and fuel taxes, the state’s vehicle registration fees are not responsive to inflation, but they are insulated from the emerging effects of increased fuel efficiency and electric vehicle adoption. Tennessee’s vehicle registration fees—including the $100 electric vehicle fee—are not currently shared with local governments.
Parting Words
Roads are critical public infrastructure for a thriving Tennessee. They help Tennesseans get where they need to go and are necessary to move goods that fuel our state’s economy. Yet the traditional ways Tennessee funds roads are under stress and the system itself faces new challenges.
References
Click to Open/Close
1. Federal Highway Administration. 2006-2020 Highway Statistics Series Data. U.S. Department of Transportation. [Online] Each year accessed via https://www.fhwa.dot.gov/policyinformation/statistics.cfm
2. Tennessee Department of Transformation. Information obtained from TDOT. January 6, 2023.
3. Tennessee County Highway Officials Association. Information obtained from TCHOA. January 24, 2023.
4. U.S. Census Bureau. Annual Survey of State and Local Finance. Data downloaded from the Williamette University Government Finance Database. [Online] Available from https://willamette.edu/mba/research-impact/public-datasets/index.html
5. U.S. Department of Transportation. National Highway Construction Cost Index (NHCCI). Federal Highway Administration. [Online] https://explore.dot.gov/views/NHIInflationDashboard/NHCCI?%3Aiid=1&%3Aembed=y&%3AisGuestRedirectFromVizportal=y&%3Adisplay_count=n&%3AshowVizHome=n&%3Aorigin=viz_share_link
6. Tennessee Comptroller of the Treasury. TAG Exports: Revenues 2007-2021. Local Government Audit. [Online] Downloaded from https://comptroller.tn.gov/office-functions/la/e-services/tag-tableau/tag-exports.html
7. Tennessee Advisory Commission on Intergovernmental Relations (TACIR). Electric Vehicles and Other Issues Affecting Road and Highway Funding in Tennessee. [Online] December 2022. https://www.tn.gov/content/dam/tn/tacir/2022publications/2022_ElectricVehicles.pdf
8. State of Tennessee. Annual Comprehensive Financial Report for the Fiscal Year Ended June 30, 2022. [Online] December 2022. https://www.tn.gov/content/dam/tn/finance/acfr/ACFR_FY22.pdf
9. Csokasi, Marko. State and Local Governments With the Most Debt Per Capita. Governing. [Online] September 30, 2021. https://www.governing.com/finance/state-and-local-governments-with-the-most-debt-per-capita
10. State of Tennessee. Annual Comprehensive Financial Report for the Fiscal Year Ended June 30, 2018. [Online] December 2018. https://www.tn.gov/content/dam/tn/finance/acfr/acfr_fy18.pdf
11. U.S. Bureau of Economic Analysis. Gross Domestic Product: Chain-Type Price Index [GDPCTPI]. [Online] Retrieved from FRED, Federal Reserve Bank of St. Louis, https://fred.stlouisfed.org/series/GDPCTPI
12. State of Tennessee. Tenn. Code Ann. § 55-4-111. Accessed via Lexis.
13. —. Tenn. Code Ann. § 67-3-201. Accessed via Lexis.
14. —. Tenn. Code Ann. § 67-3-202. Accessed via Lexis.
15. —. Tenn. Code Ann. § 55-4-116. Accessed via Lexis.
16. —. Tennessee State Budgets for FYs 2007-2023. [Online] Available via https://www.tn.gov/finance/fa/fa-budget-information/fa-budget-archive.html
17. —. Public Chapter No. 181 (2017). [Online] April 26, 2017. https://publications.tnsosfiles.com/acts/110/pub/pc0181.pdf
18. Tennessee Department of Transportation. History of Tennessee’s Gas/Fuel Tax Rates. [Online] https://www.tn.gov/tdot/finance/gas-tax/gas-tax-history.html
19. —. Vehicle Miles Traveled Reports for 2005-2021. Highway Performance Monitoring System. [Online] Available from https://www.tn.gov/tdot/long-range-planning-home/longrange-road-inventory/longrange-road-inventory-highway-performance-monitoring-system.html
20. U.S. Census Bureau. Annual Estimates of the Resident Population for the United States, Regions, States, and Puerto Rico: April 1, 2010 to July 1, 2019 (NST-EST2019-01). [Online] December 2021. Available from https://www.census.gov/data/datasets/time-series/demo/popest/2010s-state-total.html
21. —. Annual Estimates of the Resident Population for the United States, Regions, States, District of Columbia and Puerto Rico: April 1, 2020 to July 1, 2022 (NST-EST2022-POP). [Online] December 2022. Available from https://www.census.gov/data/datasets/time-series/demo/popest/2020s-state-total.html
22. Tennessee Advisory Commission on Intergovernmental Relations (TACIR). Building Tennessee’s Tomorrow: Infrastructure Needs Inventory for 2007-2012 through 2020-2025. [Online] Available from https://www.tn.gov/tacir/infrastructure/infrastructure-reports-/building-tennessee-s-tomorrow-2020-2025.html
23. Tennessee Department of Transportation. Build With Us: Infrastructure Priorities (ppt presentation). [Online] https://www.tn.gov/content/dam/tn/tdot/build-with-us/Tennessee-Challenges-and-Solutions-2023.pdf
24. U.S. Environmental Protection Agency. 2022 Automotive Trends report. [Online] December 2022. https://www.epa.gov/automotive-trends/download-automotive-trends-report
25. Cooley, Brian. America’s New Weight Problem: Electric Cars. CNET. [Online] January 28, 2022. https://www.cnet.com/roadshow/news/americas-new-weight-problem-electric-cars/
26. Valdes-Dapena, Peter. Why Electric Cars Are So Much Heavier Than Regular Cars. CNN Business. [Online] June 7, 2021. https://www.cnn.com/2021/06/07/business/electric-vehicles-weight/index.html
27. Congressional Research Service. Federal Highway Programs: In Brief. [Online] February 7, 2022. https://crsreports.congress.gov/product/pdf/R/R47022
28. Kirk, Robert S. and Mallett, William J. Highway and Public Transit Funding Issues. Congressional Research Service. [Online] March 1, 2021. [Cited: January 10, 2023.] https://crsreports.congress.gov/product/pdf/IF/IF10495


