The COVID-19 pandemic caused by the new coronavirus poses both health and economic challenges for Tennessee. Signs clearly point to the start of a recession that will create financial difficulties for our state and local governments, which are currently crafting their budgets for the coming year.
However, some counties will likely see greater revenue declines than others due to differences in their local economies, budget policies, and the spread of and response to the virus. Consumer spending, in particular, has taken a swift hit as businesses closed their doors and Tennesseans stayed home. This report uses local sales tax data from before, during, and after the Great Recession to shed light on how these changes might affect a key source of revenue for county governments across Tennessee.
This is our second in a series of reports exploring different aspects of the relationship between state and local government in Tennessee.
Key Takeaways
- Sales taxes are most counties’ 2nd largest local tax revenue stream and a large source of funding for schools. In 17 counties, they generated 15% or more of all FY 2017 revenue.
- The coronavirus recession is expected to take a significant toll on sales tax receipts. The ultimate impact on state and local budgets remains unclear, but history can offer clues.
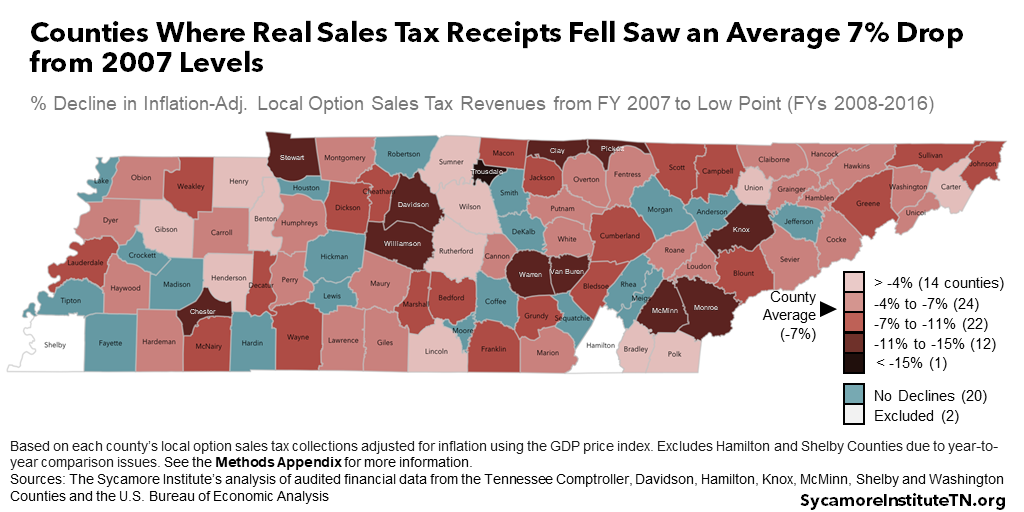
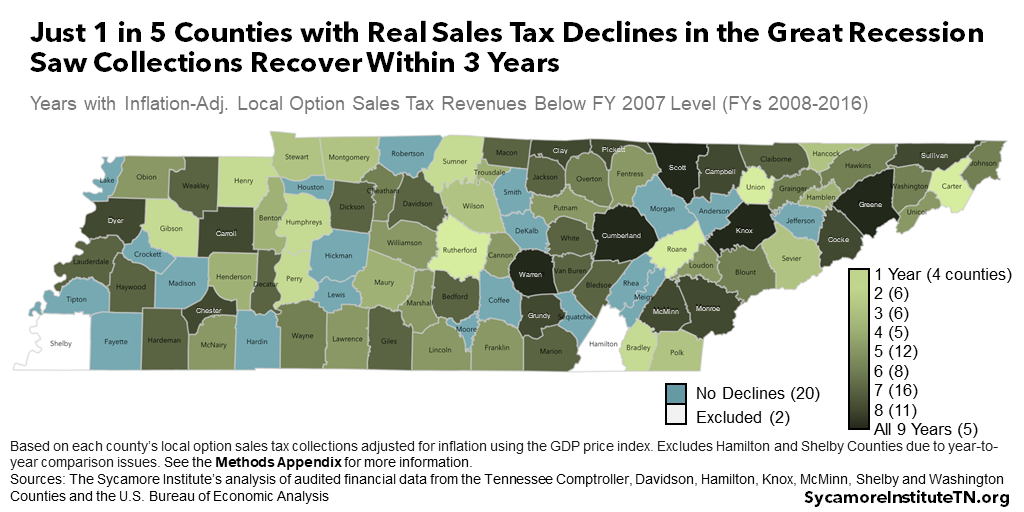
- During and after the Great Recession, inflation-adjusted local sales tax revenues fell in 75 counties. These counties averaged a 7% drop, and only 16 recovered within three years.
- Most counties where real sales tax receipts fell did not hit bottom until after the Great Recession ended.
- If past is precedent, a drop in local sales tax receipts this time may hit Blount, Cumberland, Carroll, Dickson, Dyer, Greene, Knox, Sevier, and Sullivan Counties the hardest.
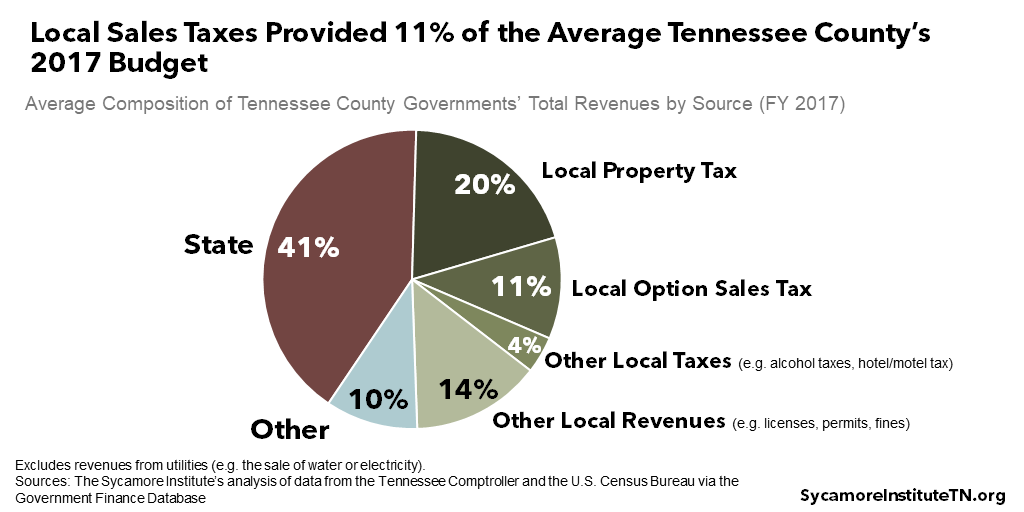
Local Sales Taxes Generate 11% of County Revenues, on Average
Sales taxes are most county governments’ second largest source of local tax revenue (Figure 1). Local governments have the option to levy their own sales tax of up to 2.75% in addition to the state’s 7% general sales tax and 4% grocery tax. On average, these local option sales taxes provided about 11% of counties’ total FY 2017 budgets while property taxes accounted 20%. (1) (2)
Figure 1
Some counties rely on local option sales taxes much more than others (Figure 2). In FY 2017, the local option sales tax ranged from about 1% of all revenues in Trousdale and McMinn Counties to 33% in Sevier County. In 17 counties, it generated 15% or more of all revenues. Across every county, local option sales tax collections totaled $2.3 billion in FY 2017. (1) (2)
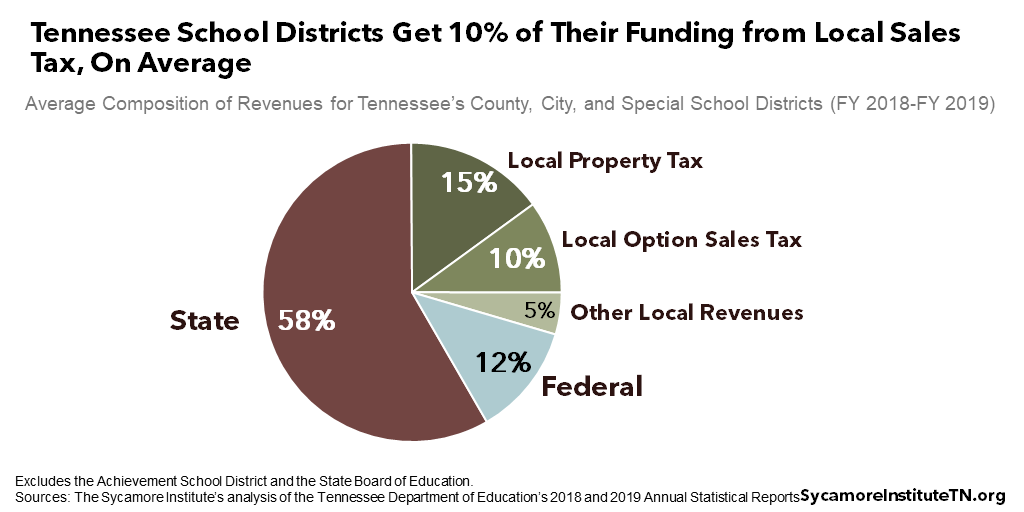
Local sales taxes are an important source of funding for public schools. State law requires cities and counties to use at least half of their local sales tax revenues for K-12 education. (4) For the 2018-2019 school year, local option sales taxes made up 10% of all revenues for the average Tennessee school district (Figure 3) – ranging from no sales tax dollars for the Morgan County school district to 38% for the Sevier County school district. (3)
Figure 2
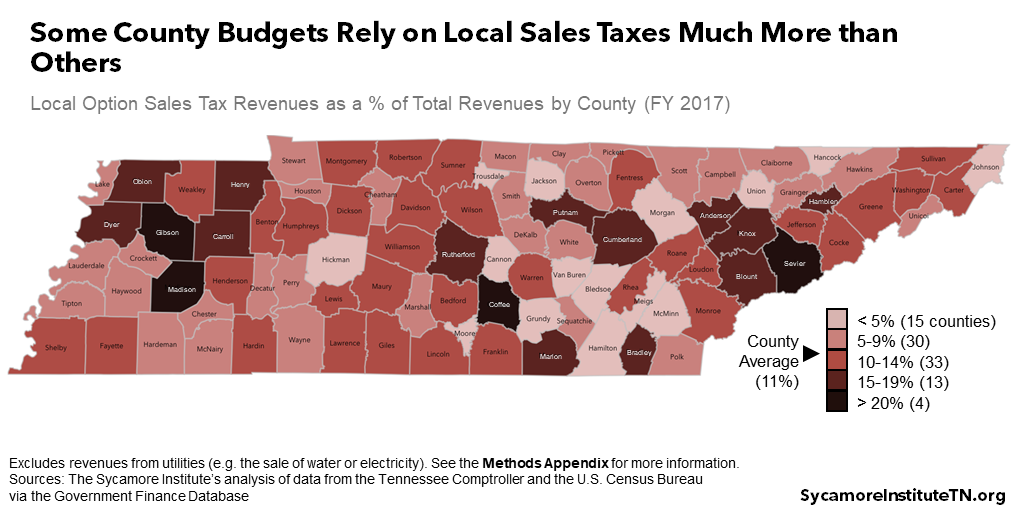
Figure 3
Coronavirus Recession Likely to Shrink Sales Tax Revenues
The coronavirus recession is expected to take a significant toll on sales tax revenues as consumer spending falls. Tennessee’s sales tax collections for April, which represent economic activity in March, were down 6% from last year. By the end of April, private sector data show consumer spending in several major industries had plunged across Tennessee. Spending fell 35% in restaurants and hotels, nearly 69% in entertainment and recreation, and nearly 65% on transportation compared to the start of the year. (5)
The ultimate impact on state and local government budgets remains unclear, but history can offer clues. While every economic downturn is different, knowing how previous recessions affected sales tax revenues could help policymakers respond to the current situation. Looking at the Great Recession, Tennessee’s state sales tax collections took four years to regain prior levels in nominal terms and nine years with inflation (Figure 4). (6) (7)
Figure 4
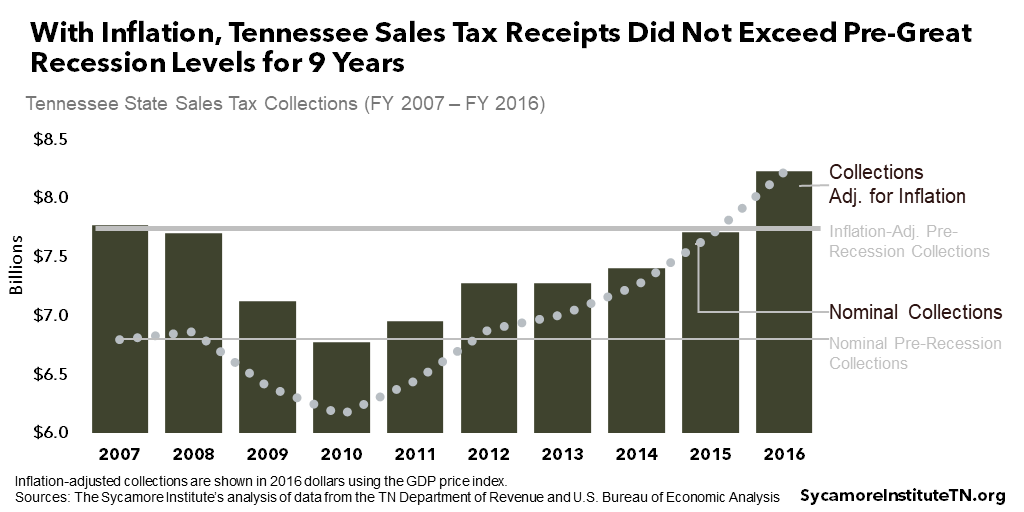
Figure 5
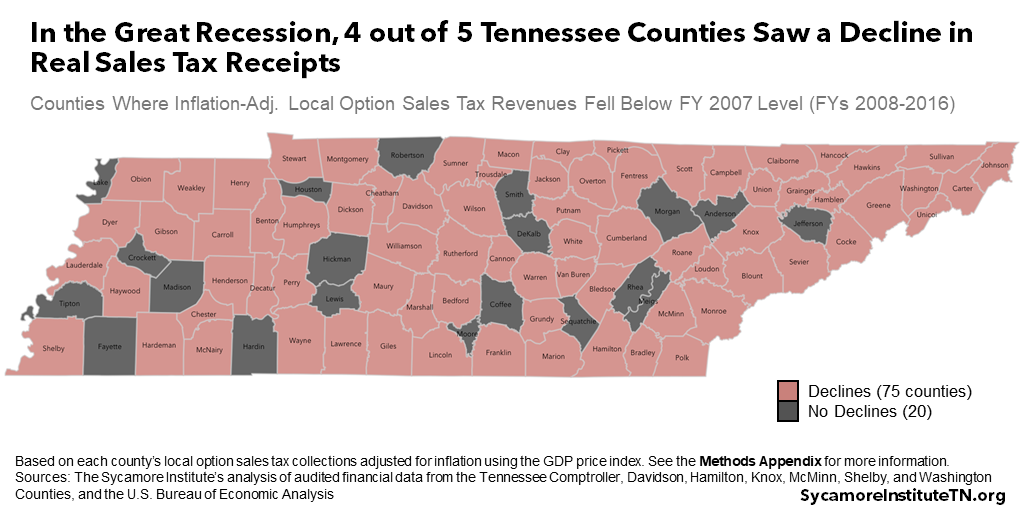
Real Sales Tax Receipts Fell in 75 Counties in the Great Recession
Adjusting for inflation, local option sales tax revenues fell in four out of five of Tennessee’s 95 counties during and after the Great Recession (Figure 5). (1) (9) (10) (11) (12) (13) (7) (14) Taking inflation into account allows apples-to-apples comparisons of the value of money over time. (8) The magnitude and duration of the decline varied widely. In the 75 counties where inflation-adjusted (i.e. “real”) local sales tax receipts fell:
- The average decline was about 7% below FY 2007 levels — ranging from -1.4% in Union County to -20% in Trousdale County and -15% in Van Buren, Clay and Davidson Counties.* (Figure 6)
Figure 6
- The vast majority did not hit bottom until FY 2010 or later, after the recession was officially over. (Figure 7) Thirty-nine counties collected their lowest sales tax receipts in FY 2010 or 2011, while 18 did not bottom out until FY 2014 or 2015.*
- Just one in five saw collections recover within three years.* Four counties took just one year to bounce back — Carter, Rhea, Rutherford, and Union. Five still had not regained their prior highs by FY 2016 — Cumberland, Greene, McMinn, Scott, and Warren. (Figure 8)
Note: Analyses marked with an asterisk (*) exclude Hamilton and Shelby Counties due to significant local policy changes that prevent accurate year-to-year comparisons. See the footnote at bottom for details.
Figure 7
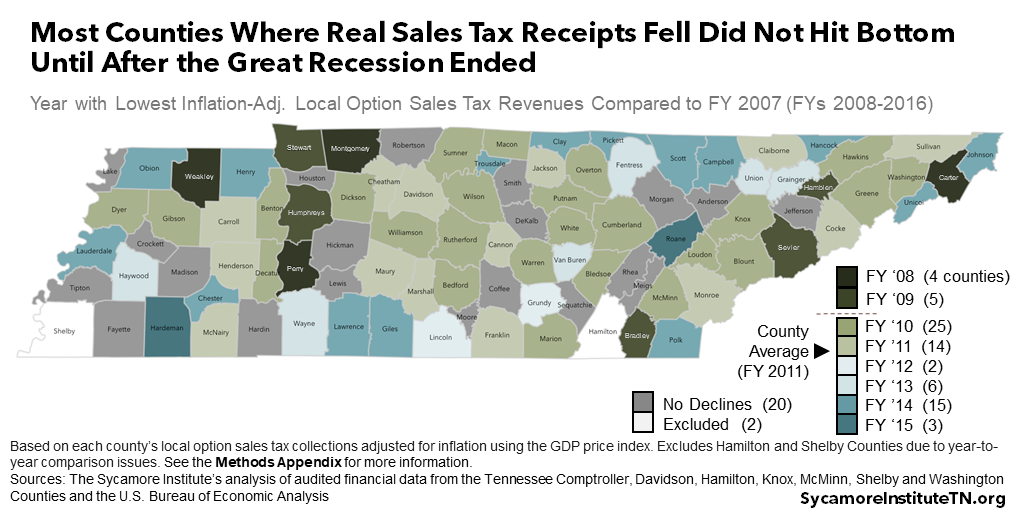
Figure 8
Sales tax rate increases in 12 counties appear to have prevented or mitigated a drop in their collections. Between FY 2008 and FY 2018, local sales tax rate increases took effect in 14 counties. Based on a comparison of actual inflation-adjusted collections to estimates of collections without the rate increase (15) (16):
- Local rate increases that went into effect in FYs 2008 and 2009 may have held off declines in Coffee, DeKalb, Jefferson, Rhea, and Robertson Counties, where real sales tax revenues never dropped below FY 2007 levels.
- Later increases in seven counties — Blount, Bradley, Carter, Gibson, Hamblen, Humphreys, and Sevier — may have shortened the time that these counties’ inflation-adjusted collections were below pre-recession levels.
- Increases in the remaining two counties — Hardin and Henry Counties — went into effect in FY 2016. Hardin never experienced a drop in collections, and Henry County’s collections had already recovered to their pre-recession levels by the time the increase went into effect.
One in four counties collected less inflation-adjusted local sales tax in FY 2018 than 11 years prior, even as the statewide average grew by 15% (Figure 9). (1) (9) (10) (11) (12) (13) (7) (14) Among the counties where inflation-adjusted sales tax revenues went up, growth ranged from just under 1% in Campbell and Bledsoe Counties to 104% in DeKalb County. This group includes all 14 counties that implemented rate increases during this period. (15) Meanwhile, FY 2018 collections in 23 counties were below FY 2007 levels, when accounting for inflation — with Grundy County’s 9% drop being the largest. In 19 of those counties, collections either did not decline during the Great Recession or declined, recovered, and then fell again.
See Methods Appendix for analysis of collections not adjusted for inflation.
Figure 9

Which Counties’ Budgets May Be Hardest Hit?
Every recession is different. Consumer spending and employment in the Great Recession both fell much more gradually than today, when people began staying home en masse and businesses shut their doors practically overnight.
These differences and changes to local economies since the last recession may affect how county revenues shift today. For example, if college students don’t return to campus in the fall, counties with large student populations could see a larger decline than otherwise expected. Likewise, Nashville’s tourism boom likely means it has and will get hit harder this time around. Meanwhile, rural areas with fewer COVID-19 cases could be spared some of the most extreme economic effects.
If past is precedent, however, a drop in local sales tax receipts may hit certain counties harder based on their sales tax reliance and their experience during and after the Great Recession. A handful of counties — including Blount, Cumberland, Carroll, Dickson, Dyer, Greene, Knox, and Sullivan — saw large and/or lengthy declines in the wake of the Great Recession and also rely more on local option sales tax than most other counties. Sevier County may also be at greater risk given its especially high dependence on local option sales tax and the significant role of tourism in its economy (Table 1). See the Methods Appendix for a full list of the most at-risk counties for each metric.
Table 1
Tennessee Counties that Could Face the Most Financial Pressure from a Drop in Local Sales Tax Revenues
| County | Local Sales Tax Revenues as a % of Total Revenues (FY 2017) | Rank (High to Low) | Inflation-Adjusted Local Option Sales Tax Revenue Declines Below FY 2007 Level (FYs ’08-’16) | |||
| % Decline at Lowest Level | Rank (High to Low) | Duration (years) | Rank (High to Low) |
|||
| Sevier | 33% | 1 | -5% | 50 | 3 | 58 |
| Cumberland | 18% | 8 | -11% | 15 | 9 | 1 |
| Dyer | 18% | 9 | -6% | 44 | 8 | 6 |
| Blount | 18% | 12 | -11% | 15 | 6 | 33 |
| Knox | 17% | 14 | -13% | 7 | 9 | 1 |
| Carroll | 17% | 15 | -7% | 37 | 8 | 6 |
| Dickson | 14% | 19 | -9% | 23 | 7 | 17 |
| Sullivan | 14% | 21 | -9% | 18 | 8 | 6 |
| Greene | 14% | 23 | -9% | 20 | 9 | 1 |
Sources: The Sycamore Institute’s analysis of data from the Tennessee Comptroller (1), the U.S. Bureau of Economic Analysis (7), the Tennessee Department of Revenue (15), and Davidson, Hamilton, Knox, McMinn, Shelby, and Washington Counties (1) (9) (10) (11) (12) (13) (14), and the U.S. Census Bureau via the Government Finance Database (2)
Parting Words
Many of Tennessee’s local governments will likely face significant financial challenges as a result of the ongoing pandemic. Even as our economy falls rapidly into recession, cities and counties across the state are attempting to craft their budgets for the coming year. In addition to the spread of and response to COVD-19, the makeup of local economies and the mix of local revenues will determine how this downturn impacts each county’s financial situation. As state and local policymakers consider how to respond, the Great Recession’s wide-ranging effects on local sales tax revenues may shed light on the challenges to come.
References
Click to Open/Close
- Tennessee Comptroller of the Treasury. Local Government Audited Financial Data for FY 2007 – FY 2019. [Online] [Cited: April 8, 2020.] Data provided by the Division of Local Government Audit on April 3, 2020.
- Hand, Michael, Pierson, Kawika and Thompson, Fred. The Government Finance Database: A Common Resource for Quantitative Research in Public Financial Analysis. Willamette University. [Online] [Cited: February 4, 2020.] Accessed via The Government Finance Database at https://willamette.edu/mba/research-impact/public-datasets/.
- Tennessee Department of Education. 2017-2018 and 2018-2019 Annual Statistical Reports (Tables 16 and 19). [Online] [Accessed on May 19, 2020.] https://www.tn.gov/education/data/department-reports/2019-annual-statistical-report.html.
- State of Tennessee. Tenn. Code Ann. § 67-6-712. [Online] [Accessed on April 21, 2020.]
- Chetty, Raj, et al. Real-Time Economics: A New Platform to Track the Impacts of COVID-19 on People, Businesses, and Communities Using Private Sector Data. Opportunity Insights. [Online] May 2020. https://tracker.opportunityinsights.org/.
- Revenue, Tennessee Department of. Collections Spreadsheets by Fiscal Year for FYs 2007-2016. [Online] [Accessed on April 9, 2020.] Obtained from https://www.tn.gov/revenue/tax-resources/statistics-and-collections/collections-spreadsheets-by-fiscal-year.html.
- U.S. Bureau of Economic Analysis. National Income and Product Accounts: Table 1.1.4 Price Indexes for Gross Domestic Product. [Online] March 26, 2020. [Accessed on April 9, 2020.] https://apps.bea.gov/iTable/iTable.cfm?reqid=19&step=3&isuri=1&select_all_years=0&nipa_table_list=4&series=a&first_year=1990&last_year=2019&scale=-99&categories=survey&thetable=.
- —. Prices & Inflation. [Online] September 6, 2018. [Accessed on April 9, 2020.] https://www.bea.gov/resources/learning-center/what-to-know-prices-inflation.
- Washington County. Washington County Comprehensive Annual Financial Reports for 2007-2018. [Online] [Accessed on April 8, 2020.] Available from https://comptroller.tn.gov/advanced-search.html#%7B%22county%22:%22washington%22,%22type%22:%22audit%22,%22entity%22:%22county%22,%22division%22:%22local-government-audit%22%7D.
- McMinn County. McMinn County Annual Financial Report for 2007-2018. [Online] [Accessed on April 8, 2020.] Available from https://comptroller.tn.gov/advanced-search.html#%7B%22county%22:%22mcminn%22,%22type%22:%22audit%22,%22entity%22:%22county%22,%22division%22:%22local-government-audit%22%7D.
- Knox County. Knox County Comprehensive Annual Financial Reports for 2007-2018. [Online] [Accessed on April 8, 2020.] Available from https://comptroller.tn.gov/advanced-search.html#%7B%22county%22:%22knox%22,%22type%22:%22audit%22,%22entity%22:%22county%22,%22division%22:%22local-government-audit%22%7D.
- Hamilton County. Hamilton County Comprehensive Annual Financial Reports for 2007-2018. [Online] [Accessed on April 8, 2020.] Available from https://comptroller.tn.gov/advanced-search.html#%7B%22county%22:%22hamilton%22,%22type%22:%22audit%22,%22entity%22:%22county%22,%22division%22:%22local-government-audit%22%7D.
- Metropolitan Government of Nashville and Davidson County. Metropolitan Government of Nashville and Davidson County Comprehensive Annual Financial Reports for 2007-2018. [Online] [Accessed on April 8, 2020.] Available from https://comptroller.tn.gov/advanced-search.html#%7B%22county%22:%22davidson%22,%22type%22:%22audit%22,%22entity%22:%22county%22,%22division%22:%22local-government-audit%22%7D.
- Shelby County. Shelby County Comprehensive Annual Financial Reports for 2007-2019. [Online] [Accessed on April 13, 2020.] Available from https://comptroller.tn.gov/advanced-search.html#{%22q%22:%22*%22,%22filters%22:%22{%22division%22:%22cot:division/local-government-audit%22,%22county%22:%22cot:county/shelby%22,%22entity%22:%22cot:entity/county%22,%22type%22:.
- The Sycamore Institute’s analysis of financial data from the Tennessee Comptroller’s Office (cited above) and local tax rate information from the Tennessee Department of Revenues . [Online] April 13, 2020. Local option sales tax rate infromation obtained from https://www.tn.gov/content/dam/tn/revenue/documents/taxes/sales/taxlist.pdf.
- University of Tennessee County Technical Assistance Center. Tennessee County Tax Statistics: November 2004 (28th Edition). [Online] November 2004. http://www.ctas.tennessee.edu/sites/default/files/2004%20Tax%20Stats.pdf.
- Tennessee Department of Education. 2018-2019 Annual Statistical Report (Table 7). [Online] [Accessed on April 13, 2020.] Available from https://www.tn.gov/education/data/department-reports/2019-annual-statistical-report.html.
* Hamilton and Shelby Counties are excluded from most analyses in this report for the following reasons.
- In FY 2012, Hamilton County’s 1966 sales tax agreement with the City of Chattanooga ended. This had a significant impact on the county’s revenues that our analysis could not disentangle.
- In FY 2014, the school districts within Shelby County underwent a significant reorganization. This prevented accurate financial comparisons of Shelby County Schools before and after the reorganization.
Featured photo by Don Sniegowski