This report on indicators of opioid abuse in Tennessee and a companion report on recent opioid-related policy actions supplement Part 1 of our August 2017 introductory series on Tennessee’s opioid epidemic.
Key Takeaways
The most up-to-date data show recent trends persist. The supply and potency of prescription opioids in Tennessee are falling, but negative outcomes associated with opioid abuse continue to climb:
- From 2016 to 2017, the number of opioid prescriptions and their total morphine milligram equivalents (MMEs) fell 9% and 13%, respectively.
- Cases of neonatal abstinence syndrome (NAS) rose 2% in 2017 to 1,090 — up from 1,071 in 2016 — but have started to decline in 2018.
- Opioid-related overdose deaths rose 15% in 2016 to 1,186 — up from 1,034 in 2015. Deaths involving heroin jumped 27% and synthetic opioids (e.g. fentanyl) surged by 58%.
Tennessee has implemented a variety of measures to combat opioid abuse, but the epidemic has evolved. In our 2017 summary of key policy milestones and indicators of progress, we found that the number and potency of opioid prescriptions was falling, but overdose deaths and other negative outcomes of opioid abuse continued to rise.
The most recent data show that opioid prescribing and dispensing continue to fall, while the negative outcomes associated with opioid abuse continue to climb. (See 1-page Infographic.) All figures below show the most recent 10 years of data, where available.
Infographic

Prescribing and Dispensing Patterns
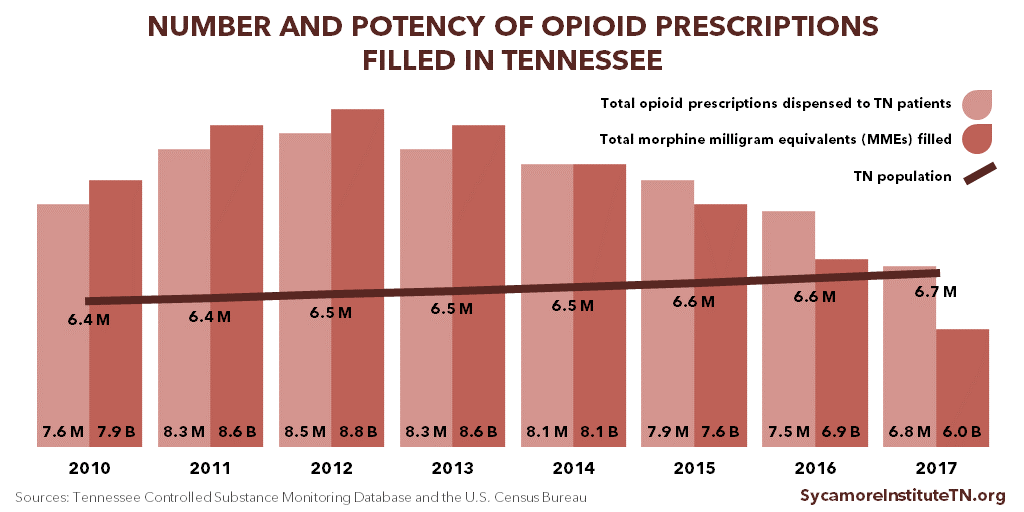
Tennessee providers’ use of the state’s controlled substance monitoring database (CSMD) continued to increase in 2017, and the number and potency of prescriptions continued to decline. (Figure 1)
- Registration for the database continued to increase steadily. In 2017, there were 47,294 registrants — up from 46,576 in 2016. (1)
- The ratio of opioid prescriptions requested to the number actually dispensed improved from 2.6:1 in 2016 to 2.0:1 in 2017 — down from 13.8:1 in 2010. This suggests that practitioners are checking the database more frequently when treating patients and that fewer patients are attempting to “doctor shop.” (1)
- Between 2016 and 2017, the number of opioid prescriptions in Tennessee and their total morphine milligram equivalents (MMEs) fell 9% and 13%, respectively. (1) MMEs are a way to measure the strength of an opioid prescription. Higher MMEs represent higher dosages.
- From their 2012 peak, total opioid prescriptions and MMEs were down 20% and 32%, respectively. (1) However, there remained more than 1 opioid prescription for every Tennessean in 2017.
Figure 1
Prescription Opioid Misuse and Heroin Use
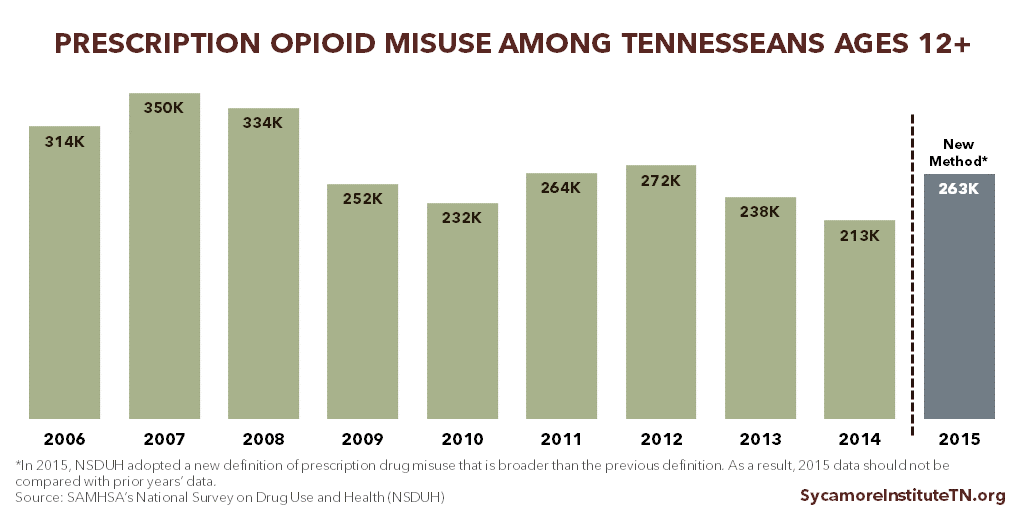
The U.S. Substance Abuse and Mental Health Services Administration (SAMHSA) tracks trends in drug use through the National Survey on Drug Use and Health (NSDUH). In 2015, the NSDUH was redesigned. As a result, most 2015 data on prescription opioid misuse are no longer comparable to previous years. (3)
- In 2015 and 2016, an estimated 263,000 Tennesseans ages 12+ (or about 4.8%) had misused prescription pain relievers within the last year (Figure 2). An estimated 18% of these individuals (or about 48,000 Tennesseans) had a pain reliever use disorder. (4) (5)
- In 2015 and 2016, an estimated 14,000 Tennesseans ages 12+ had used heroin within the last year. (4) (5)
Figure 2
Neonatal Abstinence Syndrome
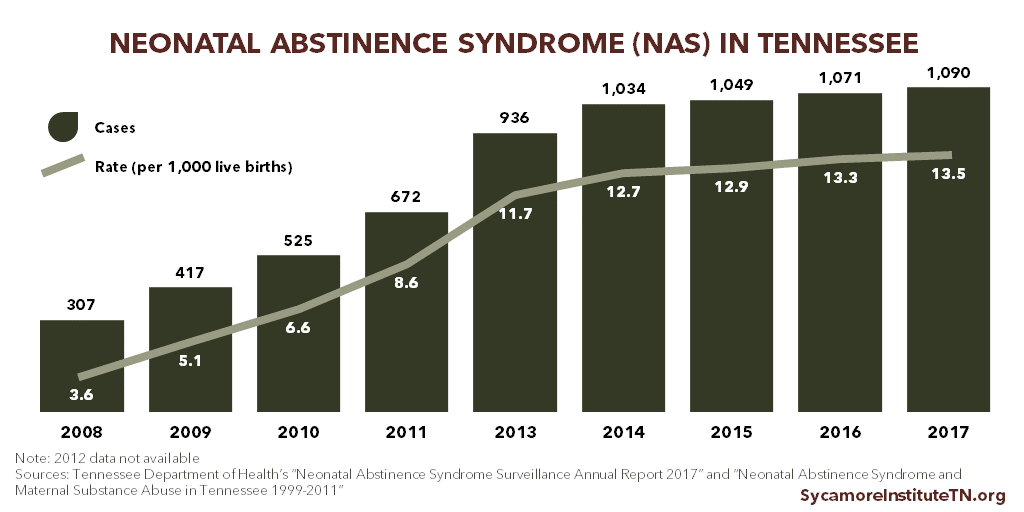
The number and rate of babies born in Tennessee with opioid withdrawal symptoms resulting from their mothers’ opioid use increased slightly in 2017. (Figure 3) These symptoms are known as neonatal abstinence syndrome (NAS).
- Between 2016 and 2017, Tennessee births involving NAS rose from 1,071 to 1,090, a 2% increase.[i] In 2017, about 13.5 of every 1,000 live births involved NAS, also a 2% increase from the 2016 rate of 13.3. (6)
- Annual NAS cases have not peaked in Tennessee. For comparison, however, the number of NAS cases grew 255% from 2008 to 2017, the last 10 years of available data. The rate of annual growth in cases began to slow in 2015. (7) (6)
- Recent weekly reporting shows that the number of NAS cases in 2018 are declining. The number of cases from January-June 2018 are down 26% from January-June 2017. (8) (9)
- About 70% of the NAS cases in 2017 include infants born to mothers on medication-assisted treatment (MAT) for opioid abuse (i.e. methadone, buprenorphine). This is about the same rate as in 2016. (6)
Figure 3
Opioid-Related Hospital Use
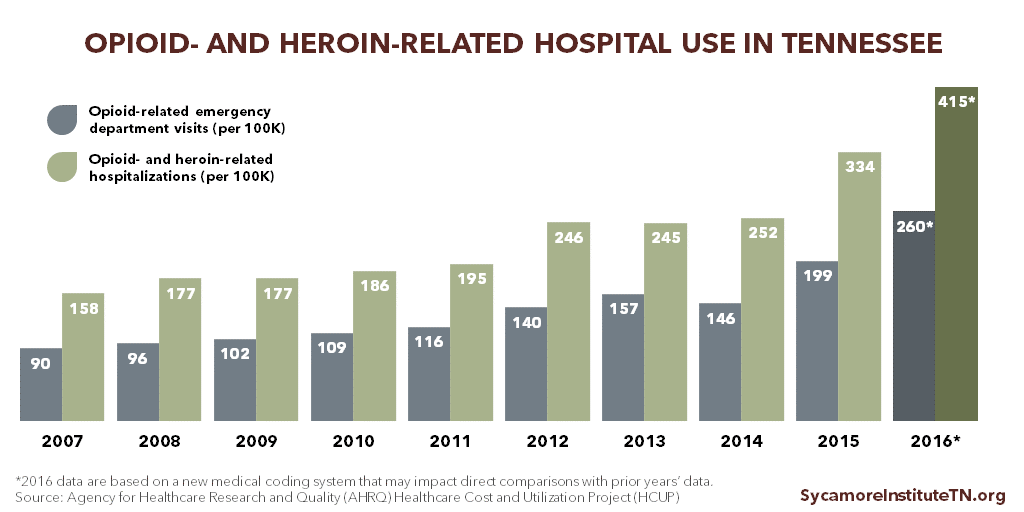
Tennessee’s rates of opioid-related emergency department visits and inpatient hospital stays continued to rise in 2016. (Figure 4) Part of the 2015 and all of the 2016 data reflect a transition to a new, more refined medical coding system. The new method may capture opioid-related hospitalizations that were missed in prior years. As such, one should analyze the magnitude of the apparent trends from 2015 to 2016 with caution. (11)
For every 100,000 Tennesseans in 2016, there were 415 admissions to the hospital due to opioid or heroin use and another 260 emergency department visits without an inpatient stay. (12)
Figure 4
Drug Overdose Deaths
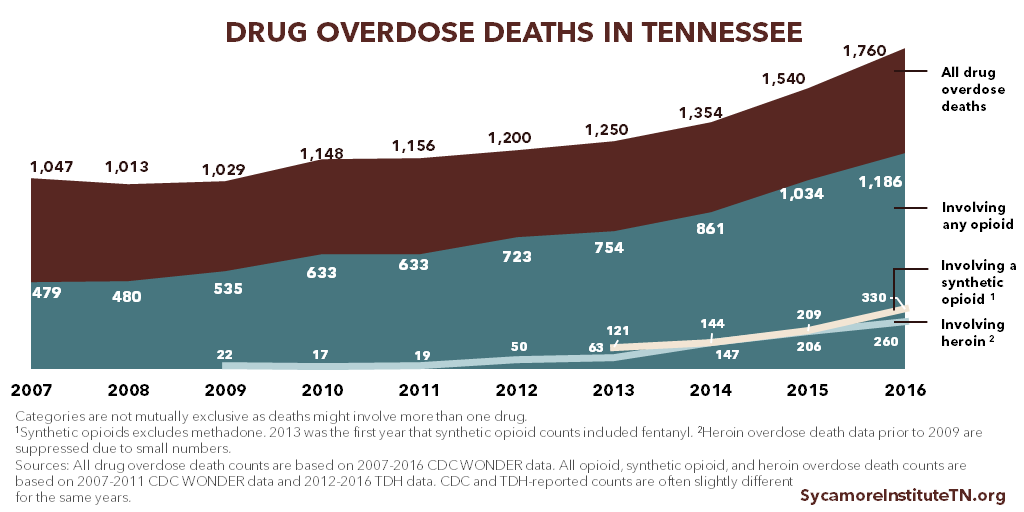
The number of drug overdose deaths in Tennessee continued to grow in 2017, with especially high growth rates for deaths involving heroin and synthetic opioids like fentanyl. (Figure 5)
- From 2015 to 2016, the total number of drug overdose deaths increased by 14%. (14)
- Total opioid-related overdose deaths grew 15%, from 1,034 to 1,186. Deaths involving heroin jumped 27%, from 205 in 2015 to 260 in 2016. Overdose deaths involving synthetic opioids (excluding methadone) like fentanyl surged 58%, from 209 to 330. (15)
- Opioid-related overdose deaths have not yet peaked in Tennessee. For comparison, the number of total opioid-related overdose deaths grew 148% from 2007 to 2016, the last 10 years of available data. (14)(15)
Figure 5
Parting Words
Little has changed in overall opioid-related trends since our previous report in August 2017. These data show that Tennessee’s adoption of evidence-based policies to address the opioid epidemic have helped reduce the supply of opioid prescriptions. However, the negative outcomes of opioid addiction continue to rise. In a companion report to this one, we summarize the new policies Tennessee has adopted to address the opioid epidemic since our 2017 review.
[i] The number of 2016 NAS cases differs from that shown in previous TSI reports. The 2017 TDH NAS data also included an updated NAS number for 2016.
References
Click to Open/Close
- Tennessee Department of Health. Controlled Substance Monitoring Database: 2018 Report to the 110th Tennessee General Assembly. [Online] March 1, 2018. https://www.tn.gov/content/dam/tn/health/healthprofboards/csmd/2018%20Comprehensive%20CSMD%20Annual%20Report.pdf.
- U.S Census Bureau, Population Division. Annual Estimates of the Resident Population: April 1, 2010 to July 1, 2017 . [Online] December 2017. [Accessed on May 29, 2018.] Accessed via https://factfinder.census.gov/.
- U.S. Substance Abuse and Mental Health Services Administration. Results from the 2015 National Survey on Drug Use and Health: Notable 2015 NSDUH Questionnaire Changes. [Online] 2016. [Accessed on April 10, 2018.] https://www.samhsa.gov/data/sites/default/files/NSDUH-FFR1-2015/NSDUH-FFR1-2015/NSDUH-FFR1-2015.pdf.
- U.S. Substance Abuse and Mental Health Services Administration (SAMHSA). 2015-2016 National Surveys on Drug Use and Health: Model-Based Estimated Totals (Tables 9, 11, and 20). [Online] 2017. [Accessed on April 10, 2018.] https://www.samhsa.gov/data/sites/default/files/NSDUHsaeTotal2016/NSDUHsaeTotals2016.pdf.
- U.S. Substance Abuse and Mental Health Services Administration. 2015-2016 National Surveys on Drug Use and Health: Model-Based Prevalence Estimates (Tables 9, 11, and 20). [Online] 2017. [Accessed on April 10, 2018.] https://www.samhsa.gov/data/sites/default/files/NSDUHsaePercents2016/NSDUHsaePercents2016.pdf.
- Miller, Angela, McDonald, Morgan and Warren, Michael. Neonatal Abstinence Syndrome Surveillance Annual Report 2017. Tennessee Department of Health. [Online] May 2018. [Accessed on May 21, 2018.] https://www.tn.gov/content/dam/tn/health/documents/nas/NAS%20Annual%20Report%202017%20FINAL.pdf.
- Bauer, Audrey M and Li, Yinmei. Neonatal Abstinence Syndrome and Maternal Substance Abuse in Tennessee: 1999-2011. Tennessee Department of Health. [Online] 2013. https://www.tn.gov/assets/entities/health/attachments/Neonatal_Abstinence_Syndrome_and_Maternal_Substance_Abuse_in_Tennessee_1999-2011.pdf.
- Tennessee Department of Health. Neonatal Abstinence Syndrome Surveillance Summary – Week 26: June 25-July 1, 2017. [Online] 2017 July. [Accessed on July 5, 2018.] https://www.tn.gov/content/dam/tn/health/documents/NASsummary_Week_2617.pdf.
- —. Neonatal Abstinence Syndrome Surveillance Summary – Week 26: June 24-June 30, 2018. [Online] July 2018. [Accessed on July 5, 2018.] https://www.tn.gov/content/dam/tn/health/documents/nas/NASsummary_Week_2618.pdf.
- U.S. Substance Abuse and Mental Health Services Administration (SAMHSA). Interactive NSDUH State Estimates. [Online] Accessed via
https://pdas.samhsa.gov/saes/state. - Heslin, Kevin, et al. Trends in Opioid-related Inpatient Stays Shifted After the US Transitioned to ICD-10-CM Diagnosis Coding in 2015. Medical Care. [Online] 2017. https://www.hcup-us.ahrq.gov/datainnovations/Opioid_trends_ICD_Med_Care.pdf.
- Agency for Healthcare Research and Quality (AHRQ). HCUP Fast Stats: Healthcare Cost and Utilization Project (HCUP). [Online] April 2018. [Accessed on May 21, 2018.] Accessed via https://www.hcup-us.ahrq.gov/faststats/OpioidUseServlet.
- —. State Emergency Department Databases (SEDD). Healthcare Cost and Utilization Project (HCUP). [Online] April 2018. [Accessed on May 21, 2018.] Accessed via https://www.hcup-us.ahrq.gov/faststats/OpioidUseServlet.
- U.S. Centers for Disease Control and Prevention (CDC). CDC WONDER Multiple Cause of Death Files, 1999-2016. [Online] [Accessed on May 22, 2018.] Accessed via https://wonder.cdc.gov/mcd-icd10.html.
- Tennessee Department of Health. Prescription Drug Overdose Program 2018 Report: Understanding and Responding to the Opioid Epidemic in Tennessee using Mortality, Morbidity, and Prescription Data. [Online] February 2, 2018. [Accessed on May 22, 2018.] https://www.tn.gov/content/dam/tn/health/documents/pdo/PDO_2018_Report_02.06.18.pdf.