
Key Takeaways
- Tennessee lagged the U.S. on several key indicators of socioeconomic success in 2020.
- Due to pandemic-related disruptions, these estimates are not considered comparable to prior years, which makes it difficult to assess how the pandemic affected Tennesseans in 2020.
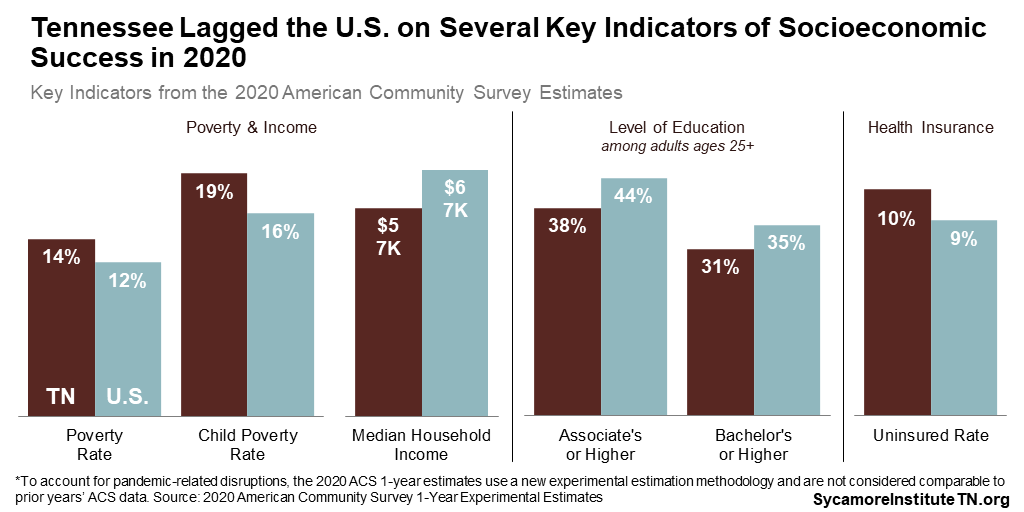
The U.S. Census Bureau released new data in November on income, poverty, education, and health insurance coverage across the U.S. in 2020 (Figure 1). Here are our top takeaways for Tennessee.
Figure 1
Income & Poverty
An estimated 14% of Tennesseans and 19% of Tennessee children were in households with incomes below the official poverty line in 2020. Both rates were higher than the national rates. The overall poverty rate was the 12th highest in the country while child poverty was the 13th highest. (1)
Tennessee’s median household income was about $57,000 in 2020. In other words, half of Tennessee households earned less than $57,000 in 2020, and half earned more. This is about 15% lower than the national median income and the 9th lowest among all states. (1)
Education
About 38% of Tennesseans 25 and older had at least an associate’s degree in 2020, and about 31% had at least a bachelor’s degree. Nationally, about 44% had at least an associate’s and 35% at least a bachelor’s. Tennessee’s share with at least an associate’s was the 10th lowest in the country, and those with at least a bachelor’s was the 15th lowest. (1)
Health Insurance Coverage
About 1 in 10 Tennesseans did not have health insurance coverage in 2020. Nationally, about 9% were uninsured. Tennessee’s uninsured rate was the 12th highest in the country. (1)
The Impact of COVID-19 on Data Collection
Data limitations make it difficult to assess how the COVID-19 pandemic affected Tennesseans in 2020. Each year, the ACS produces estimates based on a sample of the U.S. population. If the sample is too small or doesn’t accurately reflect the population in some key way, these estimates will likely be incorrect. Disruptions caused by the COVID-19 pandemic fundamentally shifted who the Census Bureau was able to reach and who responded to the survey. To account for these changes, the Census Bureau changed how they weighted survey responses to produce estimates for the larger population. They also released far fewer estimates than in years past. Because both the sample surveyed and the estimation methods differ from prior years, the 2020 estimates are not considered comparable to prior estimates. (2)
With these limitations in mind, Figures 2-5 provide Tennessee data back to 2010 for each measure. (2)
Figure 2
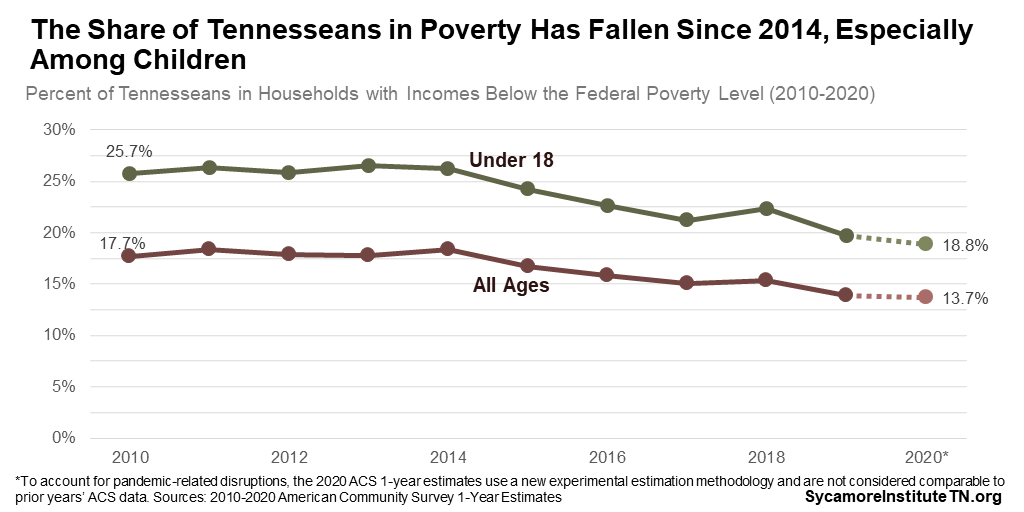
Figure 3
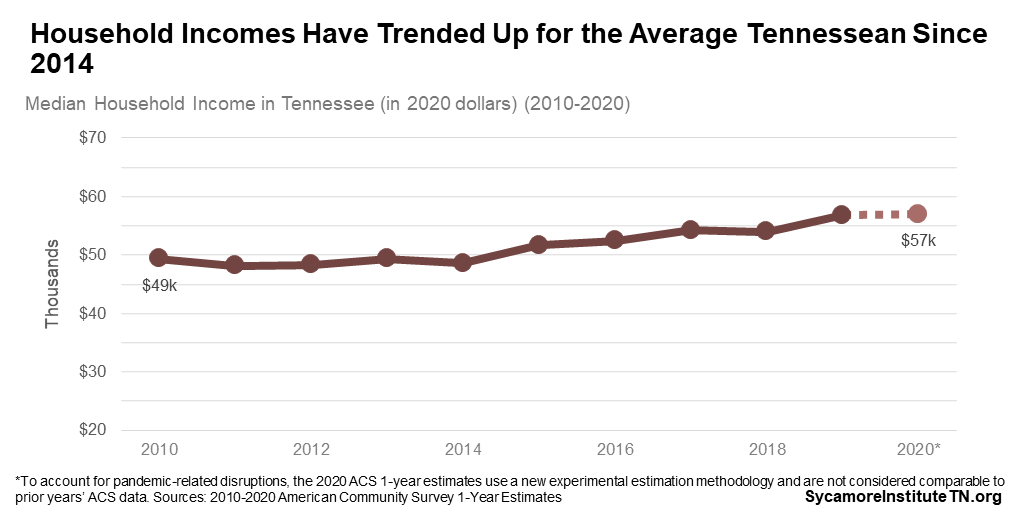
Figure 4
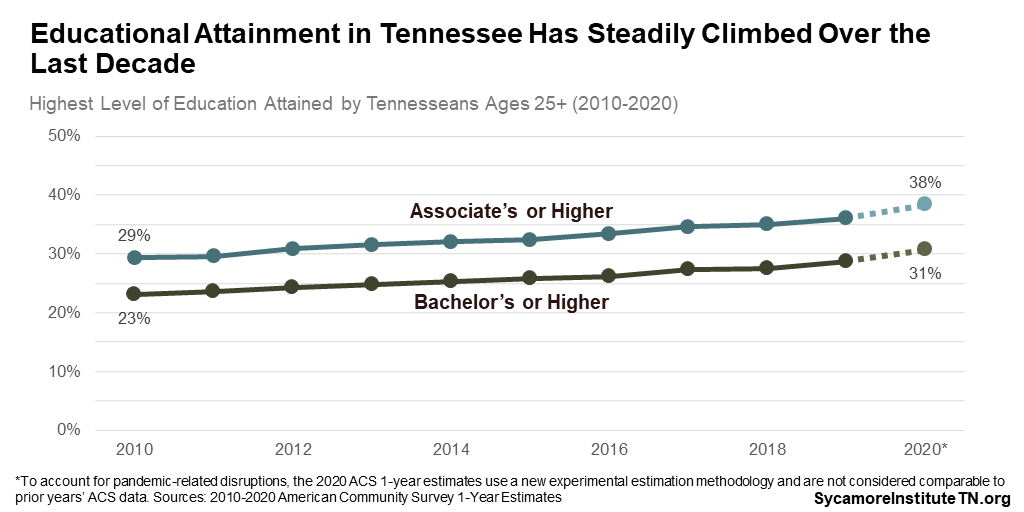
Figure 5

References
Click to Open/Close
- U.S. Census Bureau. 2020 ACS 1-Year Experimental Data Tables. [Online] November 30, 2021. https://www.census.gov/programs-surveys/acs/data/experimental-data/1-year.html
- —. An Assessment of the COVID-19 Pandemic’s Impact on the 2020 ACS 1-Year Data. [Online] October 27, 2021. https://www.census.gov/content/dam/Census/library/working-papers/2021/acs/2021_CensusBureau_01.pdf
- —. 2010-2019 American Community Survey 1-Year Estimates. [Online] 2011-2020. Data accessed via http://data.census.gov
- U.S Bureau of Labor Statistics. CPI-U-RS. [Online] March 12, 2021. Data accessed from https://www.bls.gov/cpi/research-series/r-cpi-u-rs-home.htm


