Below are highlights from a recent conversation with our friends at SCORE about education finance in Tennessee — where the money comes from, spending trends over time, and what decisions policymakers will face going forward. The Sycamore Institute will dig deeper into state funding for K-12 education in Tennessee in the coming months.
SCORE: When it comes to education finance, we tend to focus on how policy decisions will affect students and educators today. Help us take a longer view with a brief look back at state spending on K-12 education.
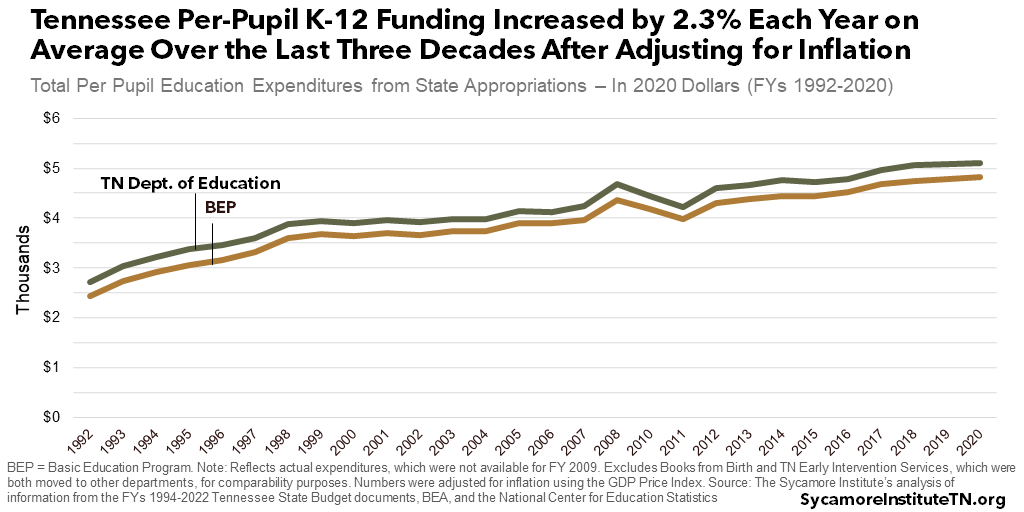
Mandy: Adjusted for inflation (the best way to make apples-to-apples comparisons over time), Tennessee’s K-12 education spending has more than doubled since our current funding formula took effect in 1992. From then to 2020, funding from state revenues grew 3 percent each year on average — or just over $100 million each year (Figure 1). Meanwhile, per-pupil state funding rose 2.3 percent on average — or $86 per student per year (Figure 2). [i]
Figure 1
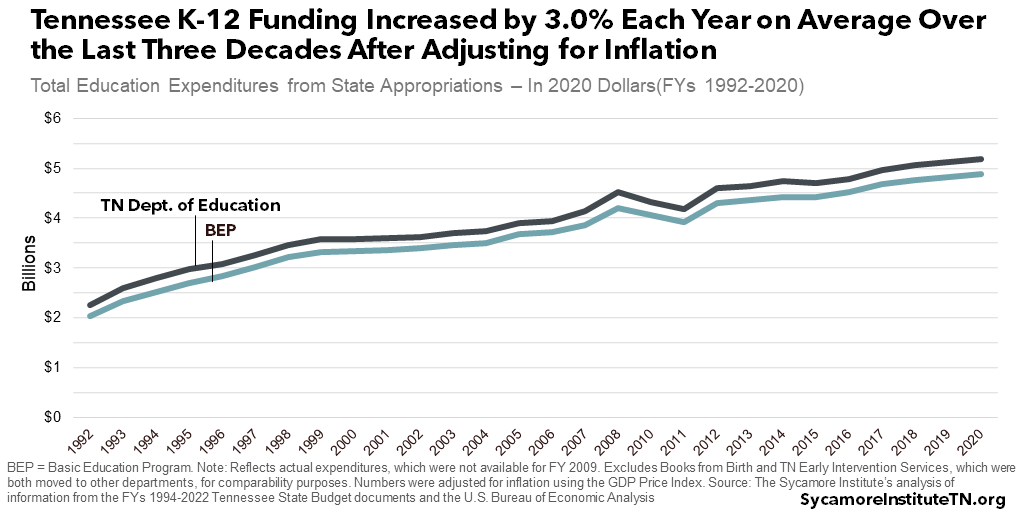
Figure 2
S: You used a per-pupil spending perspective in your analysis. Over the last two years, Tennessee has released per-pupil expenditures at the school level under the federal Every Student Succeeds Act. Why is this perspective important?
M: When you have more students, you generally need more money for teachers, facilities, textbooks, etc. Similar to accounting for inflation, looking at per-pupil spending helps us make meaningful comparisons over time as enrollment changes. It’s a good starting point for understanding how we fund education in Tennessee.
S: Where do most of the state education funds come from and go to? And how has that changed over time?
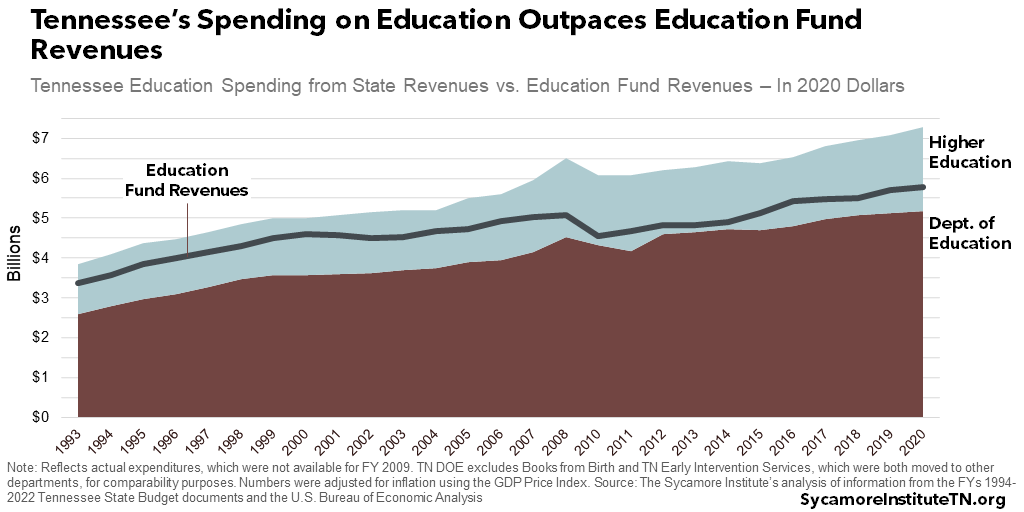
M: Sales tax is Tennessee’s largest K-12 funding source (Figure 3). In fact, the state’s sales tax is the largest revenue source for both the General Fund and a dedicated Education Fund (Figure 3) – both of which support K-12 and higher education. With few exceptions, state budget wonks in Tennessee typically use the term “General Fund” to mean the General and Education Funds together because Education Fund revenues alone don’t cover the state’s education investments (Figure 4). [i]
Local and federal dollars also help pay for education. In fiscal year 2019, for example, state revenues provided half the money for elementary and secondary education, 43 percent came from local revenues, and the rest from the federal government. [ii]
In fiscal year 2020, over 94 percent of the Tennessee Department of Education’s (TDOE) spending from state revenues went directly to school districts via the Basic Education Program (BEP). That share has grown from about 90 percent 30 years ago.
Figure 3
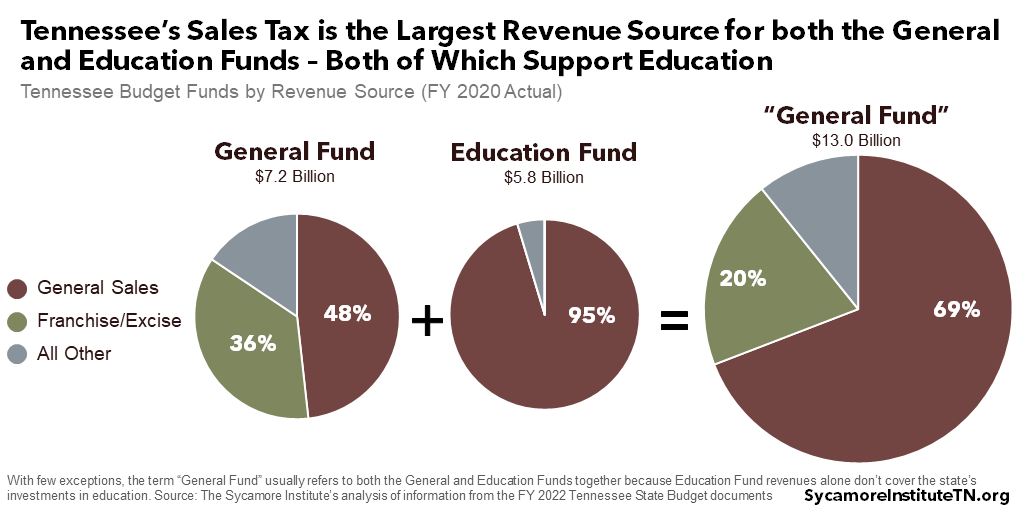
Figure 4
S: Where does K-12 stand in terms of share of state resources relative to the state’s other obligations?
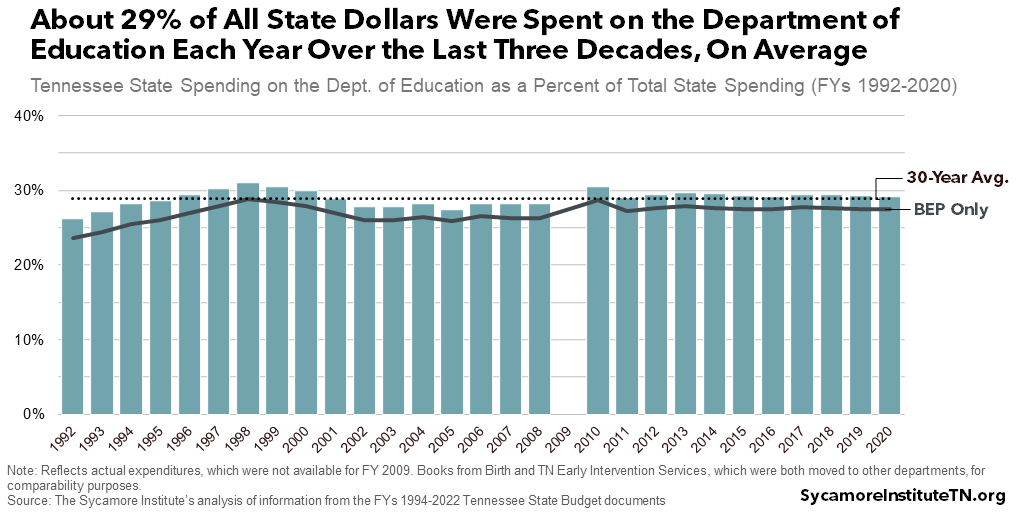
M: K-12 education is the single largest expense from state dollars in Tennessee’s budget (Figure 5). TDOE spending has consistently comprised between 28-30 percent of all state spending for the last decade (Figure 6). [i]
Figure 5
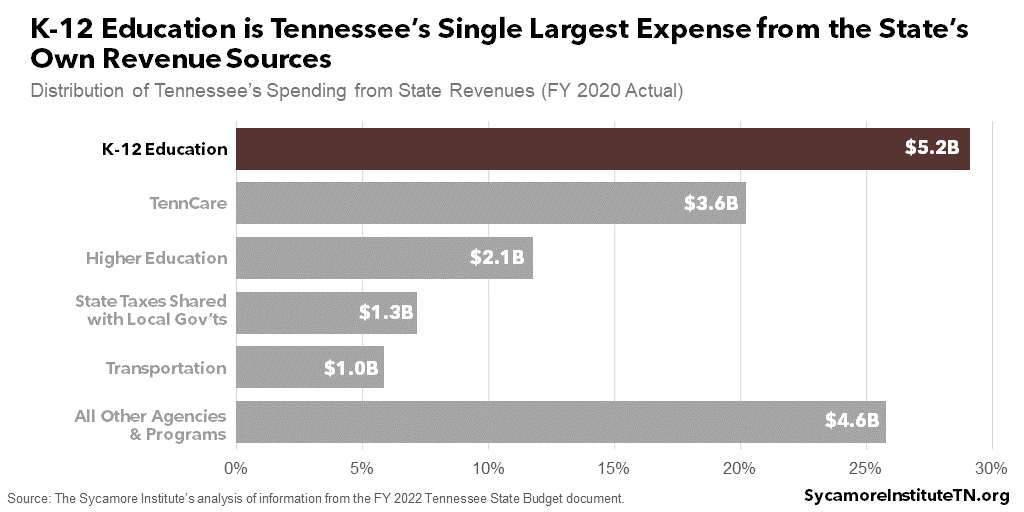
Figure 6
S: What other context is important for education stakeholders and leaders to consider as they make funding decisions looking forward?
M: These are very interesting times, both for the economy broadly and public finance specifically.
The next time state policymakers meet, they’ll have about $2.1 billion in one-time state funding available. When the COVID-19 pandemic hit, the economy took a nosedive and then swiftly rebounded with the help of an unprecedented amount of federal spending. This, combined with conservative budgeting, leaves the state with the largest surplus on record for fiscal year 2021.
Meanwhile, policymakers’ priorities may be shaped by the state’s uneven economic recovery. Even as consumer spending bounced back, some industries continue to have a hard time finding employees. Unemployment recently plateaued at about 1 percentage point higher than before the pandemic, when it was at historic lows. Some workers — particularly in low-wage, “customer-facing” industries — may be reevaluating what they want from a job. Others just may not have the skills necessary for the jobs that are available. Meanwhile, another sustained surge in COVID-19 cases could stall or even reverse many of the state’s economic gains. We’re certainly in a time of change.
A version of this post first appeared at tnscore.org.
Footnotes
Click to Open/Close
[i] The Sycamore Institute’s analysis of:
State of Tennessee, FY 1994-FY 2022 Tennessee State Budget documents, 1993-2021. Retrieved from https://www.tn.gov/finance/fa/fa-budget-information/fa-budget-archive.html and the Tennessee State Library and Archives.
The Bureau of Economic Analysis, GDP Price Index for 1992-2020, 1993-2021. Retrieved from https://apps.bea.gov/iTable/iTable.cfm?reqid=19&step=3&isuri=1&select_all_years=0&nipa_table_list=18&series=a&first_year=1992&last_year=2021&scale=-99&categories=survey&thetable=. For more information on the use of different inflationary adjustors, see https://www.bea.gov/resources/learning-center/what-to-know-prices-inflation.
U.S. Department of Education, National Center for Education Statistics, Common Core of Data (CCD), “State Nonfiscal Public Elementary/Secondary Education Survey”, 1987-88 v.1c, 1989-90 v.1c, 1990-91 v.1c, 1991-92 v.1c, 1992-93 v.1c, 1993-94 v.1b, 1994-95 v.1b, 1995-96 v.1b, 1996-97 v.1c, 1997-98 v.1c, 1998-99 v.1b, 1999-00 v.1b, 2000-01 v.1c, 2001-02 v.1c, 2002-03 v.1b, 2003-04 v.1b, 2004-05 v.1f, 2005-06 v.1b, 2006-07 v.1c, 2007-08 v.1b, 2008-09 v.1c, 2009-10 v.1b, 2010-11 v.1a, 2011-12 v.1a, 2012-13 v.1a, 2013-14 v.1a, 2016-17 v.1a, 2017-18 v.1a, 2018-19 v.1a, 2019-20 v.1a; “State Nonfiscal Public Elementary/Secondary Education Survey Membership Data”, 2014-15 v.1a, 2015-16 v.1a. 1990-2014 is the total number of students in a state who are enrolled in public school. These data are taken from the CCD State Nonfiscal survey.2015-2020 is the total number of students (ungraded and prekindergarten through 13th grade) as reported by the state. This count excludes adult education students, which is the number of students enrolled in adult education courses provided by the state’s public elementary/secondary school system. Retrieved from https://nces.ed.gov/ccd/elsi/tableGenerator.aspx.
[ii] National Center for Education Statistics. “Revenues and Expenditures for Public Elementary and Secondary Education: FY 19,” June 2021. https://nces.ed.gov/pubs2021/2021302.pdf.