
Key Takeaways
- Tennessee’s 95 counties continue to experience large differences in income level, poverty rates, health insurance status, and educational attainment.
- On average, urban, Middle Tennessee counties have the highest education and income and the lowest poverty and uninsured rates.
The latest federal estimates for all 95 of Tennessee’s counties continue to show large differences between counties in income, poverty, health insurance coverage, and education levels. Overall, there are very large divides between the counties doing the best on these metrics and those doing the worst. On average, Middle Tennessee counties had the lowest poverty rates, highest median household income, and highest percentage of residents with postsecondary degrees.
Note: The numbers analyzed here are based on five years of data (2017-2021) rather than single-year estimates. (1) The Census Bureau uses these to produce more reliable estimates for rural, less populated counties. Census recommends that five-year estimates not be compared to previous five-year estimates when they include overlapping years. See the final section of this policy brief for more details.
We define urban and rural counties using the following criteria from the Census Bureau (Figure 1)[1]:
- Counties with a population less than 50% rural are considered urban.
- Counties with a population that is 50-99.99% rural are considered mostly rural.
- Counties with a population that is 100% rural are considered rural. (2)
Figure 1
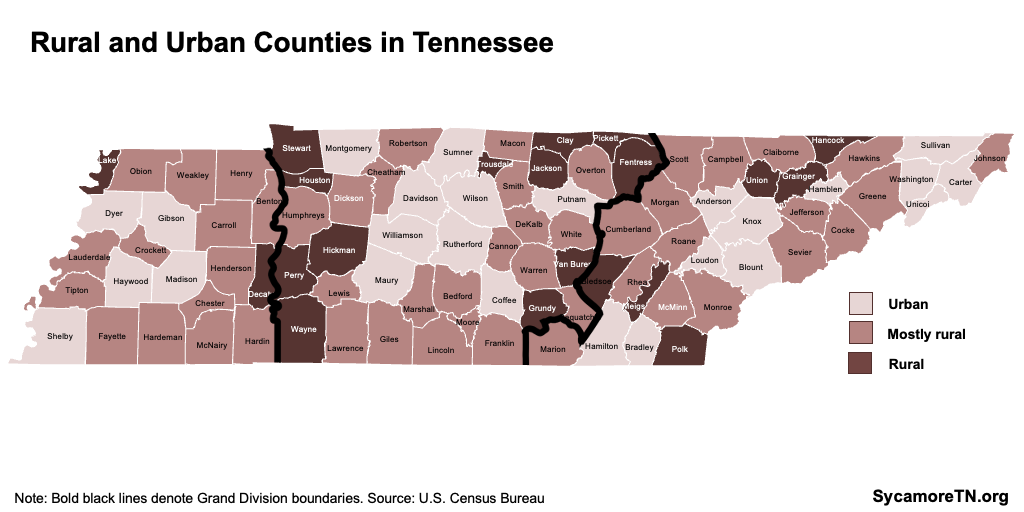
Figure 2
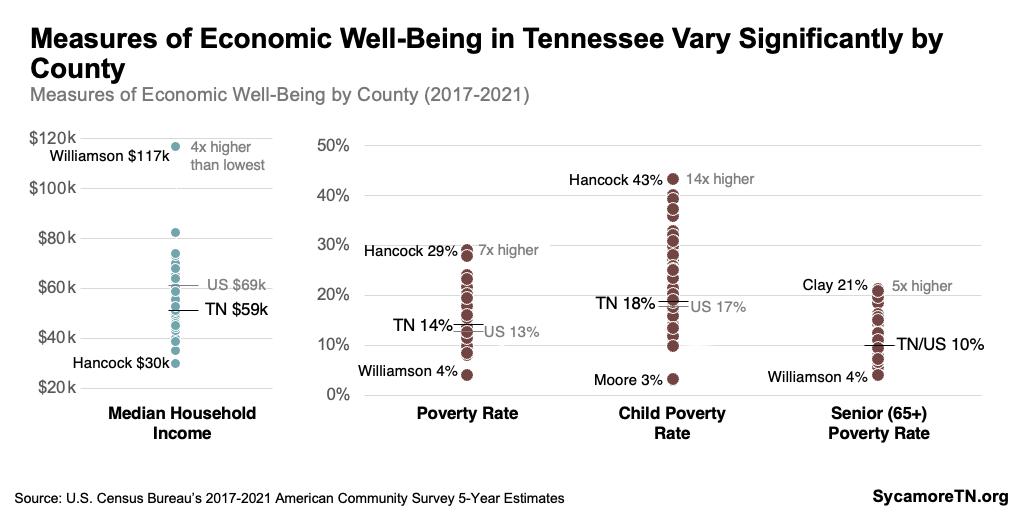
Income and Poverty — Key Findings
- Wide Variation — Measures of economic well-being in Tennessee vary significantly across counties (Figure 2). For example, the highest county child poverty rate was 14 times higher than the lowest (43% in Hancock vs. 3% in Moore).
- Rural vs. Urban Counties — As a group, urban counties averaged the highest incomes and lowest poverty rates in the state, while the state’s rural counties had the lowest incomes and most poverty (Figure 3).
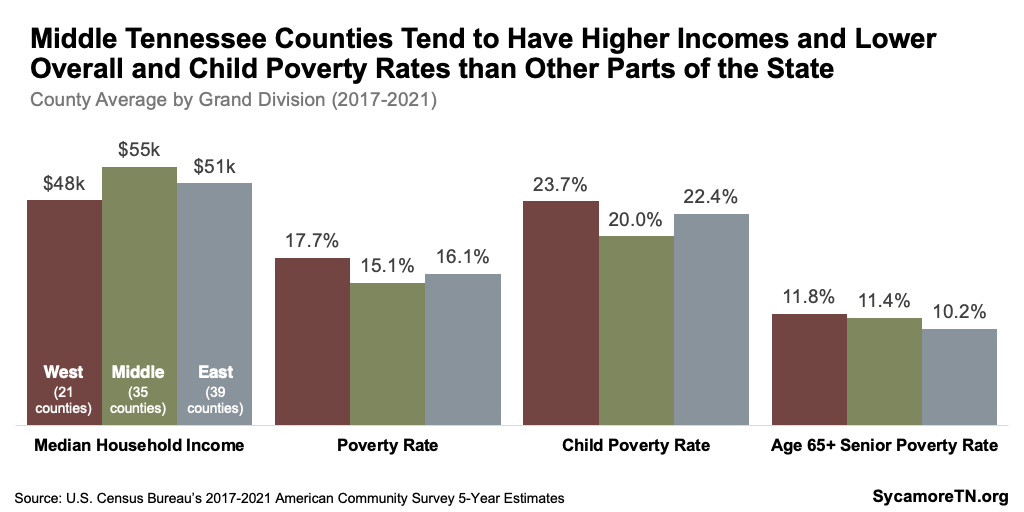
- Grand Division — On average, the 21 counties in West Tennessee had the highest poverty rates (17.7%) and lowest incomes ($48,000) (Figure 4) — compared to 16.1% and $51,000, respectively, in the 39 East Tennessee counties and 15.1% and $55,000 in the 35 Middle Tennessee counties.
See Appendix Figures A1-A4 for mapped data by county, Figure A9 for a map of counties by Grand Division, and Table A1 for data values.
Figure 3
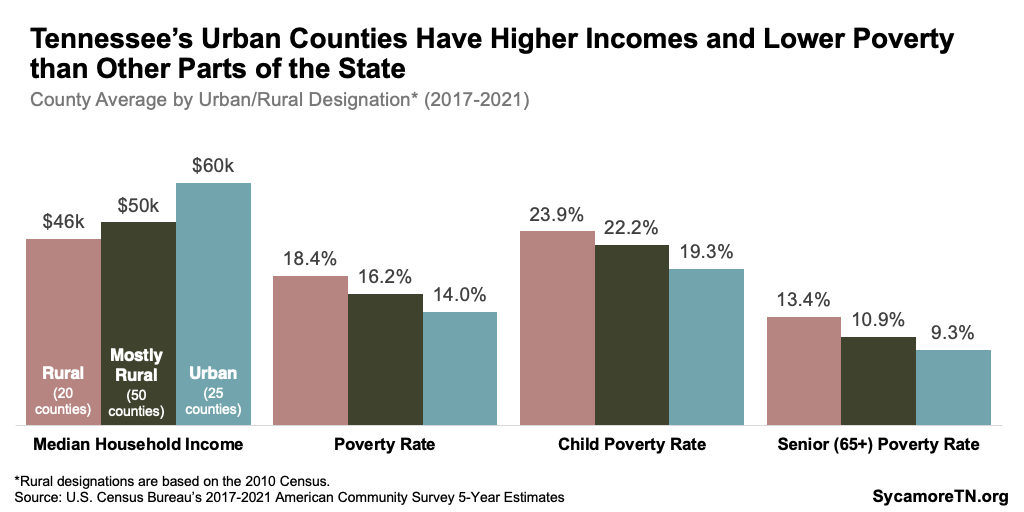
Figure 4
Levels of Education — Key Findings
- Wide Variation — Levels of education varied significantly across Tennessee’s 95 counties (Figure 5). For example, the highest rate of adults with at least a bachelor’s degree was seven times higher than the lowest (62% in Williamson vs. 9% in Marion).
- Rural vs. Urban — As a group, urban counties had the highest rate of adult residents with post-secondary degrees — followed by mostly rural and then completely rural parts of the state (Figure 6).
- Grand Division — On average, Middle and East Tennessee counties had the highest rates of educational attainment, and those in West Tennessee had the lowest (Figure 7).
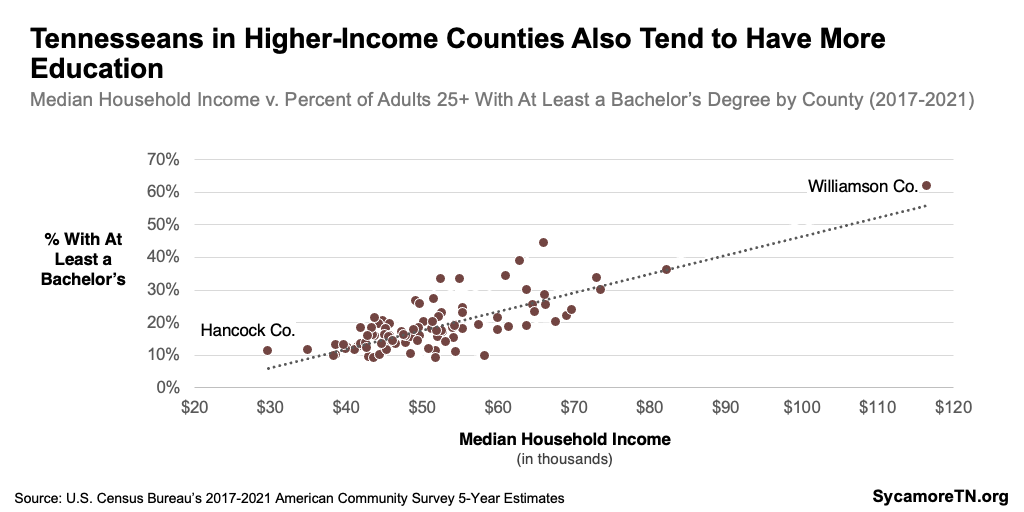
- Education and Income — The well-established relationship between education and income is evident across Tennessee’s 95 counties. The counties with the highest median household incomes also have the highest levels of education, while those with the lowest incomes tend to have fewer adults with post-secondary degrees (Figure 8).
See Appendix Figures A5-A6 for mapped data by county, Figure A9 for a map of counties by Grand Division, and Table A1 for data values.
Figure 5
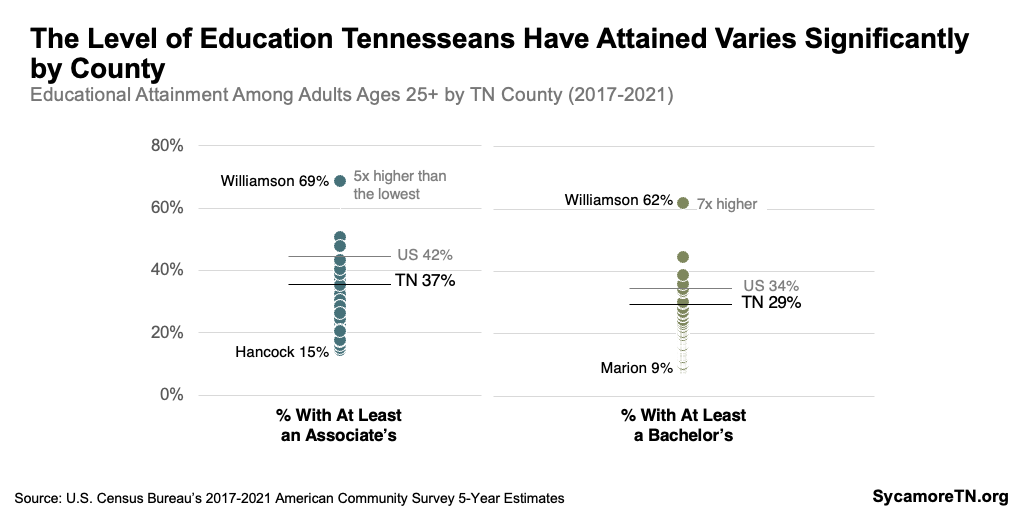
Figure 6
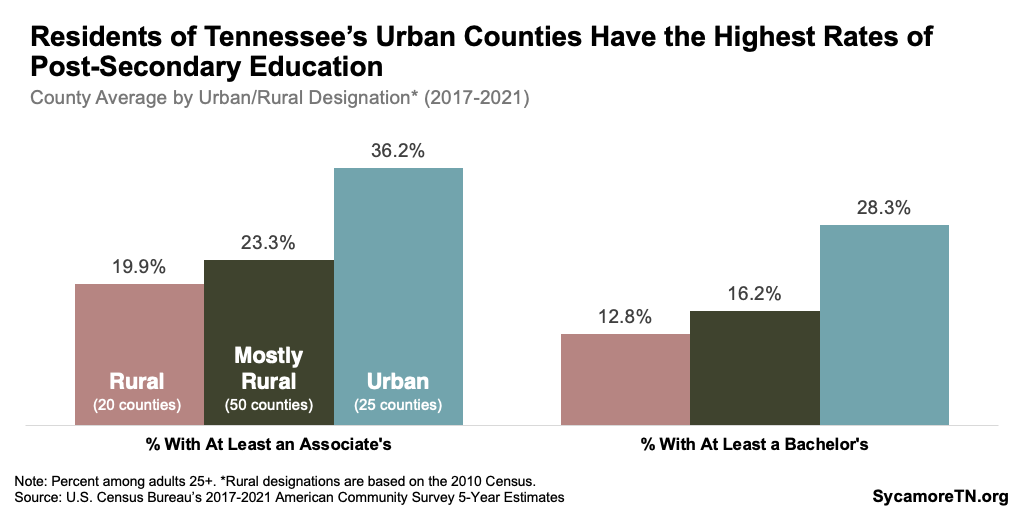
Figure 7
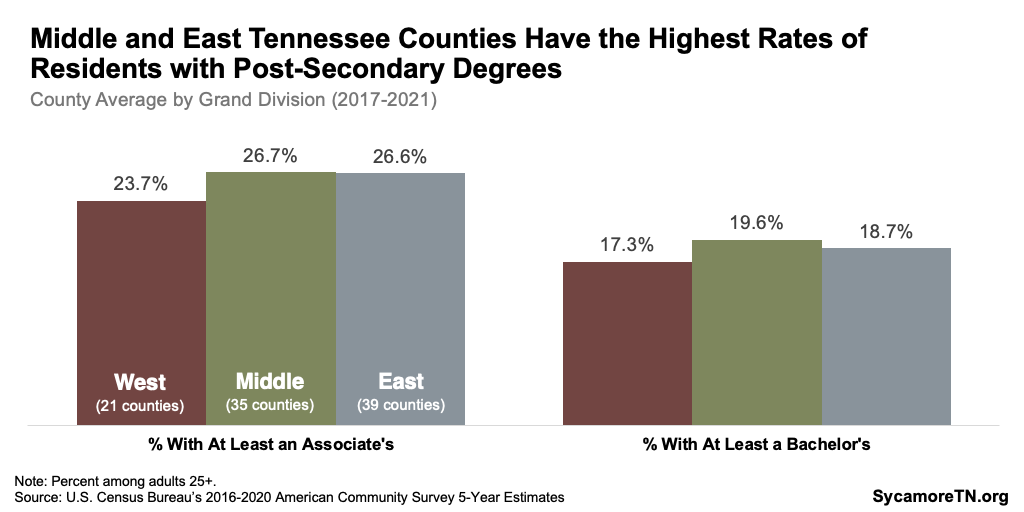
Figure 8
Uninsured Rates — Key Findings
- Wide Variation — Uninsured rates among non-elderly adults (19-64) and children both vary widely by county. For example, 17% of children in Van Buren County were uninsured — 42 times the rate in Trousdale, where less than 1% were uninsured (Figure 9).
- Rural vs. Urban — As a group, urban counties had the lowest uninsured rates for non-elderly adults — followed by mostly rural and then completely rural areas (Figure 10). The uninsured rate among children, however, was very similar across all three county groups.
- Grand Division — On average, Tennessee’s uninsured rates vary little by Grand Division (Figure 11).
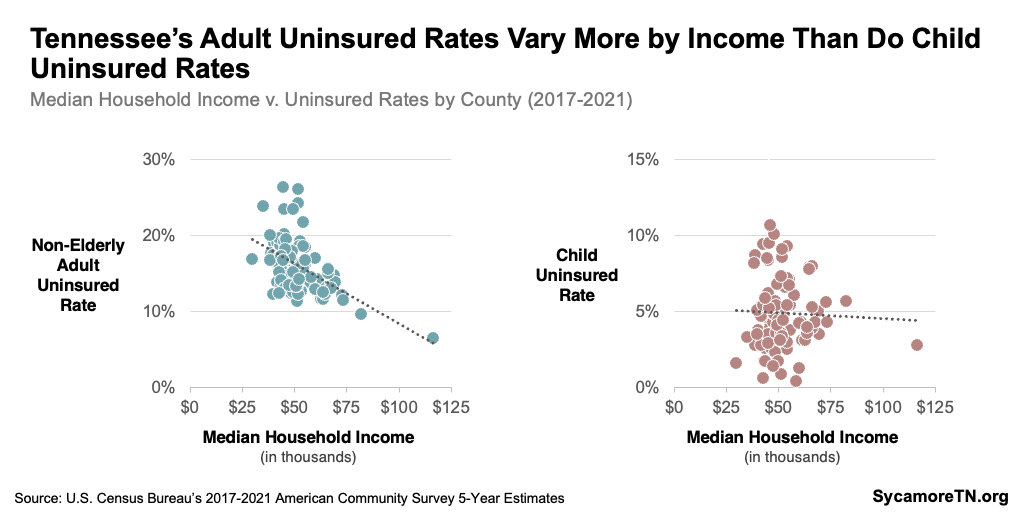
- Health Insurance and Income — Income affects adults’ access to health insurance more than kids’ largely due to eligibility standards for public programs. Non-elderly adults’ access to coverage often depends on employer-sponsored plans, eligibility for federal subsidies in the individual market, or specific categorical qualifications (e.g. health status, pregnancy) for TennCare, the state’s Medicaid program. As a result, lower-income individuals and counties have higher adult uninsured rates (Figure 12). Meanwhile, there is little variation by income in the uninsured rate for children due to broader eligibility for TennCare and similar programs.
See Appendix Figures A7-A8 for mapped data by county, Figure A9 for a map of counties by Grand Division, and Table A1 for data values.
Figure 9
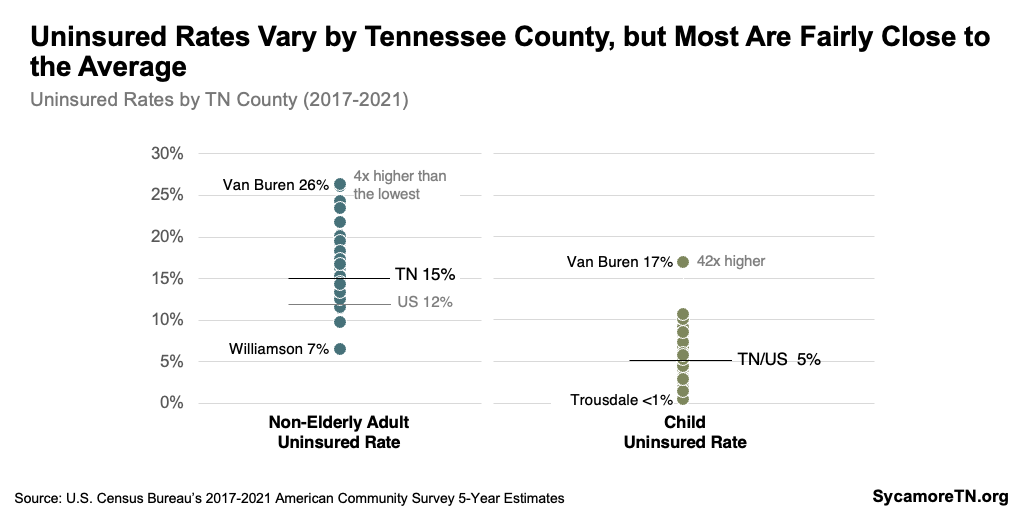
Figure 10
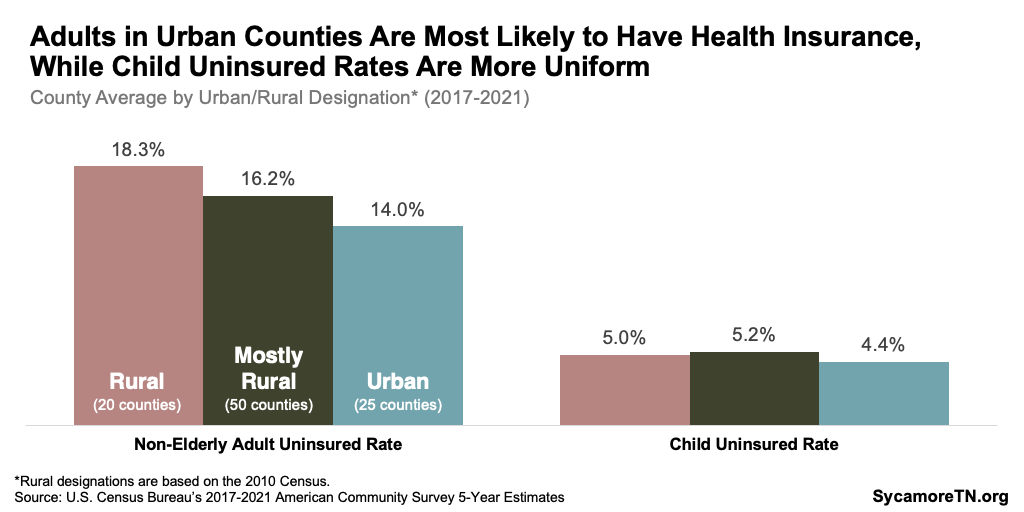
Figure 11
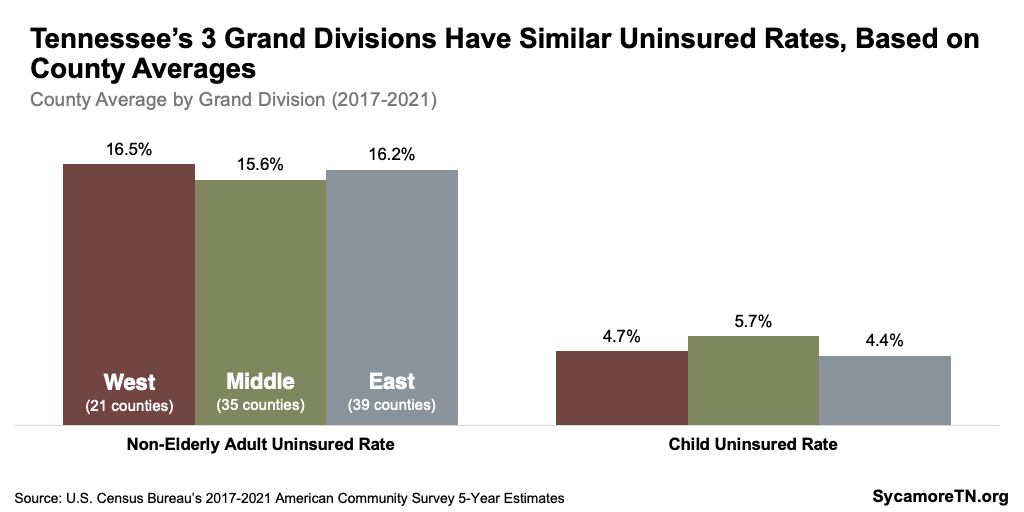
Figure 12
About the Data
The five-year estimates shown here are based on data from the U.S. Census Bureau’s American Community Survey collected from 2017-2021. (1) They are the most current data available, as there is about a one-year lag between when data collection stops and when they are published by the Census Bureau. While many metrics are often discussed in the context of a single year, the Census Bureau does not publish one-year estimates for areas with small populations, which excludes many Tennessee counties. Instead, they pool data across several years to minimize sampling error and produce more accurate measures. These multi-year estimates are more reliable than one-year estimates for areas with smaller populations and provide comparable data for all counties in Tennessee. Even with multiple years of data, however, the estimates for less populous counties generally have wider margins of error.
[1] The designations are based on the 2010 decennial census. The U.S. Census Bureau has not yet released county-level designations based on the 2020 decennial census.
References
Click to Open/Close
References
- U.S. Census Bureau. American Community Survey 5-Year Data (2017-2021). [Online] December 2022. [Cited: December 12, 2022.] Data retrieved from http://data.census.gov.
- Ratcliffe, Michael, et al. Defining Rural at the U.S. Census Bureau: American Community Survey and Geography Brief. s.l. : United States Census Bureau: U.S. Department of Commerce, Economics and Statistics Administration, 2016. ACSGEO-1.


