The U.S. Census Bureau released new data in September on income, poverty, education, and health insurance coverage in 2019. These metrics paint a picture of the social and economic circumstances across America in the final year of a historically long period of economic growth. For years to come, they will serve as a baseline to measure many of the coronavirus recession’s short- and long-term effects.
Here’s what stands out from the 2019 estimates of health insurance coverage in Tennessee.
Key Takeaways
- Except for some shifts from TennCare to job-based plans and an uptick in the uninsured rate for Hispanic residents, health coverage in the state did not change much from 2018 to 2019.
- Men, Hispanics, younger adults, the unemployed, and people with less education and income are the most likely to be uninsured in Tennessee.
In 2019, 90% of Tennesseans had health insurance — more than half of them through an employer (Figure 1). (1) Compared to 2018, fewer Tennesseans were covered by TennCare, the state’s Medicaid program, and more were covered by employer-sponsored insurance (Figure 2). Other sources of coverage remained relatively stable. Different age groups also relied on each source of coverage to varying degrees (Figure 3). For historical trends going back to 2010, see A Deep Dive into Health Insurance Coverage in Tennessee.
Figure 1
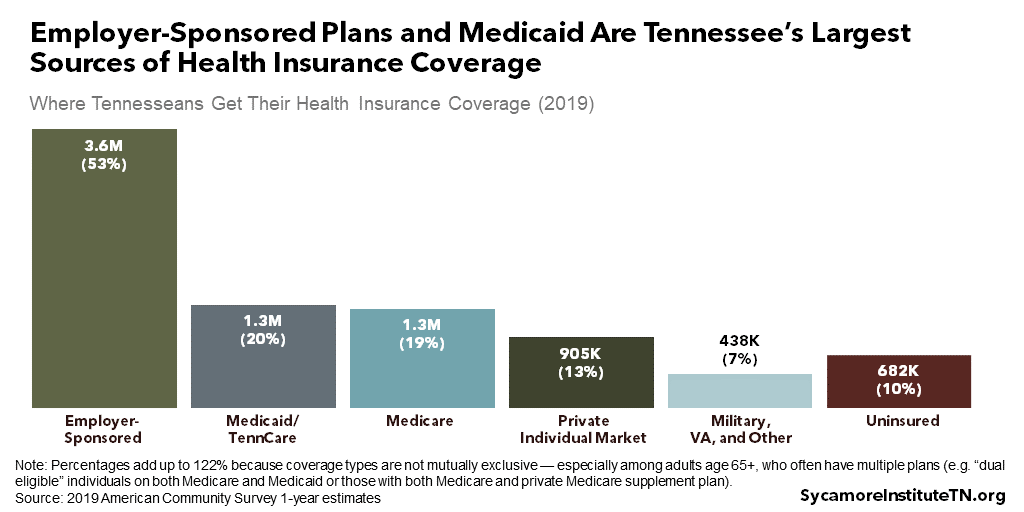
Figure 2

Figure 3

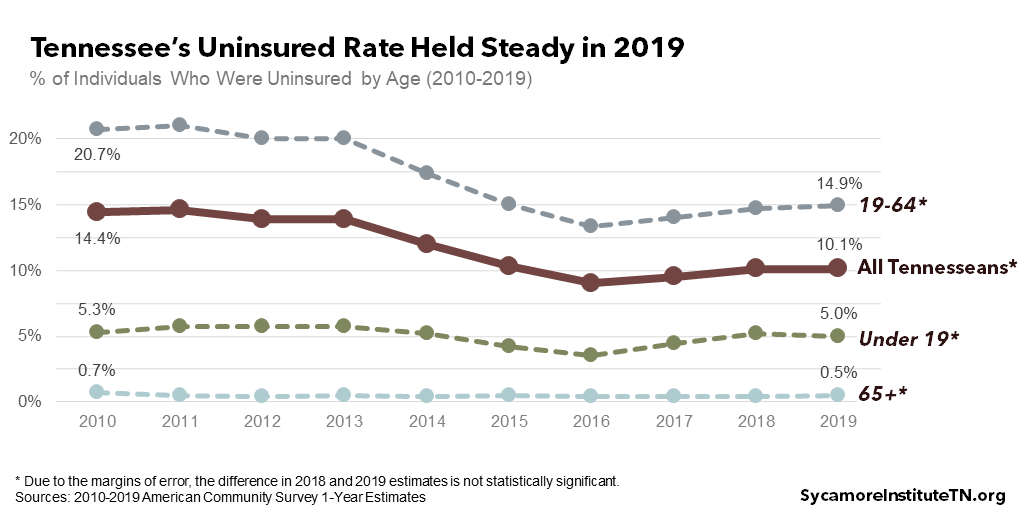
Tennessee’s uninsured rate held steady at 10.1% last year (Figure 3). (1) Around 682,000 Tennesseans were uninsured in 2019. This includes about 230,000 people who might become Medicaid-eligible if the state expands the program (ages 19–64 with household incomes under 138% of poverty) — although some may be ineligible due to their immigration status.† Small changes from the 2018 uninsured rate for different age groups (Figure 4) were all within margins of error and not considered statistically significant.*
Figure 4
Demographic Variation
Some Tennesseans are more likely than others to be uninsured — including men, Hispanics, younger adults, the unemployed, and those with less education and income (Figures 5 and 6). (1) The highest uninsured rates in 2019 occurred among:
- Unemployed, working-age adults in the labor force — 40% vs. 15% for all working-age adults.
- Hispanic Tennesseans — 34% vs. 11% for black and 9% for white residents
- Tennesseans with less than a high school diploma — 24% vs. 11% for all adults age 25+
- People ages 26–34 — 18% vs. 10% for the population as a whole.
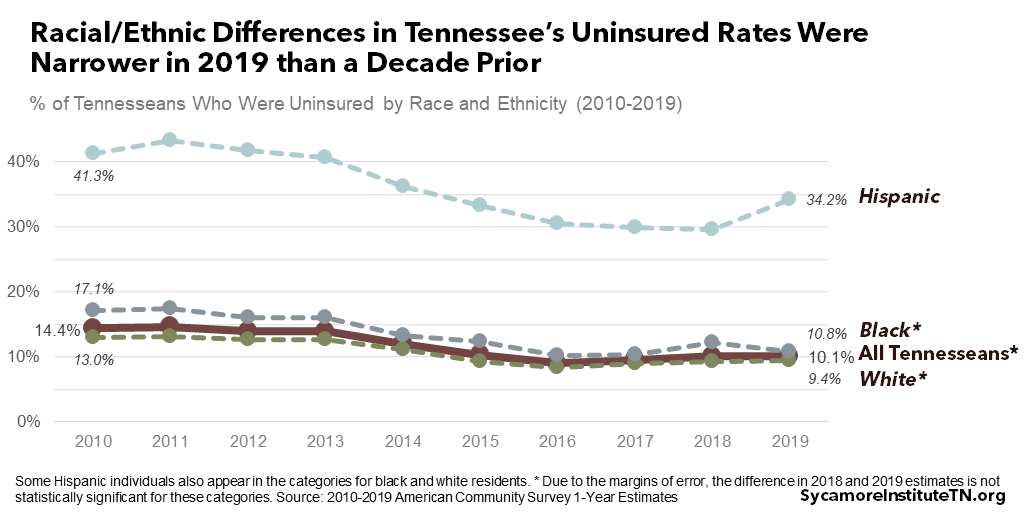
Differences in the uninsured rate by race and ethnicity narrowed over the last decade (Figure 7). (1) In 2019, the uninsured rate was 1.4 percentage point higher among black Tennesseans than whites — compared to 4.1 points in 2010. After an uptick last year, the Hispanic uninsured rate was 24.8 points higher than that of white residents – versus 28.3 in 2010.
Figure 5
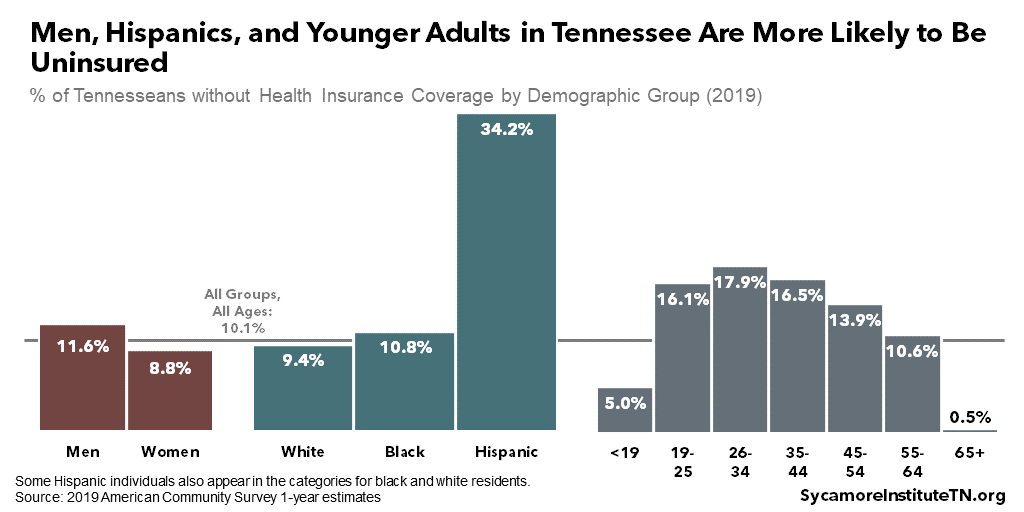
Figure 6
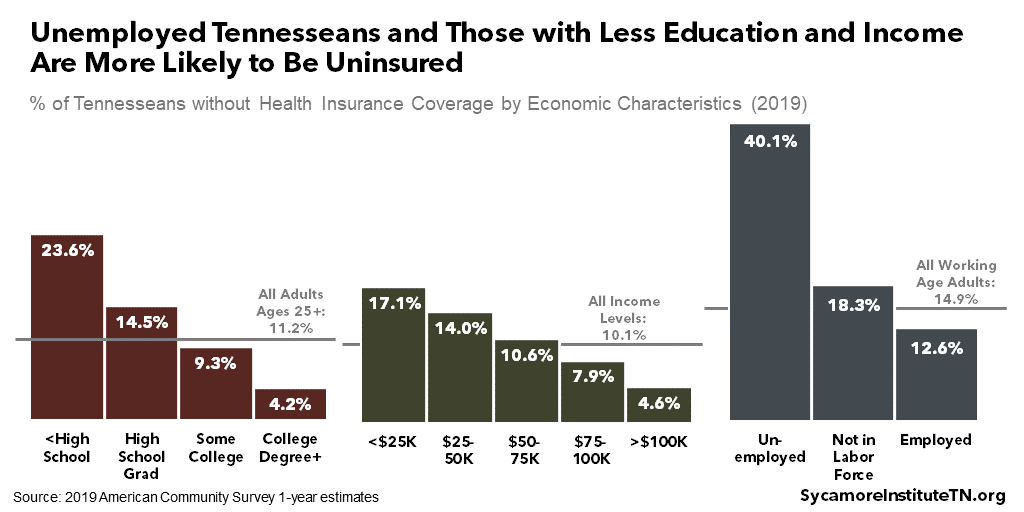
Figure 7
Geographic Variation
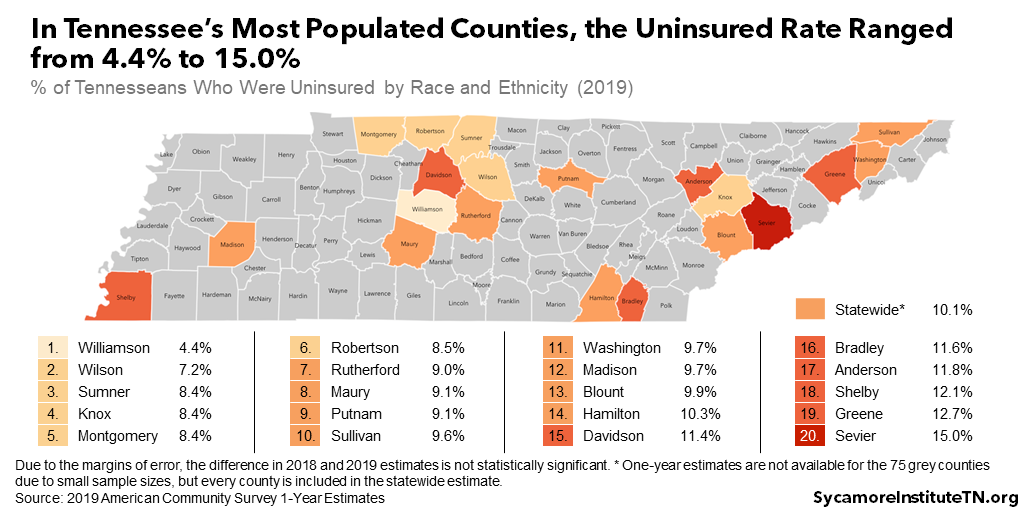
Uninsured rates in Tennessee also vary by geography. (1) The Census Bureau’s September data release includes 2019 estimates for counties with populations above 65,000. Among the 20 Tennessee counties with available data, the uninsured rate ranged from 4.4% in Williamson County to 15.0% in Sevier County (Figure 8). Due to margins of error, the difference in 2018 and 2019 values was not statistically significant for any of these counties. See Table A1 in the Appendix for additional county data and this link for a detailed breakdown for Shelby County.
Figure 8
References
Click to Open/Close
- U.S. Census Bureau. 2010-2019 American Community Survey 1-Year Estimates. [Online] September 17, 2020. Available from http://data.census.gov.
† People living in the U.S. without legal authorization (a.k.a. illegal/undocumented immigrants) are not eligible for Medicaid. Methods for estimating their share of the uninsured population vary, but one study estimated that as many as 29,000 uninsured adults in Tennessee under 138% of FPL would not qualify for Medicaid due to their immigration status.
* Due to the margins of error, the difference in some 2018 and 2019 estimates is not statistically significant. The Census Bureau’s American Community Survey generates estimates based on a sample of the total population. The margin of error measures the likely range of the true value if every person were surveyed. When the error margins for two values overlap, the difference may simply be due to sampling or estimation issues. To learn more about the importance of samples, read our tips for interpreting statistics.