The U.S. Census Bureau released new data this month on health insurance coverage across the U.S. in 2017. Here are our top 3 takeaways for Tennessee. See the Metro Area Charts section at the end for Tennessee metro area data.
Key Takeaways
- In 2017, 629,142 Tennesseans were uninsured, about 37,000 more individuals than in 2016.
- The uninsured rate in Tennessee increased from 9.0% in 2016 to 9.5% in 2017.
- The largest increased in the uninsured rate occurred among 18-24 year olds, Tennesseans with incomes between $50,000 and $75,000, and individuals with less than a high school diploma.
1. Tennessee’s uninsured rate increased in 2017.
- The proportion of Tennesseans who were uninsured increased from 9.0% in 2016 to 9.5% in 2017 (Figure 1). The number of uninsured Tennesseans increased by about 37,000 — from 592,310 in 2016 to 629,142 in 2017
- Nationally, the uninsured rate increased from 8.6% to 8.7%.
Figure 1

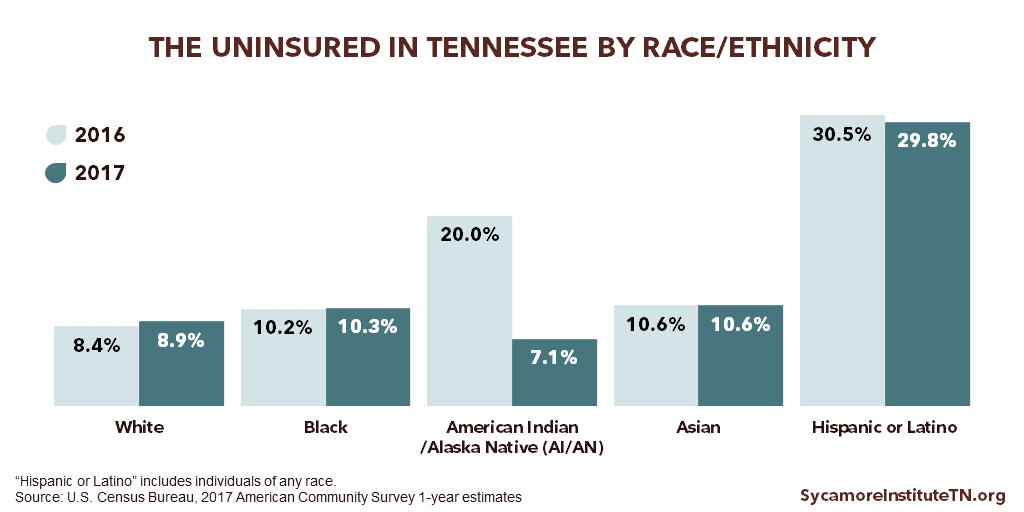
2. Uninsured rates varied significantly by age and race/ethnicity.
- Working-age adults 19-64 had higher uninsured rates (14.0%) than children and older adults. (Figure 2)
- The uninsured rate increased for all age groups except 35-44 year olds.
- The largest increase was among 18-24 year olds from 12.4% in 2016 to 15.0% in 2017.
- Uninsured rates were highest among Hispanic or Latino Tennesseans (29.8%) and lowest among American Indian/Alaska Natives (AI/AN) (7.1%).(Figure 3)
- While uninsured rates increased for most, decreases in the uninsured rate were seen among 2 racial/ethnic groups — AI/AN and Hispanic or Latino. (Figure 3)
Figure 2
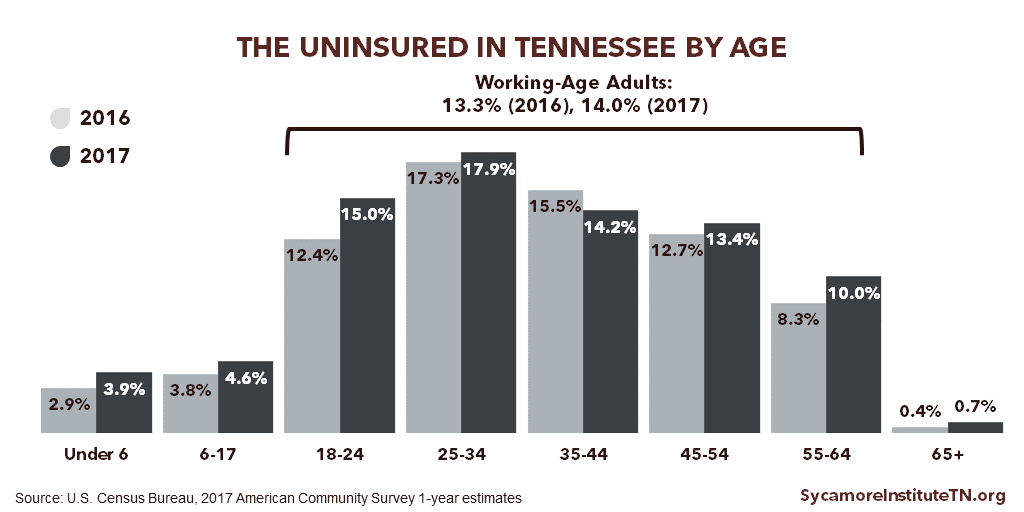
Figure 3
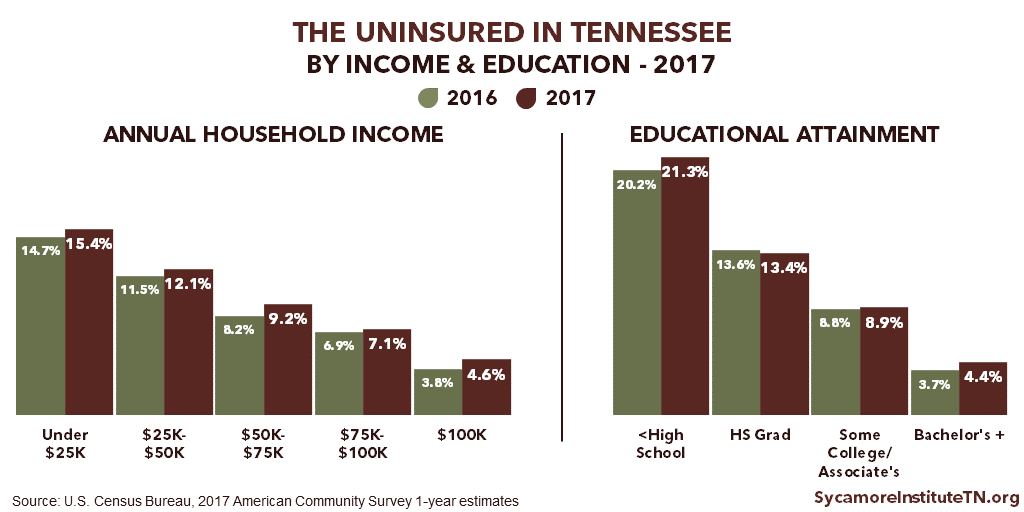
3. Uninsured rates were higher for Tennesseans with lower incomes and less education.
- Uninsured rates were higher for Tennesseans with lower incomes. 4% of Tennesseans living in households with incomes below $25,000 were uninsured compared to 4.6% living in households with incomes above $100,000 (Figure 4).
- 17.0% of Tennesseans with incomes below 138% of the poverty threshold were uninsured compared.
- Uninsured rates were higher for Tennesseans with lower levels of education. 21.3% of Tennesseans with less than a high school education were uninsured compared to 4.4% with a bachelor’s degree or higher (Figure 4).
- Uninsured rates increased across all income groups and most education levels. (Figure 4)
- The uninsured rate increased the most for Tennesseans with incomes between $50,000 and $75,000 — from 8.2% in 2016 to 9.2% in 2017 — and for individuals with less than a high school diploma — from 20.2% in 2016 to 21.3% in 2017.
Figure 4
You can read the Census Bureau’s full report at Health Insurance Coverage in the United States: 2017
Metro Area Charts
About Metro Areas
The U.S. Census Bureau’s September data release also includes 2017 estimates for 5 metropolitan statistical areas (MSAs) that include Tennessee cities. MSAs include population centers and their surrounding areas — including areas that can cross state lines. (2) Later in the year, the Census will release county-level estimates using 5 years of data (2013-2017).
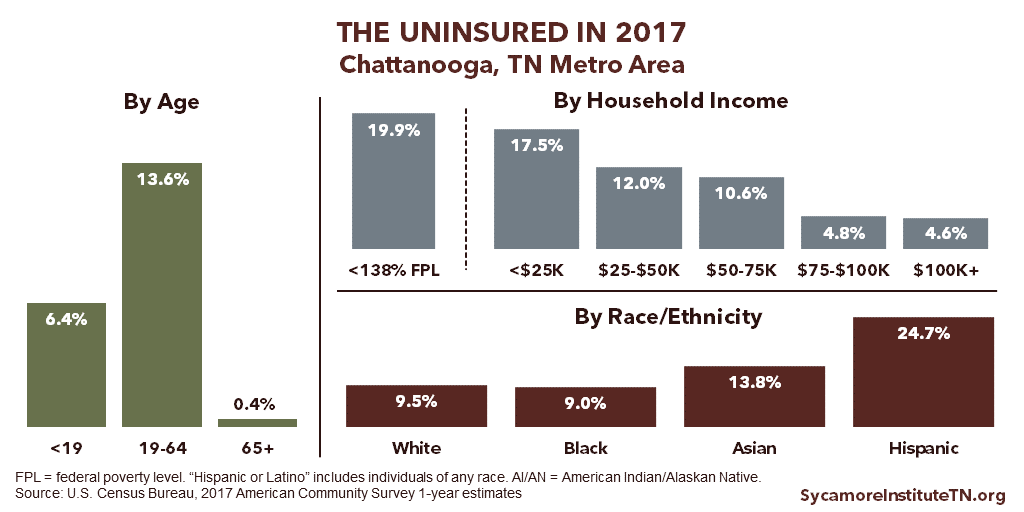
Chattanooga, TN Metro Area Uninsured Rates
Click to Open/Close
The Chattanooga, TN metropolitan statistical area (MSA) includes Chattanooga and its surrounding areas — including areas in Georgia. A map of Tennessee’s MSAs can be viewed here.
Figure 5
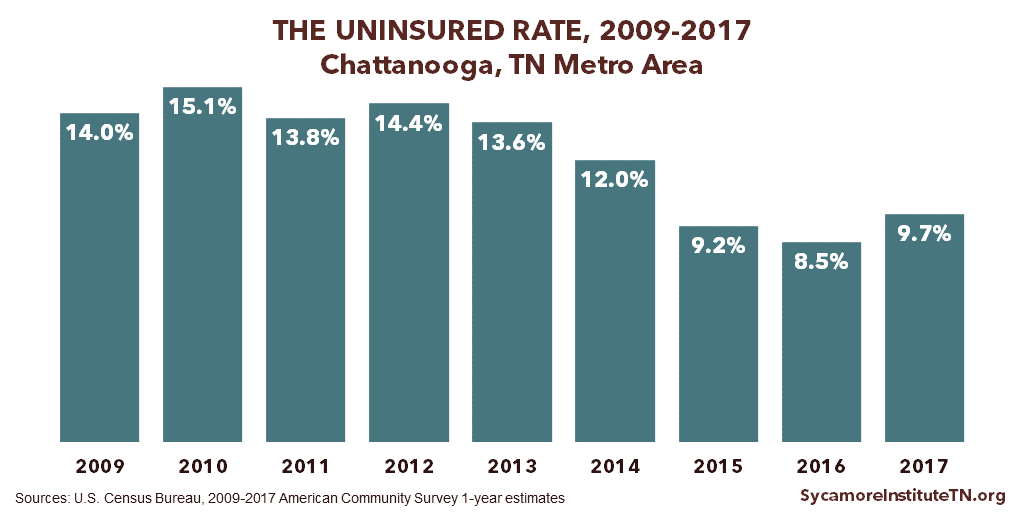
Figure 6
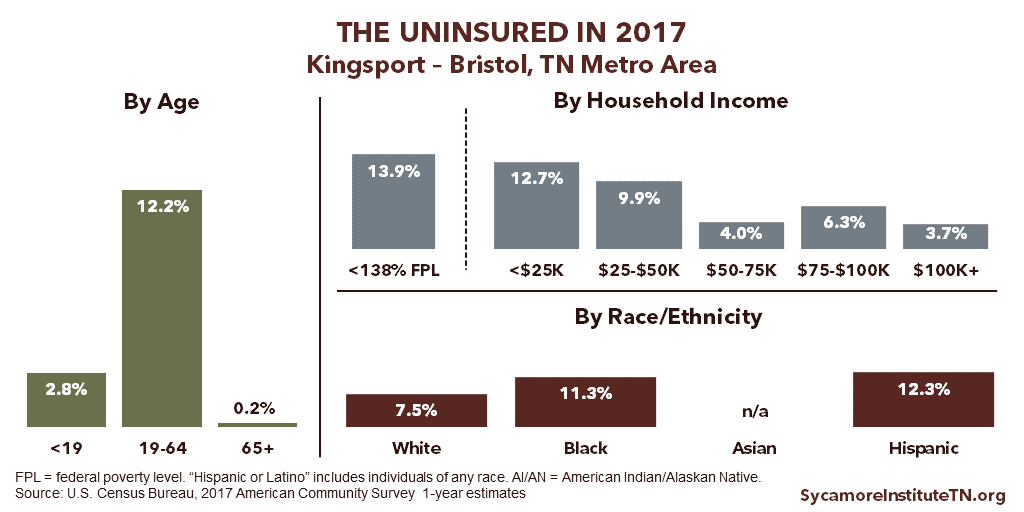
Kingsport – Bristol, TN Metro Area Uninsured Rates
Click to Open/Close
The Kingsport-Bristol, TN metropolitan statistical area (MSA) includes Kingsport, TN, Bristol, TN, Bristol, VA and their surrounding areas — including areas in Virginia. A map of Tennessee’s MSAs can be viewed here.
Figure 7
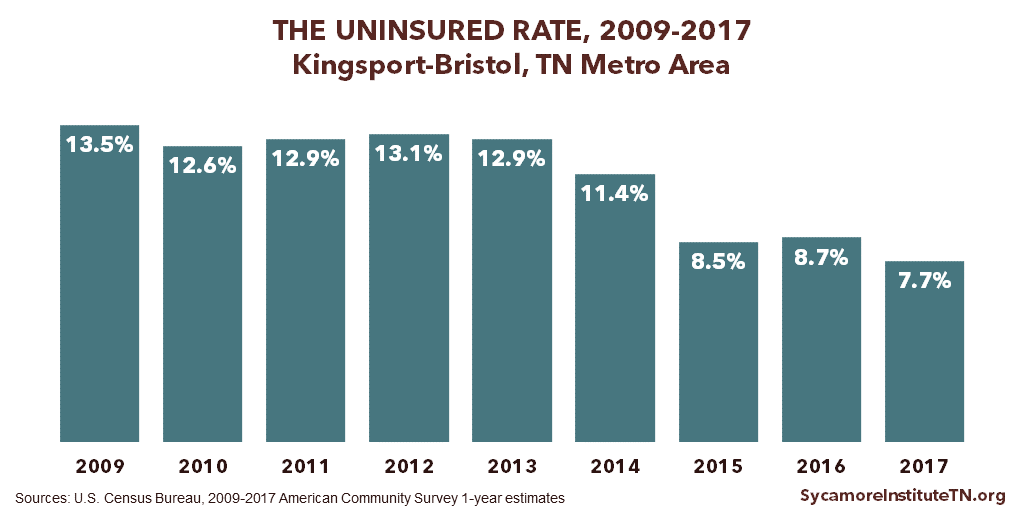
Figure 8
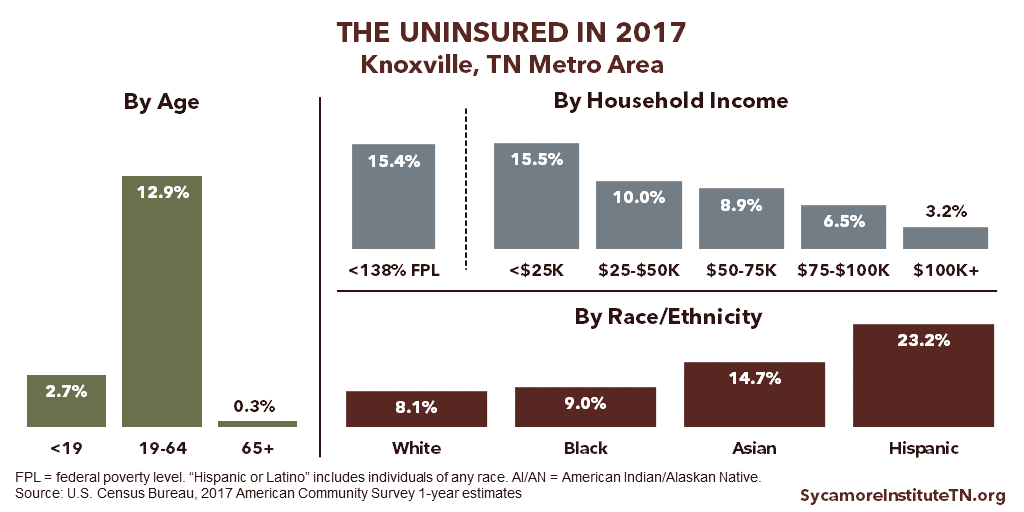
Knoxville, TN Metro Area Uninsured Rates
Click to Open/Close
The Knoxville, TN metropolitan statistical area (MSA) includes Knoxville and its surrounding areas. A map of Tennessee’s MSAs can be viewed here.
Figure 9
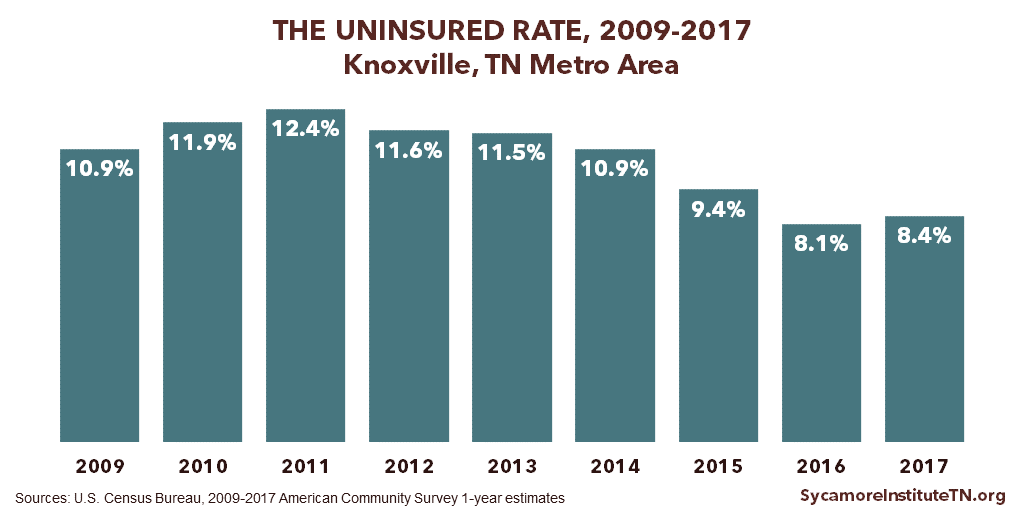
Figure 10
Memphis, TN Metro Area Uninsured Rates
Click to Open/Close
The Memphis, TN metropolitan statistical area (MSA) includes Memphis and its surrounding areas — including areas in both Mississippi and Arkansas. A map of Tennessee’s MSAs can be viewed here.
Figure 11

Figure 12

Nashville – Murfreesboro – Franklin, TN Metro Area Uninsured Rates
Click to Open/Close
The Nashville-Murfreesboro-Franklin, TN metropolitan statistical area (MSA) includes Nashville, TN, Murfreesboro, TN, and Franklin, TN and their surrounding areas. A map of Tennessee’s MSAs can be viewed here.
Figure 13
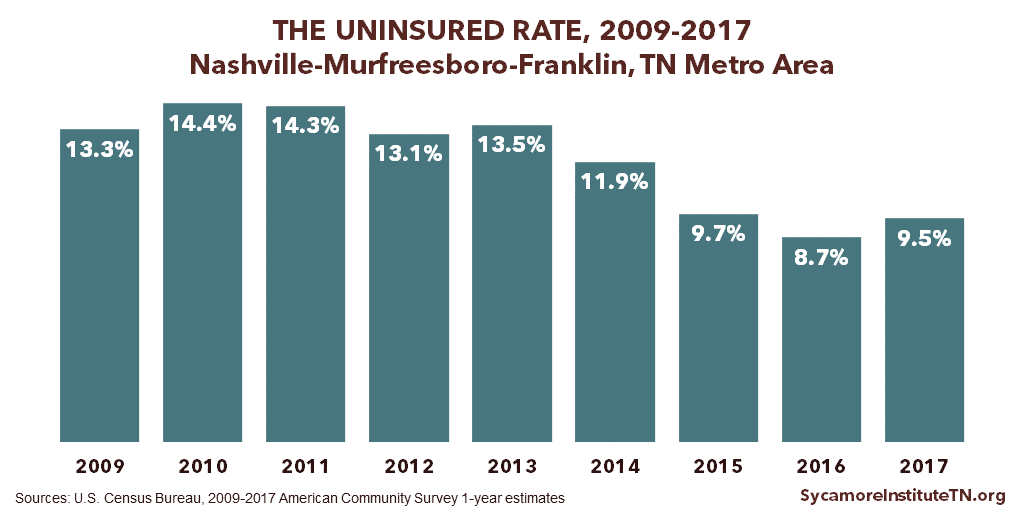
Figure 14

Download the PDF file for a full data table.
Related Work by The Sycamore Institute
Health Insurance Coverage in Tennessee in 2016
(October 5, 2017) Analyzes 2016 data on the rate of the uninsured and where insured Tennessean’s get health coverage.
How Uninsured Rates in Tennessee Counties Vary by Employment and Income
(January 30, 2018) Provides 2016 county-level data on uninsured rates by employment and income.
Click here for all Affordable Care Act (ACA)-related posts by The Sycamore Institute.
References
Click to Open/Close
- U.S. Census Bureau. American Community Survey 1-year estimates. Table S2701. [Online] 2009-2017. [Accessed on September 13, 2018.] Accessed via https://factfinder.census.gov/faces/nav/jsf/pages/index.xhtml.
- —. Geographic Terms and Concepts – Core Based Statistical Areas and Related Statistical Areas. [Online] https://www.census.gov/geographies/reference-maps/2017/geo/cbsa.html.