Some Tennesseans are more likely to have health insurance than others. Age, income, education, and race/ethnicity are a just few of the factors that influence rates of health insurance coverage. The maps and tables below show how uninsured rates in Tennessee counties varied from 2012-2016 after accounting for employment status and income.
Note: The 5-year average uninsured rates shown here are based on data from the U.S. Census Bureau. While uninsured rates are often discussed in the context of a single year, the Census Bureau does not publish 1-year estimates for areas with populations below 65,000, which excludes many Tennessee counties. In 2016, the most recent year available, Census data show that 9% of Tennesseans were uninsured statewide.
Figure 1

Figure 2
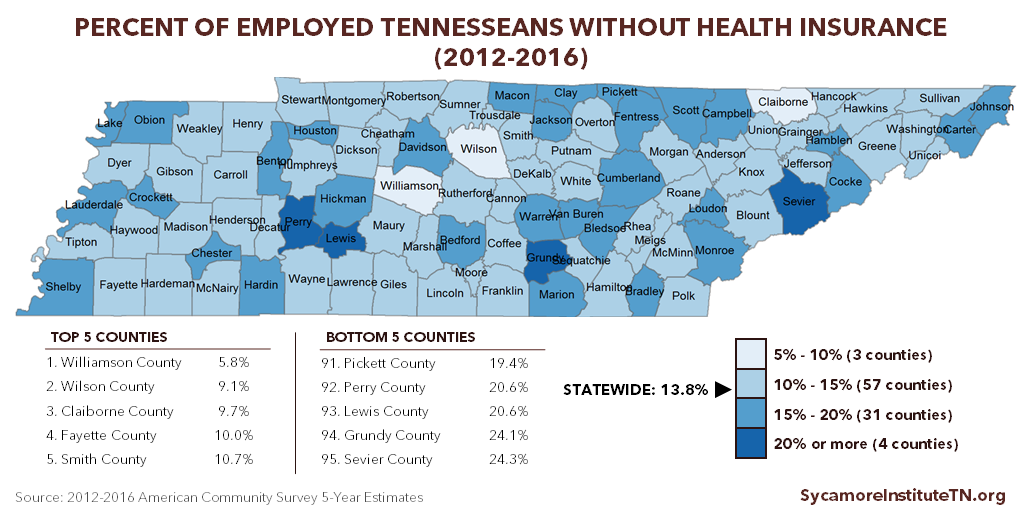
Table 1
Incomes Associated with 2016 Federal Poverty Percentages
Incomes Associated with 2016 Federal Poverty Percentages
Figure 3
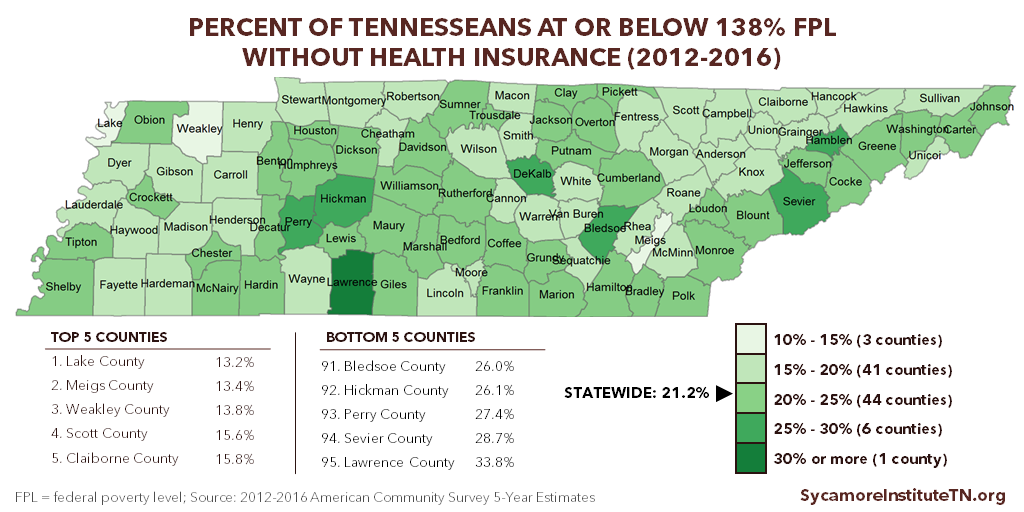
Figure 4
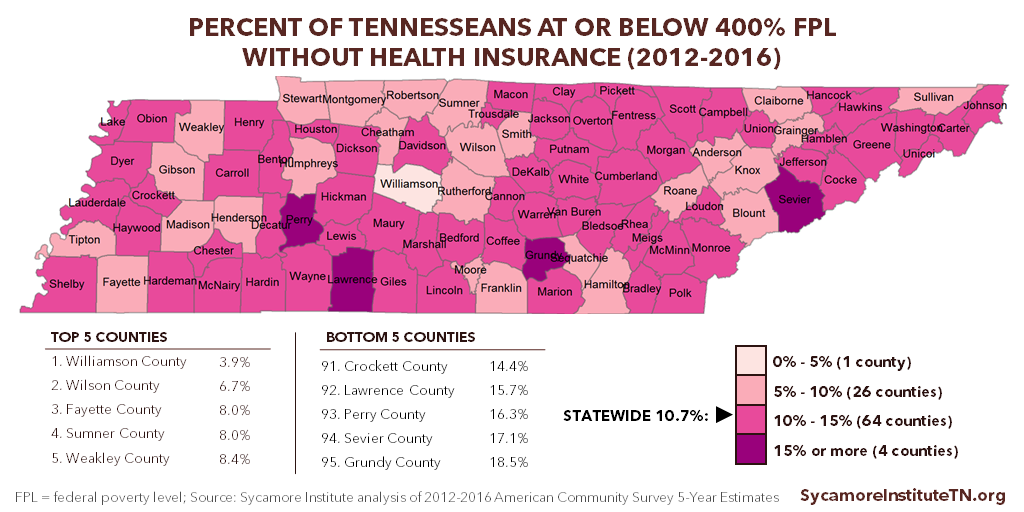
Table 2
Tennessee Uninsured Rates by County (2012-2016)
Tennessee Uninsured Rates by County (2012-2016)
| Uninsured 1 | Uninsured – Employed 2 | Uninsured – Less Than 138% FPL 3 | Uninsured – Less Than 400% FPL 4 |
|
|---|---|---|---|---|
| (percent of population) | ||||
| Tennessee i | 11.8% | 13.8% | 21.2% | 10.7% |
| Anderson County | 9.3% | 11.1% | 19.4% | 8.6% |
| Bedford County | 14.0% | 17.3% | 22.4% | 12.3% |
| Benton County | 13.4% | 15.6% | 24.0% | 12.7% |
| Bledsoe County | 14.4% | 15.1% | 26.0% | 12.4% |
| Blount County | 10.1% | 12.7% | 20.1% | 9.2% |
| Bradley County | 13.1% | 15.2% | 24.6% | 11.9% |
| Campbell County | 12.8% | 15.3% | 17.8% | 12.1% |
| Cannon County | 11.8% | 14.2% | 17.5% | 11.0% |
| Carroll County | 11.0% | 12.2% | 17.6% | 10.4% |
| Carter County | 13.8% | 16.8% | 21.1% | 13.3% |
| Cheatham County | 10.6% | 12.0% | 19.0% | 9.7% |
| Chester County | 12.5% | 16.2% | 23.7% | 11.5% |
| Claiborne County | 9.4% | 9.7% | 15.8% | 8.6% |
| Clay County | 13.4% | 16.5% | 21.3% | 13.3% |
| Cocke County | 14.4% | 17.9% | 20.0% | 13.7% |
| Coffee County | 11.7% | 13.9% | 21.9% | 10.9% |
| Crockett County | 15.1% | 16.8% | 24.0% | 14.4% |
| Cumberland County | 12.5% | 18.4% | 20.9% | 11.7% |
| Davidson County | 14.2% | 16.1% | 23.3% | 12.9% |
| Decatur County | 11.2% | 13.8% | 21.3% | 10.3% |
| DeKalb County | 13.5% | 14.5% | 26.0% | 11.9% |
| Dickson County | 11.7% | 12.5% | 22.7% | 10.9% |
| Dyer County | 10.8% | 13.8% | 18.2% | 10.2% |
| Fayette County | 9.1% | 10.0% | 19.3% | 8.0% |
| Fentress County | 13.2% | 19.2% | 17.8% | 12.1% |
| Franklin County | 9.9% | 12.4% | 23.2% | 9.4% |
| Gibson County | 10.5% | 14.5% | 15.9% | 9.6% |
| Giles County | 11.7% | 14.0% | 24.4% | 11.5% |
| Grainger County | 10.6% | 14.3% | 16.4% | 9.8% |
| Greene County | 12.1% | 14.2% | 21.0% | 11.3% |
| Grundy County | 19.3% | 24.1% | 23.3% | 18.5% |
| Hamblen County | 14.6% | 17.8% | 25.3% | 13.5% |
| Hamilton County | 10.5% | 12.8% | 21.0% | 9.5% |
| Hancock County | 12.8% | 14.8% | 16.6% | 12.4% |
| Hardeman County | 12.4% | 14.4% | 17.9% | 11.2% |
| Hardin County | 13.4% | 16.3% | 20.9% | 12.6% |
| Hawkins County | 11.0% | 14.0% | 18.8% | 10.2% |
| Haywood County | 11.5% | 12.8% | 17.7% | 11.1% |
| Henderson County | 10.9% | 12.0% | 18.5% | 9.9% |
| Henry County | 10.9% | 13.8% | 17.4% | 10.1% |
| Hickman County | 15.0% | 18.1% | 26.1% | 14.0% |
| Houston County | 12.5% | 16.2% | 23.1% | 11.9% |
| Humphreys County | 10.0% | 12.4% | 20.4% | 9.0% |
| Jackson County | 14.3% | 17.0% | 21.9% | 13.3% |
| Jefferson County | 11.4% | 14.1% | 20.2% | 10.6% |
| Johnson County | 12.7% | 16.3% | 20.4% | 12.4% |
| Knox County | 9.9% | 11.7% | 19.9% | 9.1% |
| Lake County | 13.0% | 17.1% | 13.2% | 12.0% |
| Lauderdale County | 13.5% | 16.5% | 19.2% | 12.9% |
| Lawrence County | 16.2% | 14.8% | 33.8% | 15.7% |
| Lewis County | 14.7% | 20.6% | 23.6% | 13.0% |
| Lincoln County | 10.9% | 12.9% | 19.5% | 10.4% |
| Loudon County | 11.6% | 15.3% | 22.3% | 10.8% |
| McMinn County | 11.5% | 16.6% | 18.8% | 10.6% |
| McNairy County | 10.6% | 12.2% | 16.2% | 12.5% |
| Macon County | 11.5% | 15.0% | 23.8% | 10.8% |
| Madison County | 11.6% | 13.4% | 21.2% | 9.4% |
| Marion County | 11.1% | 13.3% | 20.9% | 10.8% |
| Marshall County | 11.6% | 14.1% | 19.1% | 10.1% |
| Maury County | 13.5% | 14.9% | 23.4% | 10.2% |
| Meigs County | 11.3% | 13.8% | 13.4% | 10.5% |
| Monroe County | 12.7% | 15.4% | 21.8% | 11.6% |
| Montgomery County | 10.4% | 13.6% | 17.7% | 8.9% |
| Moore County | 9.4% | 13.0% | 19.1% | 8.6% |
| Morgan County | 12.1% | 12.5% | 17.5% | 11.6% |
| Obion County | 13.8% | 15.5% | 22.3% | 12.9% |
| Overton County | 11.3% | 14.9% | 20.7% | 10.7% |
| Perry County | 16.9% | 20.6% | 27.4% | 16.3% |
| Pickett County | 12.9% | 19.4% | 21.8% | 12.8% |
| Polk County | 10.8% | 11.6% | 23.4% | 10.1% |
| Putnam County | 12.4% | 14.2% | 21.6% | 11.3% |
| Rhea County | 10.5% | 12.9% | 19.7% | 10.3% |
| Roane County | 9.8% | 11.4% | 17.0% | 9.1% |
| Robertson County | 10.3% | 12.5% | 17.2% | 8.7% |
| Rutherford County | 11.1% | 12.2% | 22.3% | 9.7% |
| Scott County | 12.9% | 15.4% | 15.6% | 11.9% |
| Sequatchie County | 10.5% | 11.9% | 18.3% | 9.5% |
| Sevier County | 18.3% | 24.3% | 28.7% | 17.1% |
| Shelby County | 13.7% | 15% | 22.6% | 12.5% |
| Smith County | 9.7% | 10.7% | 18.3% | 8.5% |
| Stewart County | 10.5% | 11.7% | 16.3% | 9.7% |
| Sullivan County | 10.7% | 13.2% | 18.7% | 9.9% |
| Sumner County | 9.6% | 11.6% | 20.6% | 8.0% |
| Tipton County | 11.2% | 13.0% | 22.6% | 9.9% |
| Trousdale County | 12.3% | 12.8% | 21.4% | 10.9% |
| Unicoi County | 11.6% | 13.9% | 19.4% | 10.7% |
| Union County | 12.1% | 13.5% | 19.6% | 10.7% |
| Van Buren County | 12.2% | 16.5% | 19.3% | 11.1% |
| Warren County | 12.7% | 17.0% | 16.7% | 12.0% |
| Washington County | 11.1% | 13.5% | 21.6% | 10.3% |
| Wayne County | 12.1% | 14.9% | 18.0% | 10.9% |
| Weakley County | 9.4% | 12.1% | 13.8% | 8.4% |
| White County | 12.8% | 14.1% | 19.1% | 12.6% |
| Williamson County | 5.2% | 5.8% | 24.0% | 3.9% |
| Wilson County | 8.0% | 9.1% | 18.6% | 6.7% |
1 The percentage of individuals of all ages who did not have health insurance.
2 The percentage of individuals of all ages who are employed who did not have health insurance.
3 The percentage of individuals of all ages with household incomes at or below 138% of the federal poverty level who did not have health insurance.
4 The percentage of individuals of all ages with household incomes at or below 400% of the federal poverty level who did not have health insurance.
References
Click to Open/Close
1. U.S. Census Bureau. 2012-2016 American Community Survey 5-Year Estimates. [Online] 2017. Accessed via https://www.census.gov/programs-surveys/acs/data.html.
2. U.S. Department of Health and Human Services (HHS). Computations for the 2016 Poverty Guidelines. [Online] April 25, 2016. https://aspe.hhs.gov/computations-2016-poverty-guidelines.
*This post was updated on 1/31/18 to display the correct titles for Figures 1-4.