
Key Takeaways
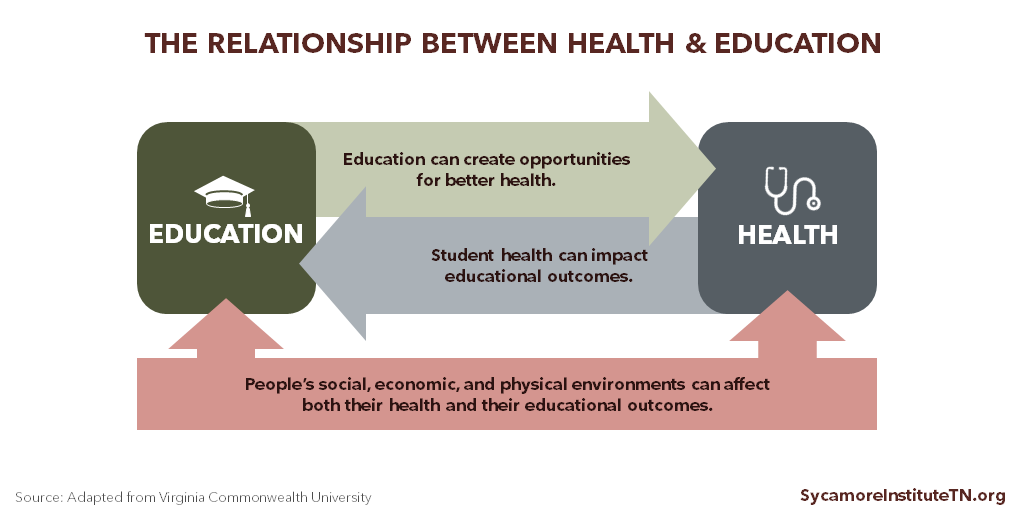
- Health and education are mutually influential. Education can create opportunities for better health, and an individual’s health can influence their educational achievement and outcomes.
- Higher levels of education correlate with better health outcomes for individuals, communities, and whole populations.
- Both health and education policy may benefit from discussions that consider their close and complex connections.
This report explores one side of the education-health relationship: how education influences health. (Figure 1) Specifically, the report looks at education and opportunities for better health, the role of early childhood experiences, Tennessee data on education and health, and the public policy implications of the education-health relationship.
Figure 1
Education and Health Outcomes
People with more education tend to have better health outcomes. At age 25, American adults with a bachelor’s degree can expect to live 9 years longer than those without a high school education — a gap that has widened over time. (2) (3) In general, mortality rates and health outcomes continue to improve with each additional year of schooling. (4) (5) (6) (7)
Education and Health Outcomes in Tennessee
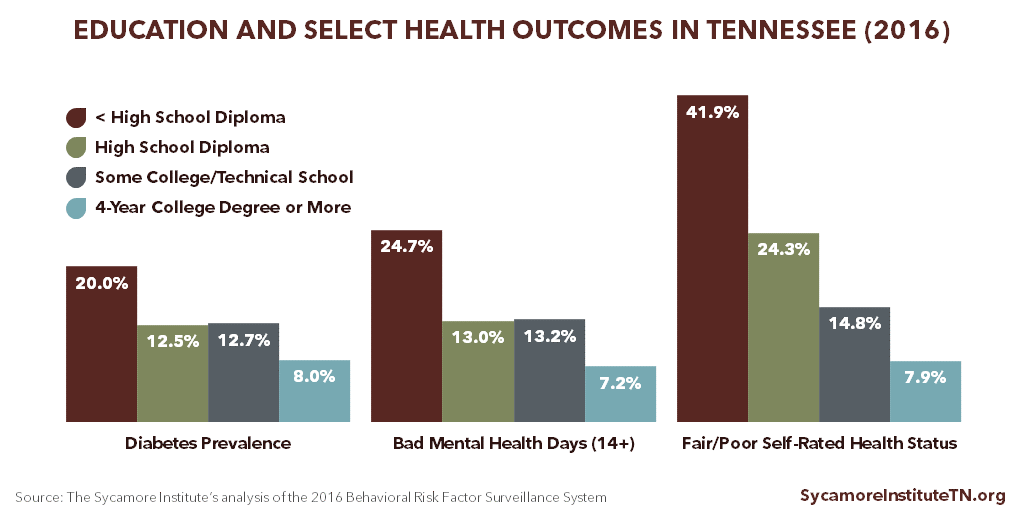
Data show clear connections between Tennesseans’ educational attainment and health outcomes. For example, Tennesseans with a college degree have lower diabetes rates, fewer self-reported poor mental health days, and better self-rated health statuses than other residents. (Figure 2)
Figure 2
Education and Opportunities for Better Health
Access to education and educational attainment are closely linked with the factors that influence health. For example, individuals with more education are more likely to have jobs, higher incomes, and health insurance and engage in more health-promoting behaviors. (10) (7)
Education can increase access to the economic resources and supportive social networks and environments that create opportunities for individuals to improve their health. (9) For instance, individuals with more education are more likely to live in neighborhoods with access to healthy foods, opportunities for physical activity, lower crime rates, access to health care providers, lower levels of environmental toxins, and high quality education. (1) (9)
The relationships between these factors interconnect in complex and often cyclical ways. For example, residents of lower-income neighborhoods tend to have fewer opportunities for good health and quality education. (9) The lack of a quality education can in turn reduce a person’s access to opportunities and resources to improve their health and education, as well as that of their children.
The Role of Adverse Childhood Experiences
Experiences early in life that cause severe, chronic stress can have lifelong negative effects on education and health outcomes. People who face these adverse childhood experiences (ACEs), such as exposure to household dysfunction or psychological, physical, or sexual abuse, are less likely to attain higher levels of education. (12) The more ACEs individuals face, the less likely they are to have resources or develop characteristics that help them maintain good health and cope with stress in healthy ways — including social supports, high self-esteem, and a sense of impulse control. (9) (13) (14)
Early childhood and adolescence are critical times for human brain development. Exposure to ACE-related toxic stress (e.g. interpersonal conflict, housing issues, food insecurity, unsafe neighborhoods, and environmental toxins) disrupts this brain development. Due to the effects on the brain, this exposure increases the risk for many behaviors and coping mechanisms that have long-term negative effects, such as alcohol abuse, drug abuse, and smoking. ACEs science shows that as exposure to childhood toxic stress increases, so does the risk for:
- Being less engaged in school (14)
- Repeating a grade (15)
- Poorer cognitive development (16)
- Poorer mental and physical health (17)
- Premature death (17)
While exposure to chronic stress increases the risk, negative health and educational outcomes are not inevitable. Building resilience, support for children and families at the individual and community level, and increasing awareness can prevent or mitigate ACEs and their effects. Opportunities for these interventions often occur in educational settings. (15) (17)
Education and Opportunities for Better Health in Tennessee
Tennesseans with different levels of education often have differences in the drivers of health — the environments, behaviors, and clinical care that affect our health and well-being. For example, Tennesseans:
- Without a high school diploma have higher rates of unemployment (8.5%) and lower incomes ($21,156) than college graduates (2.5% and $46,065). (Figure 3)
- Without a high school diploma have higher uninsured rates (20.2%) than college graduates (3.7%). (Figure 3)
- With lower levels of educational attainment have higher rates of smoking, are less physically active, and are more likely to skip needed medical care due to cost. (Figure 4)
- Without a high school diploma have the highest prevalence of 3 or more ACEs. (Figure 4)
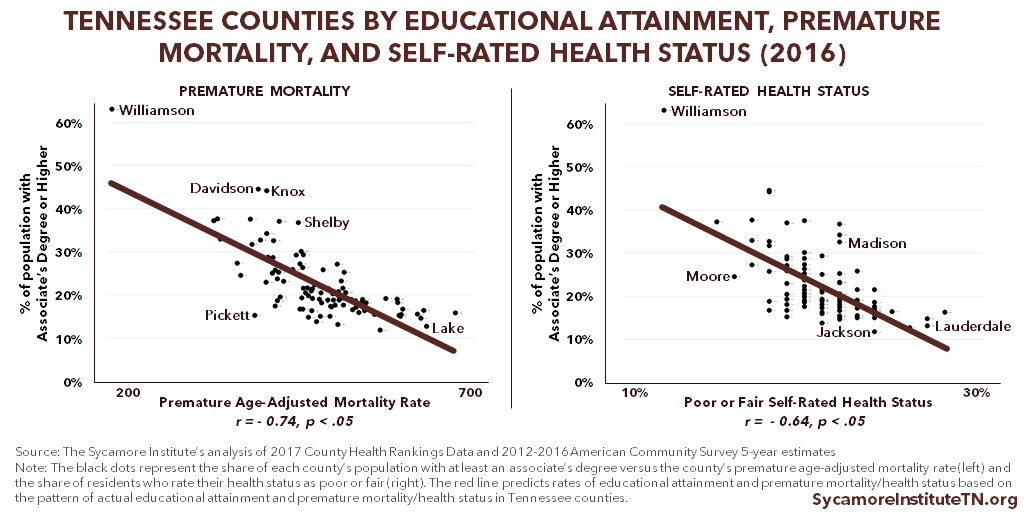
Tennessee counties with higher educational attainment are generally healthier than other counties. (29) As the education level of a county increases, premature mortality and the share of the population reporting poor or fair health decreases (Figure 5). (23)
Figure 3
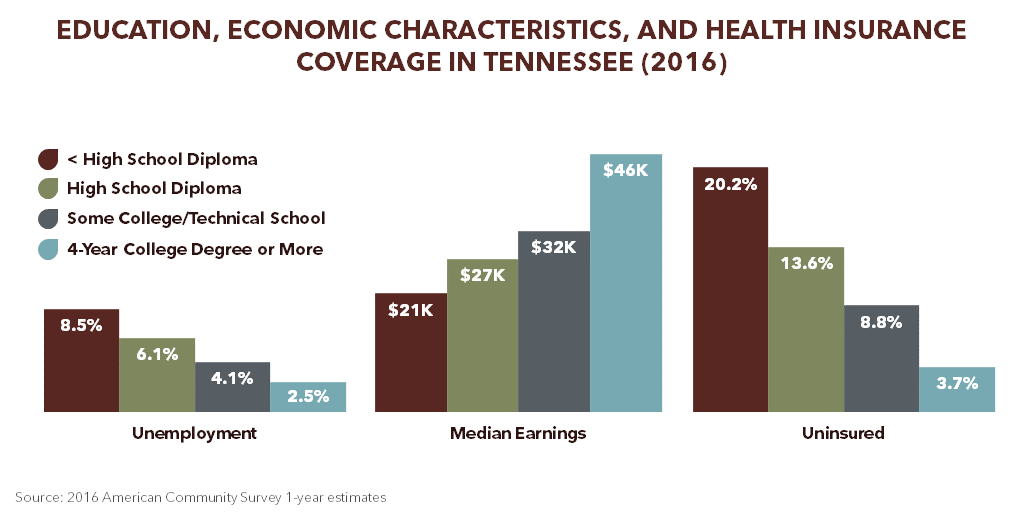
Figure 4
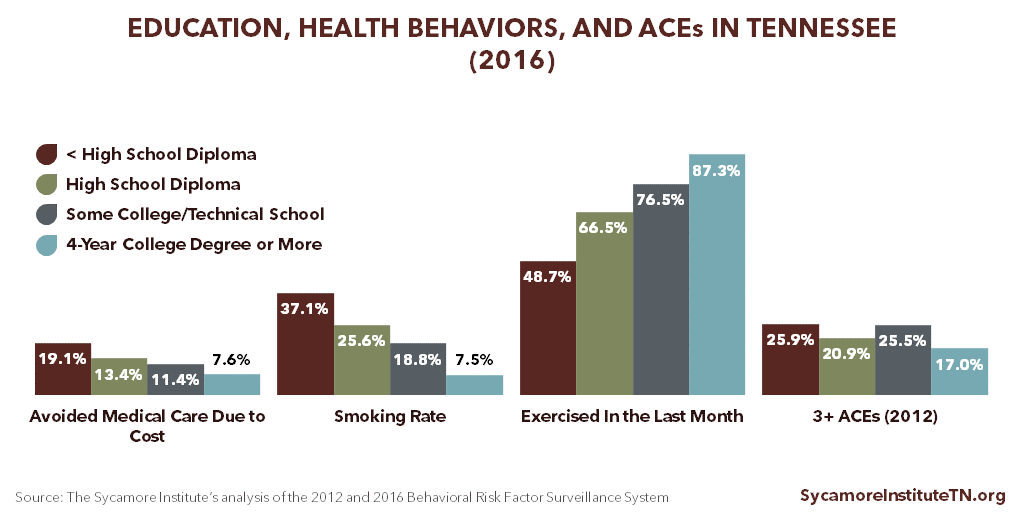
Figure 5
Considering the Education and Health Relationship in Public Policy
Because of the mutually influential relationship between education and health, many public policies can affect both the educational and health outcomes of Tennesseans. (24) Policymakers interested in improving health and education in Tennessee may want to consider how their decisions affect:
- The Complex Health-Education Relationship — Health and education issues are typically discussed separately, yet they are closely connected. For example, physical activity policies in schools directly affect students’ health status, academic achievement, and cognitive performance. (28) Recognizing these health impacts by taking a Health in All Policies approach, for example, can help foster collaboration between the health and education sectors.
- Children’s Health and Well-Being — Childhood is an opportune time to influence both the education and health trajectory of Tennesseans. Evidence-based policies and programs that support children’s health and well-being and target children at increased risk of experiencing toxic stress can improve short- and long-term educational outcomes, health, and prosperity. (25) (26)
- Access to Quality K-12 Education and Post-Secondary Readiness — Many social and economic factors influence access to a quality education. For example, people with low incomes and students of color are more likely to attend schools with fewer instructional resources, lower-paid teachers, larger class sizes, and less school funding. (8) Differential access to quality education creates barriers to educational attainment and further complicates the relationship between education and health.
- Access to Post-Secondary Education and Training — Policies and programs that improve access to post-secondary education and training may also influence population health. Tennessee has taken steps to make higher education more affordable through Tennessee Reconnect, Tennessee Promise, and the Tennessee HOPE Scholarship. Factors like affordability and academic readiness may pose barriers to attending and completing post-secondary education, which could compromise related policies’ effects on educational attainment and population health. (27)
Educational Attainment in Tennessee
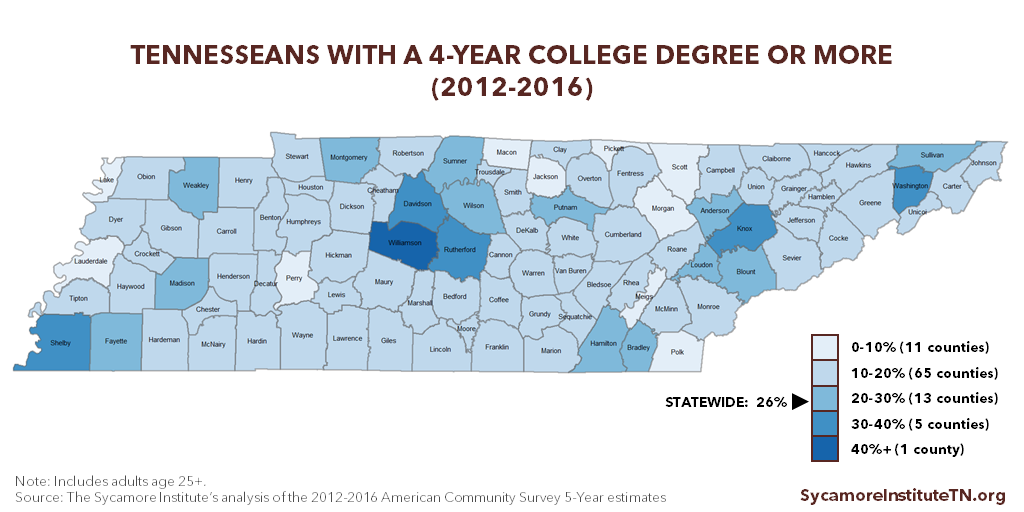
Tennesseans’ educational attainment lags behind the U.S. average but has improved over time (Figure 6). The share of Tennesseans with at least an associate’s degree (33.4%) and at least a bachelor’s degree (26.1%) remains below the national averages (31.3% and 39.6%, respectively) (Figure 7). There is also significant geographic variation in educational attainment across the state (Figure 8).
Figure 6
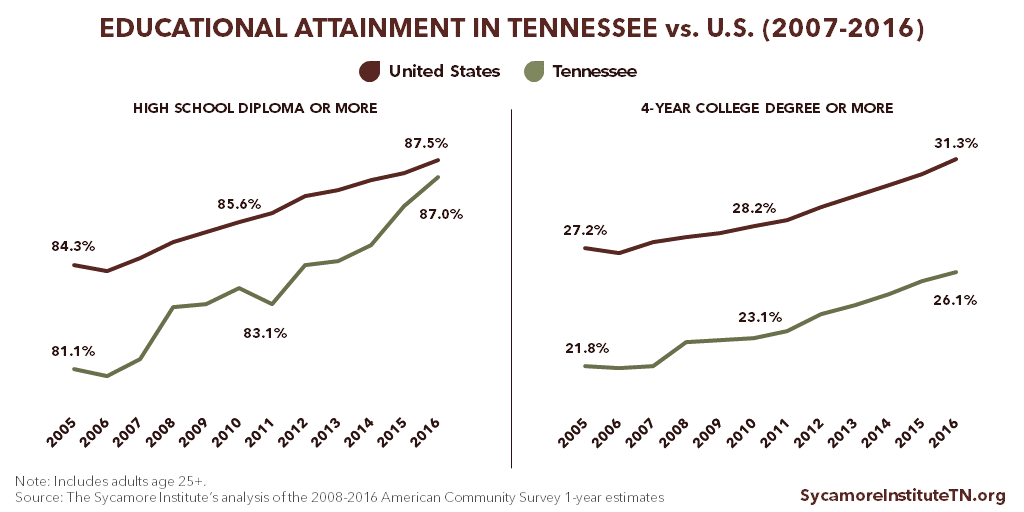
Figure 7
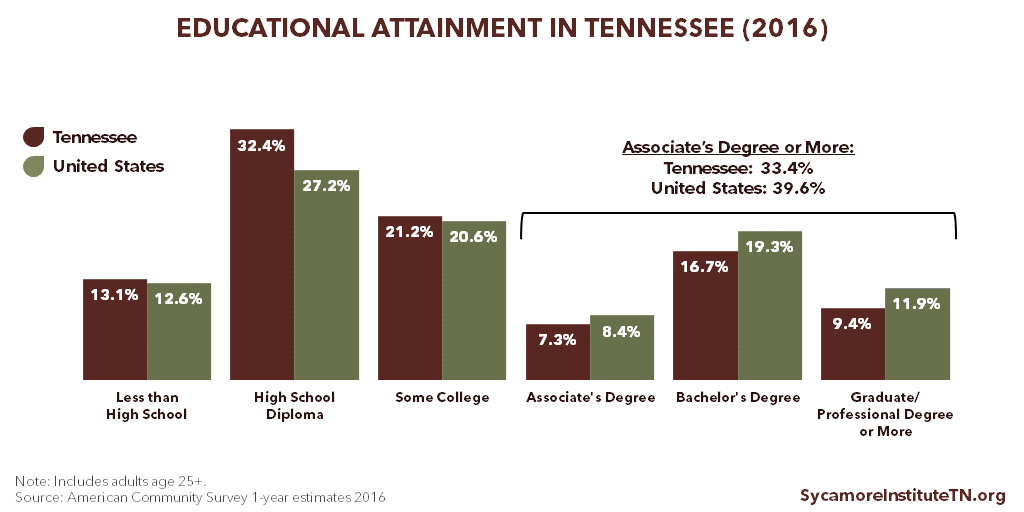
Figure 8
A Note on Educational Attainment Data
There are a number of ways to slice the data on educational attainment, which measures the highest level of education that an individual has achieved. This report analyzes data from 2 sources that report different categories of educational attainment: the U.S. Centers for Disease Control and Prevention’s Behavioral Risk Factor Surveillance System (BRFSS) and the U.S. Census’ American Community Survey (ACS).
The table below displays the educational attainment categories reported for each survey, which have important implications for data analyses. For example, neither survey asks specific questions about technical/vocational school certificates or degrees, which is one of the underlying metrics for Tennessee’s “Drive to 55” initiative. Additionally, BRFSS is the only publicly available dataset that provides state-level information on both health and educational attainment. The data limitations of BRFSS, however, mean that we are unable to draw out any health-related differences (if any exist) between graduates of technical/vocational school or community college and graduates of a 4-year college.
| Educational Attainment Categories by Data Source | |
|---|---|
| Behavioral Risk Factor Surveillance System (31) | American Community Survey (32) |
| • Never attended school or only kindergarten | • No schooling completed |
| • Grades 1 through 8 (Elementary) | • Nursery school |
| • Grades 9 through 11 (Some high school) | • Grades 1-11 |
| • Grades 12 or GED (High school graduate) | • 12 grade — no diploma |
| • College 1 year to 3 years (Some college or technical school) | • Regular high school diploma |
| • College 4 years or more (College graduate) | • GED or alternative credential |
| • Some college credit, but less than 1 year of college | |
| • 1 or more years of college credit, no degree | |
| • Associate’s degree | |
| • Bachelor’s degree | |
| • Master’s degree | |
| • Professional degree beyond bachelor’s degree | |
| • Doctorate degree | |
The analyses in this report primarily use completion of a 4-year degree or more as the highest level of educational attainment. We chose this level over available alternatives because: (1) data are available on this group from both sources and (2) this group has distinctly better health outcomes than other groups for which health data are available (Figure 2).
References
Click to Open/Close
- Virginia Commonwealth University. Why Education Matters to Health: Exploring the Causes. Center on Society and Health. [Online] April 2014. https://societyhealth.vcu.edu/media/society-health/pdf/test-folder/CSH-EHI-Issue-Brief-2.pdf
- U.S. Centers for Disease Control and Prevention (CDC). Health, United States, 2011: With Special Feature on Socioeconomic Status and Health. National Center for Health Statistics. [Online] 2012. https://www.cdc.gov/nchs/data/hus/hus11.pdf
- Jemal, Ahmedin, et al. Widening of Socioeconomic Inequalities in U.S. Death Rates, 1993-2001. PLoS one, 3(5):e2181. [Online] 2008. http://journals.plos.org/plosone/article/file?id=10.1371/journal.pone.0002181&type=printable
- Olshansky, S Jay, et al. Differences in Life Expectancy Due to Race and Educational Differences Are Widening, and Many May Not Catch Up. Health Affairs, 31(8): 1803-1813. [Online] 2012. http://content.healthaffairs.org/content/31/8/1803.full.pdf
- Cutler, David M and Lleras-Muney, Adriana. Education and Health. National Policy Center Policy Brief #9. [Online] March 2007. http://www.npc.umich.edu/publications/policy_briefs/brief9/policy_brief9.pdf
- Feinstein, Leon, et al. 4. What are the Effects of Education on Health? Measuring the Effects of Education on Health and Civic Engagement: Proceedings of the Copenhagen Symposium, OECD. [Online] 2006. https://www1.oecd.org/edu/innovation-education/37425753.pdf
- U.S. Centers for Disease Control and Prevention (CDC). Health, United States, 2016: With Chartbook on Long-term Trends in Health. National Center for Health Statistics. [Online] 2017. https://www.cdc.gov/nchs/data/hus/hus16.pdf.
- —. 2016 Behavioral Risk Factor Surveillance System (BRFSS). [Online] 2017. [Accessed on September 12, 2017.] Accessed via https://www.cdc.gov/brfss/annual_data/annual_2016.html
- Ma, Jennifer, Pender, Matea and Welch, Meredith. Education Pays 2016: The Benefits of Higher Education for Individuals and Society. CollegeBoard. [Online] 2016. https://trends.collegeboard.org/sites/default/files/education-pays-2016-full-report.pdf
- Zimmerman, Emily, Woolf, Steven H and Haley, Amber. Understanding the Relationship Between Education and Health: A Review of the Evidence and an Examination of Community Perspectives. Agency for Healthcare Research and Quality. [Online] September 2015. https://www.ahrq.gov/professionals/education/curriculum-tools/population-health/zimmerman.html
- Metzler, Marilyn, et al. Adverse Childhood Experiences and Life Opportunities: Shifting the Narrative. Children and Youth Services, 72: 141-149. [Online] January 2017.http://www.sciencedirect.com/science/article/pii/S0190740916303449
- Krueger, Patrick M and Chang, Virginia W. Being Poor and Coping with Stress: Health Behaviors and the Risk of Death. American Journal of Public Health, 98: 889-896. [Online] 2008. http://citeseerx.ist.psu.edu/viewdoc/download;jsessionid=FCE075CBD0F8475F0E5970583C277DA0?doi=10.1.1.653.6268&rep=rep1&type=pdf
- Thoits, Peggy A. Stress and Health: Major Findings and Policy Implications. Journal of Health and Social Behvaior, 51(S): S41-S53. [Online] 2010. http://journals.sagepub.com/doi/pdf/10.1177/0022146510383499
- Bethell, Christina D, et al. Adverse Childhood Experiences: Assessing the Impact on Health and School Engagement and the Mitigating Role of Resilience. Health Affairs, 33(12): 2106-2115. [Online] 2014. https://www.researchgate.net/profile/Neal_Halfon/publication/269413453_Adverse_Childhood_Experiences_Assessing_The_Impact_On_Health_And_School_Engagement_And_The_Mitigating_Role_Of_Resilience/links/54bdc08d0cf27c8f2814c415.pdf
- Evans, Gary W, Brooks-Gunn, Jeanne and Klebanov, Pamela Kato. Stressing Out the Poor: Chronic Physiological Stress and the Income-Achievement Gap. Pathways Winter 2011, Stanford Center on Poverty and Inequality. [Online] 2011. http://inequality.stanford.edu/sites/default/files/PathwaysWinter11_Evans.pdf
- Verbitsky-Savitz, Natalya, et al. Preventing and Mitigating the Effects of ACEs by Building Community Capacity and Resilience: APPI Cross-Site Evaluation Findings (Final Report). Mathematica Policy Research. [Online] July 14, 2016. https://www.mathematica-mpr.com/our-publications-and-findings/publications/final-report-preventing-and-mitigating-the-effects-of-aces-by-building-community-capacity
- The Sycamore Institute. Analysis of 2017 County Health Rankings data and 2012-2016 American Community Survey 5-year data. [Online] 2017.
- U.S. Census Bureau. 2017 American Community Survey 1-year estimates. [Online] 2017. [Accessed on December 7, 2017.] Accessed via https://factfinder.census.gov/faces/nav/jsf/pages/index.xhtml
- U.S. Centers for Disease Control and Prevention. 2012 Behavioral Risk Factor Surveillance System (BRFSS). [Online] 2013. Accessed via https://www.cdc.gov/brfss/annual_data/annual_2012.html.
- Robert Wood Johnson Foundation. 2017 County Health Rankings. County Health Rankings & Roadmaps. [Online] 2017. Accessed via http://www.countyhealthrankings.org/.
- U.S. Census Bureau. 2012-2016 American Community Survey 5-year estimates. [Online] 2017. [Accessed on December 7, 2017.] Accessed via https://factfinder.census.gov/faces/nav/jsf/pages/index.xhtml
- Low, M David, et al. Can Education Policy Be Health Policy? Implications on the Social Determinants of Health. Journal of Health Politics, Policy, and Law, 30(6): 1131-1162. [Online] 2005. https://www.researchgate.net/publication/7296299_Can_Education_Policy_be_Health_Policy_Implications_of_Research_on_the_Social_Determinants_of_Health
- Kohl III, Harold W and Cook, Heather D. Educating the Student Body: Taking Physical Activity and Physical Education to School. Committee on Physical Activity and Physical Education in the School Environment, Food and Nutrition Board, Institute of Medicine. [Online] October 2013. https://www.ncbi.nlm.nih.gov/books/NBK201500/pdf/Bookshelf_NBK201500.pdf
- Mihalic, Sharon F and Elliott, Delbert S. Evidence-based programs registry: Blueprints for Healthy Youth Development. Evaluation and Program Planning, 48(124-131). [Online] 2015. http://www.blueprintsprograms.com/publications/EBPs_BPsRegistry.pdf
- Corwin, Tyler, Pecora, Peter J and Ostrum, Patricia. Community-Based Family Support: Exemplars with Implementation and Evaluation Strategies. Casey Family Programs. [Online] May 2016. http://www.casey.org/media/community-based-family-support.pdf
- Darling-Hammond, Linda. Inequality in Teaching and Schooling: How Opportunity is Rationed to Students of Color in America. Darling-Hammond L. Inequality in teachin In The right thing to do, the smart thing to do: Enhancing diversity in health professions–Summary of the Symposium on diversity in health professions in honor of Herbert W. Nickens, MD, (pp. 208-233). [Online] August 29, 2001. https://www.ncbi.nlm.nih.gov/books/NBK223633/pdf/Bookshelf_NBK223633.pdf
- Long, Bridget Terry. Proposal G: Addressing the Academic Barriers to Higher Education. The Hamilton Project, Brookings Institution. [Online] 2014. https://www.brookings.edu/wp-content/uploads/2016/06/higher_education_remediation_long.pdf
- Brown, Dustin C, et al. The Significance of Education for Mortality Compression in the United States. Demography, 49(3): 819-840. [Online] 2013. https://www.ncbi.nlm.nih.gov/pmc/articles/PMC3500099/
- Scott, Katherine, Stiles, Jeremy and Avery, Sally. Economic Development, Education and Health in Tennessee. Center for Economic Research in Tennessee (CERT), Tennessee Deaprtment of Economic & Community Development. [Online] January 2017. https://www.tnecd.com/files/459/economic-development-education-and-health_01-23-2017-2-.pdf
- U.S. Census Bureau. 2007-2016 American Community Survey 1-year estimates. [Online] 2008-2017. Accessed via www.factfinder.census.gov
- U.S. Centers for Disease Control and Prevention. 2016 BRFSS Codebook. [Online] June 29, 2017. https://www.cdc.gov/brfss/annual_data/2016/pdf/codebook16_llcp.pdf.
- U.S. Census Bureau. About: Educational Attainment. [Online] November 16, 2016. https://www.census.gov/topics/education/educational-attainment/about.html


