Tennessee has many attributes that make it an attractive place to start, move, or grow a business. Unfortunately, Tennesseans’ health is not one of them. We trail the nation on a wide range of key health indicators and outcomes. This brief sums up 3 ways Tennesseans’ relatively poor health hurts our economy and workforce development.
Key Takeaways
- Tennessee trails most other states on a wide range of key health indicators and outcomes, including chronic disease, mortality rates, and disabilities.
- Poor health shrinks our workforce. Healthier people are more likely to work or actively seek work than people in poor health. The opioid epidemic shrinks the labor pool even further.
- Poor health reduces our productivity. Healthier workers are more productive and miss fewer days of work for health reasons. Rampant substance abuse drives productivity even lower.
- Poor health makes us more costly to employ. Employers are the single largest source of health insurance coverage in Tennessee, and the costs go up when workers are less healthy.
1. Poor Health Shrinks Our Workforce.
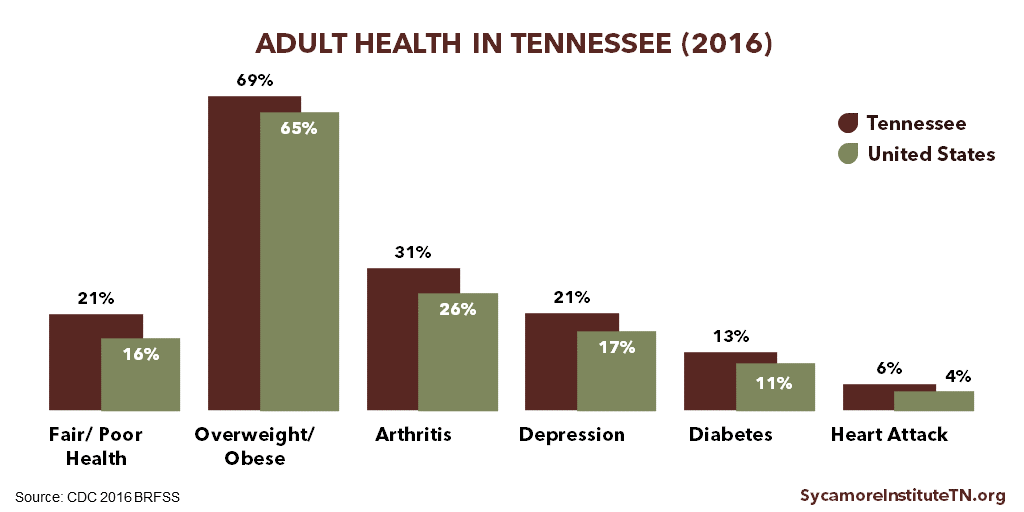
Healthier people are more likely to work or actively seek work than people in poor health. (1) (2) (3) Tennessee has higher rates than most other states of both disabilities and chronic conditions like diabetes, depression, cardiovascular disease, and obesity (Figure 1). (4) (5) Being diagnosed with diabetes, for example, is associated with leaving the workforce earlier or not looking for employment after losing a job. (2) In addition, Tennessee’s mortality rate is higher than the national rate for each of the top 10 causes of death. (6)
The opioid epidemic shrinks the labor pool even further. Recent research found the opioid epidemic has accelerated the decline of labor force participation. (7) (8) (9) In addition, evidence suggests that job candidates’ drug-related criminal records or failure to pass required drug screenings has slowed some employers’ hiring efforts. (7) (10) Tennessee’s increasing rates of opioid-related overdose deaths and hospitalizations are driven in part by addiction, a chronic, relapsing brain disease.
Many industries in Tennessee are facing worker shortages. (11) A number of factors influence workforce supply, but Tennessee’s high rates of chronic disease and the state’s opioid epidemic contribute to these challenges.
Figure 1
2. Poor Health Reduces Our Productivity.
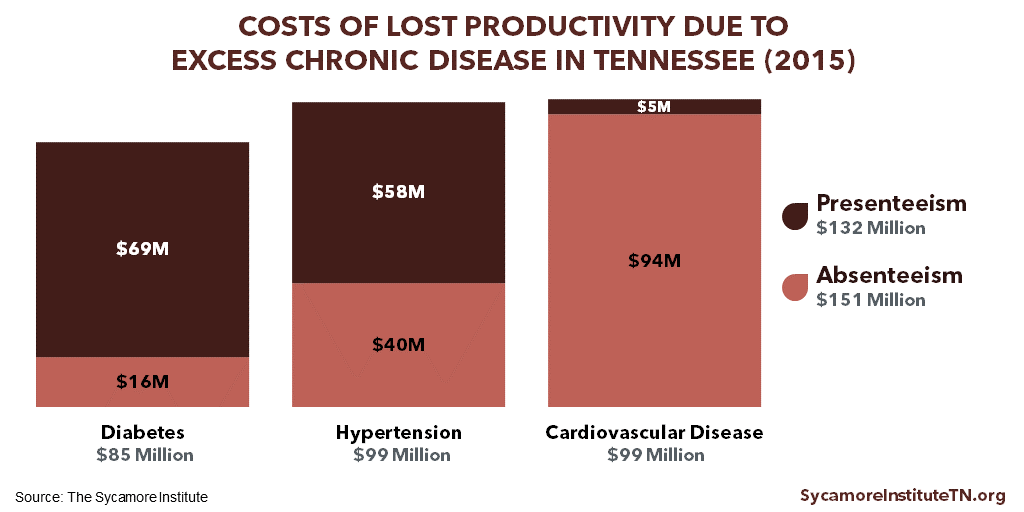
Tennessee’s high rates of just 3 chronic diseases cost an estimated $280 million in lost productivity in 2015 (Figure 2). Research shows that healthier workers are more productive and miss fewer days of work for health reasons. (12) (13) When workers miss days due to illness (i.e. “absenteeism”), they either lose wages or their employers pay wages with no work garnered. Meanwhile, lower on-the-job productivity from sickness (i.e. “presenteeism”) can reduce employers’ economic output.
Employee dependence on drugs like opioids also affects productivity. Substance abuse and drug dependence in general and opioid misuse in particular can increase absenteeism, presenteeism, and on-the-job injuries. (14) (15) (16) (17) (18) (19) Meanwhile, long-term or inappropriate opioid use can delay injured workers’ return to work, which may also increase workers’ compensation costs for employers. (20) (21) (22)
Research indicates that absent employees can also decrease the productivity of their coworkers. The effects of lost productivity are not limited to the specific job that an employee performs. When coworkers are absent, other employees may be more stressed or overwhelmed due to increased workload. (23) Employers may also spend time and resources to hire temporary workers or train another worker to perform new functions.
Figure 2
3. Poor Health Makes Us More Costly to Employ.
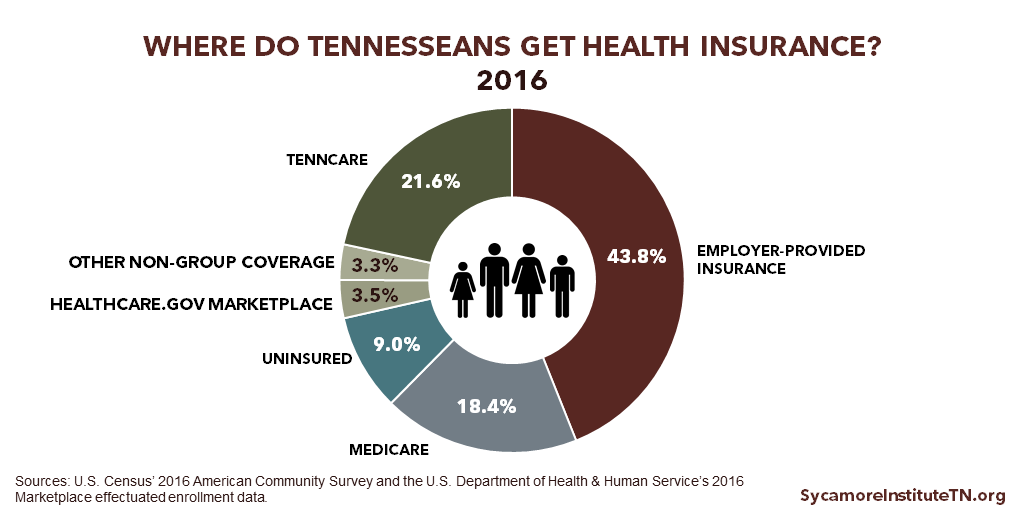
Tennessee’s high rates of just 3 chronic diseases were responsible for an estimated $920 million in employer health care costs in 2015 (Figure 3). Growing chronic disease rates have contributed to the rise of health care costs over the last several decades. (24) Over 43% of Tennesseans get their health insurance through an employer (Figure 4), and health insurance accounts for a greater share of those businesses’ labor costs than it did 15 years ago. (25)
Evidence suggests that the rising cost of employer-sponsored health insurance has slowed wage growth and increased employees’ out-of-pocket health spending. As employers’ health care costs grow, many look for strategies to help control these costs. For example, businesses may limit wage increases, offer less comprehensive health benefits, and increase premiums and/or cost-sharing requirements (e.g. deductibles). (26) (27) Available data show that workers’ wages have increased at a slower rate than deductibles and health care costs. (28) (25)
Figure 3
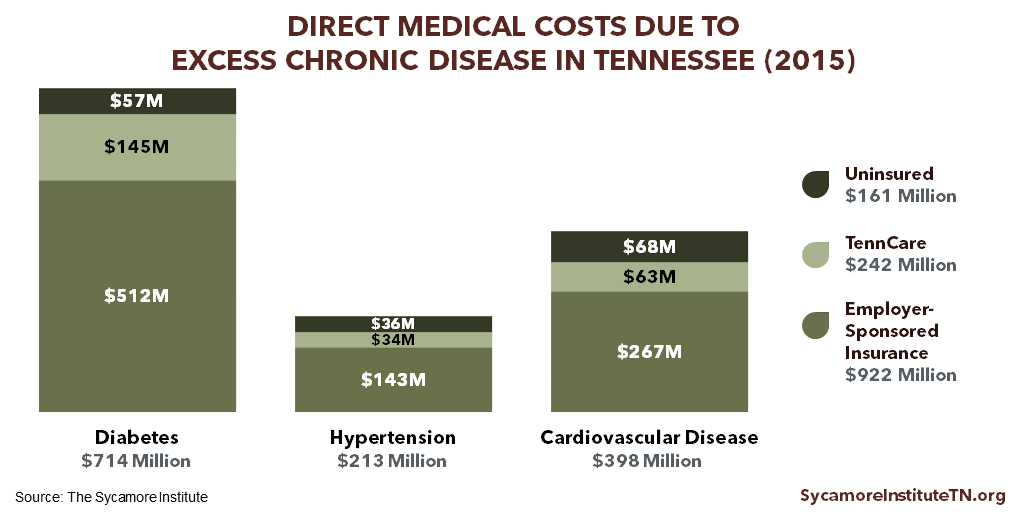
Figure 4
Related Work by The Sycamore Institute
The Economic Impact of Chronic Disease in Tennessee
(November 15, 2017) Estimates the cost of Tennessee’s high rates of 3 chronic disease to Tennessee taxpayers, business, and the economy.
Healthy Debate 2018: A Primer on Health & Budget Policy in Tennessee
(January 5, 2018) A resource for any Tennessean who hopes to make or influence public policy in our state.
Tabulation Tuesday: Employer Sponsored Health Insurance Deductibles in Tennessee
(July 25, 2017) Provides historical trend data on deductibles for employer-sponsored insurance in Tennessee.
Health Insurance Coverage in Tennessee in 2016
(October 5, 2017) Analyzes the most recent data on the rate of the uninsured and where insured Tennessean’s get health coverage.
References
Click to Open/Close
- Cai, Lixin. The Relationship Between Health and Labour Force Participation: Evidence from a Panel Data Simultaneous Equation Model. Melbourne Institute Working Paper No. 1/07, Melbourne Institute of Applied Economic and Social Research, The University of Melbourne. [Online] March 2007. https://www.researchgate.net/profile/Lixin_Cai/publication/222518037_The_Relationship_Between_Health_and_Labour_Force_Participation_Evidence_From_a_Panel_Data_Simultaneous_Equation_Model/links/0912f508ed51f457a1000000.pdf.
- Rumball-Smith, Juliet, et al. Diabetes Associated with Early Labor-Force Exit: A Comparison of Sixteen High-Income Countries. Health Affairs, 33(1): 110-115. [Online] January 2014. http://content.healthaffairs.org/content/33/1/110.full.
- Maurer, Jürgen, Klein, Roger and Vella, Francis. Subjective Health Assessments and Active Labor Market Participation of Older Men: Evidence from a Semiparametric Binary Choice Model with Nonadditive Correlated Individual-Specific Effects. IZA Discussion Papers, No. 3257, Insitute of Labor Economics (Germany). [Online] 2007. https://www.econstor.eu/bitstream/10419/35226/1/56298514X.pdf.
- U.S. Centers for Disease Control and Prevention (CDC). 2016 Behavioral Risk Factor Surveillance System. [Online] 2017. Accessed via https://www.cdc.gov/brfss/brfssprevalence/.
- Erickson, W., Lee, C. and Von Schrader, S. Disability Statistics from the American Community Survey (ACS). Cornell University Yang-Tan Institute. [Online] 2017. [Cited: June 11, 2018.] Accessed via http://www.disabilitystatistics.org/reports/acs.cfm?statistic=1.
- U.S. Centers for Disease Control and Prevention (CDC). Underlying Cause of Death 1999-2016. WONDER Online Database. [Online] December 2017. Accessed via http://wonder.cdc.gov/ucd-icd10.html.
- Kreuger, Alan B. Where Have All the Workers Gone? An Inquiry Into the Decline of the U.S. Labor Force Participation Rate. Brookings Papers on Economic Activity. [Online] September 7, 2017. https://www.brookings.edu/bpea-articles/where-have-all-the-workers-gone-an-inquiry-into-the-decline-of-the-u-s-labor-force-participation-rate/.
- Aliprantis, Dionissi and Schweitzer, Mark E. Opioids and the Labor Market. Federal Reserve Bank of Cleveland. [Online] May 5, 2018. https://www.clevelandfed.org/en/newsroom-and-events/publications/working-papers/2018-working-papers/wp-1807-opioids-and-the-labor-market.aspx.
- Kofi Charles, Kerwin, Hurst, Erik and Schwartz, Mariel. The Transformation of Manufacturing and the Decline in U.S. Employment. The National Bureau of Economic Research. [Online] March 2018. http://www.nber.org/papers/w24468.
- The Federal Reserve System. Beige Book: Summary of Commentary on Current Economic Conditions by Federal Reserve District. [Online] July 12, 2017. https://www.federalreserve.gov/monetarypolicy/beigebook201707.htm.
- Tennessee Department of Economic and Community Development (ECD). TNECD Releases Labor and Education Alignment Report. [Online] November 8, 2017. https://www.tnecd.com/news/458/tnecd-releases-labor-and-education-alignment-report/.
- Bloom, David E and Canning, David. The Health and Wealth of Nations. Science, 287: 1208-1209. [Online] 2000. http://kie.vse.cz/wp-content/uploads/Bloom-Canning-2000.pdf.
- Gifford, Brian. Linking Workforce Health to Business Performance Metrics. Integrated Benefits Institute. [Online] September 2015. https://ibiweb.org/?ACT=65&id=nNXqF1ZCrmSMdVQt347T7CLC_og7FCWMqISJKp2Lni1Ooi0rCbTzoT-9JtA55Cdw0Wj-f0R9KMEWEqZ57_boouQ5-N9NyZyucyL0_n-Nl0ysPDgDeiwDi6TPBnU0ObI6.
- Bush, Donna M. and Lipari, Rachel N. Substance Use and Substance Use Disorder by Industry. U.S. Substance Abuse and Mental Health Services Administration (SAMHSA). [Online] April 16, 2015. https://www.samhsa.gov/data/sites/default/files/report_1959/ShortReport-1959.html.
- Van Hasselt, Martijn, et al. Prescription Drug Abuse and Workplace Absenteeism: Evidence from the 2008–2012 National Survey on Drug Use and Health. Journal of Workplace Behavioral Health. [Online] November 17, 2015. https://www.tandfonline.com/doi/abs/10.1080/15555240.2015.1047499?journalCode=wjwb20.
- Birnbaum, Howard G., et al. Societal Costs of Prescription Opioid Abuse, Dependence, and Misuse in the United States. Pain Medicine. [Online] April 2011. https://academic.oup.com/painmedicine/article/12/4/657/1869828.
- Inocencio, Timothy, et al. The Economic Burden of Opioid-Related Poisoning in the United States. Pain Medicine. [Online] October 2013. https://academic.oup.com/painmedicine/article/14/10/1534/1833726.
- Kuhl, Emily. Mitigating the Effects of Opioid Use Among Workers. American Psychiatric Association Partnership for Workplace Mental Health. [Online] 2015. Accessed via https://www.psychiatry.org/File%20Library/PWMH/Mitigating-Effects-Opioid-Use-Among-Workers.pdf.
- Druley, Kevin. Opioids and the Workforce. National Safety Council Safety + Health Magazine. [Online] September 24, 2017. http://www.safetyandhealthmagazine.com/articles/16129-opioids-and-the-workforce.
- Liberty Mutual. How an Increase in Opioid Prescriptions is Affecting Workers and Employers. [Online] 2015. https://business.libertymutualgroup.com/business-insurance/Documents/Coverages/LMI_Opioids%20White%20Paper.pdf.
- National Safety Council. Long-Term Opioid Use Significantly Delays Return to Work, Workers’ Comp Study Shows. Safety + Health Magazine. [Online] April 4, 2018. http://www.safetyandhealthmagazine.com/articles/16877-long-term-opioid-use-significantly-delays-return-to-work-workers-comp-study-shows.
- Savych, Bogdan, Neumark, David and Lea, Randall. Do Opioids Help Injured Workers Recover and Get Back to Work? The Impact of Opioid Prescriptions on Duration of Temporary Disability. The National Bureau of Economic Research. [Online] April 2018. http://www.nber.org/papers/w24528.
- Goodman, Paul S and Atkin, Robert S. Effects of Absenteesim on Individuals and Organizations. Carnegie Mellon University, Tepper School of Business. [Online] 1984. http://repository.cmu.edu/cgi/viewcontent.cgi?article=1836&context=tepper.
- U.S. Centers for Disease Control and Prevention (CDC). Chronic Disease Overview. Chronic Disease Prevention and Health Promotion. [Online] June 2017. https://www.cdc.gov/chronicdisease/index.htm.
- U.S. Bureau of Labor Statistics. Employer Costs for Employee Compensation: March 2004-March 2017. National Compensation Survey. [Online] 2018. [Cited: June 11, 2017.] https://www.bls.gov/ncs/ect/sp/ececqrtn.txt.
- U.S. Department of Health and Human Services (HHS). The Effect of Health Care Cost Growth on the U.S. Economy. Office of the Assistant Secretary for Planning and Evaluation. [Online] September 1, 2007. https://aspe.hhs.gov/system/files/pdf/75441/report.pdf.
- Finn, Patrick, et al. Growing Employer Interest in Innovative Ways to Control Healthcare Costs. McKinsey & Company, Healthcare Systems and Services Practice. [Online] May 2017. http://healthcare.mckinsey.com/sites/default/files/Growing-Employer-Interest-In-Innovative-Ways-To-Control-Healthcare-Costs_R8C.pdf.
- Schoen, Cathy, et al. State Trends in Premiums and Deductibles, 2003-2011: Eroding Protection and Rising Costs Underscore Need for Action. The Commonwealth Fund. [Online] December 2012. http://www.commonwealthfund.org/~/media/Files/News/News%20Releases/2012/Dec/1648_Schoen_state_trends_premiums_deductibles_2003_2011_1210_EMBARGO.pdf.
- U.S. Census Bureau. 2016 American Community Survey 1-Year Estimates. [Online] 2017. Accessed via http://factfinder.census.gov.
- Centers for Medicare and Medicaid Services (CMS). Total Effectuated Enrollment and Financial Assistance by State. U.S. Department of Health and Human Services. [Online] June 22, 2016. Accessed via https://data.cms.gov/Marketplace-Qualified-Health-Plan-QHP-/Total-Effectuated-Enrollment-and-Financial-Assista/v9jz-riug.


