Key Takeaways
- Between 2019 and 2021, Tennessee’s uninsured rate remained relatively stable and dropped for Hispanic and white Tennesseans.
- Men, Hispanics, younger adults, the unemployed, and people with less education and income are the most likely to be uninsured in Tennessee.
The U.S. Census Bureau released new data in September on income, poverty, education, and health insurance coverage in 2021. These metrics paint a picture of the social and economic circumstances across America.
Here’s what stands out from the 2021 estimates of health insurance coverage in Tennessee.
Background
In 2021, 90% of Tennesseans had health insurance — more than half of them through an employer (Figure 1). (1) Compared to 2019, more Tennesseans were covered by nearly every source of coverage except those provided by the military or to veterans (Figure 2). Other sources of coverage remained relatively stable. Different age groups also relied on each source of coverage to varying degrees (Figure 3). For historical trends going back to 2010, see A Deep Dive into Health Insurance Coverage in Tennessee.
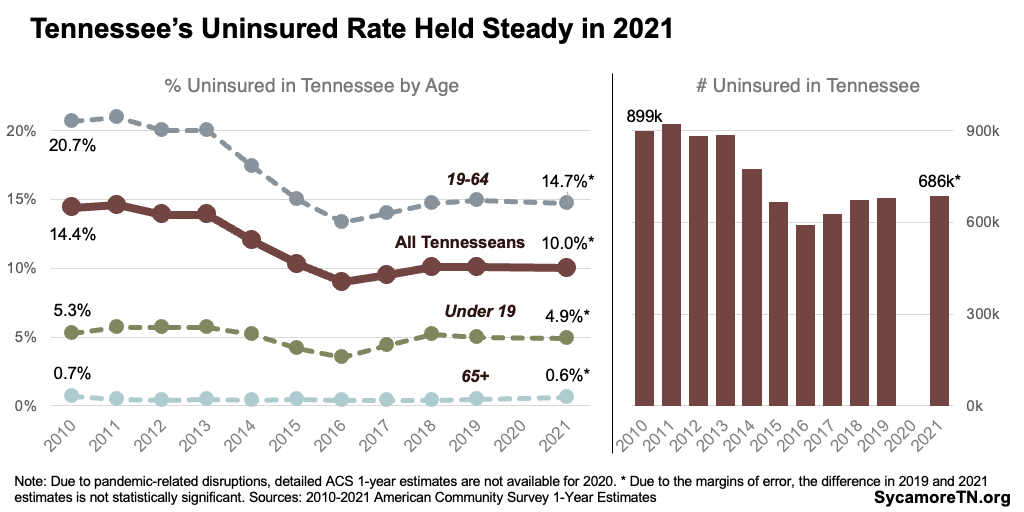
Tennessee’s uninsured rate held steady at 10.0% last year (Figure 4). (1) Around 686,000 Tennesseans were uninsured in 2021. This includes about 223,000 people who might become Medicaid-eligible if the state expands the program (ages 19–64 with household incomes under 138% of poverty) — although some may be ineligible due to their immigration status.† Small changes from the 2019 uninsured rate for different age groups were all within margins of error and not considered statistically significant.*
† People living in the U.S. without legal authorization (a.k.a. undocumented immigrants) are not eligible for Medicaid. Methods for estimating their share of the uninsured population vary, but one study estimated that as many as 29,000 uninsured adults in Tennessee under 138% of FPL would not qualify for Medicaid due to their immigration status.
* Due to the margins of error, the difference in some 2019 and 2021 estimates is not statistically significant.
Figure 1
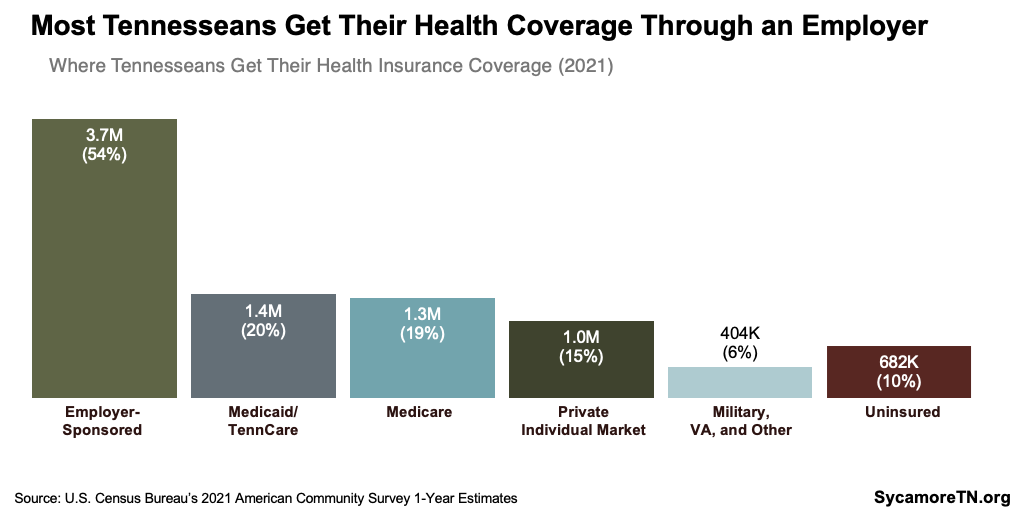
Figure 2
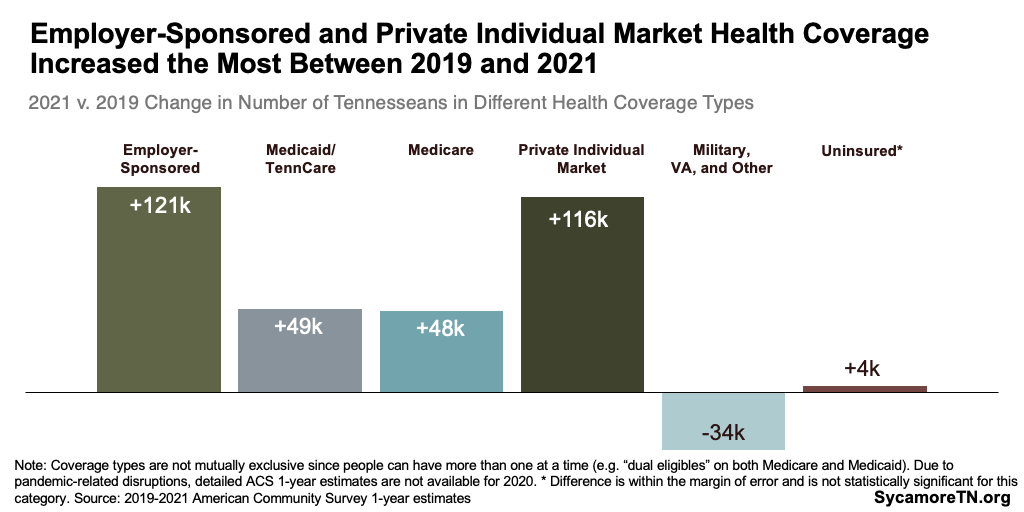
Figure 3
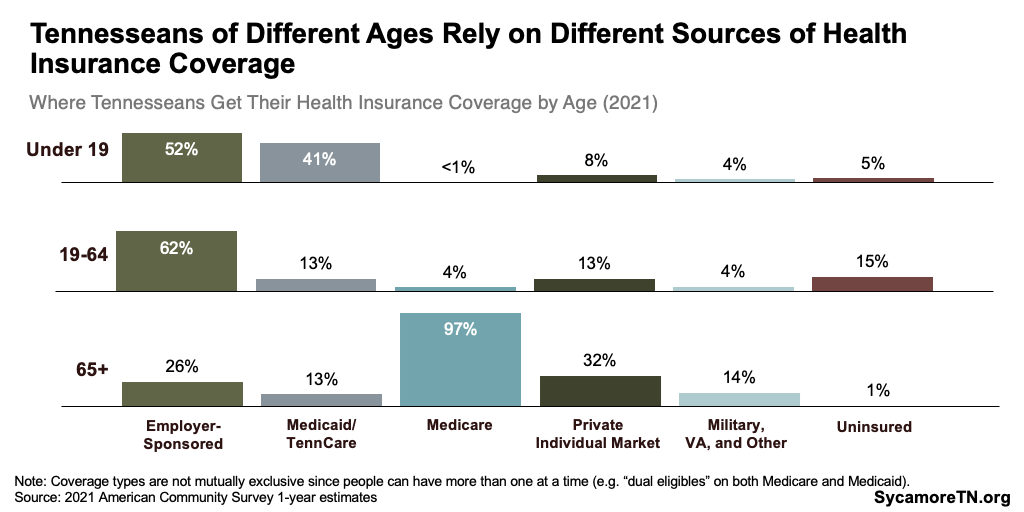
Figure 4
Demographic Variation
Some Tennesseans are more likely than others to be uninsured — including men, Hispanics, younger adults, the unemployed, and those with less education and income (Figures 5 and 6). (1) The highest uninsured rates in 2021 occurred among:
- Unemployed, working-age adults in the labor force — 36% vs. 15% for all working-age adults.
- Hispanic Tennesseans — 30% vs. 11% for black and 8% for white residents
- Tennesseans with less than a high school diploma — 24% vs. 11% for all adults age 25+
- People ages 19 to 34 — 17% vs. 10% for the population as a whole.
Differences in the uninsured rate by race and ethnicity narrowed over the last decade (Figure 7). (1) In 2021, the uninsured rate was 3.2 percentage points higher among black Tennesseans than whites — compared to 4.1 points in 2010. The Hispanic uninsured rate was 22.2 points higher than that of white residents – versus 28.3 in 2010.
Figure 5
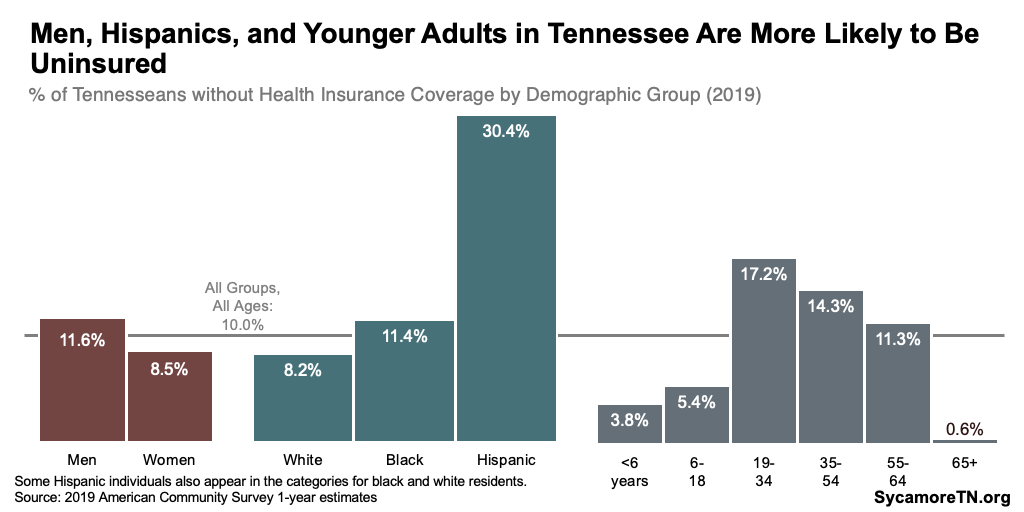
Figure 6
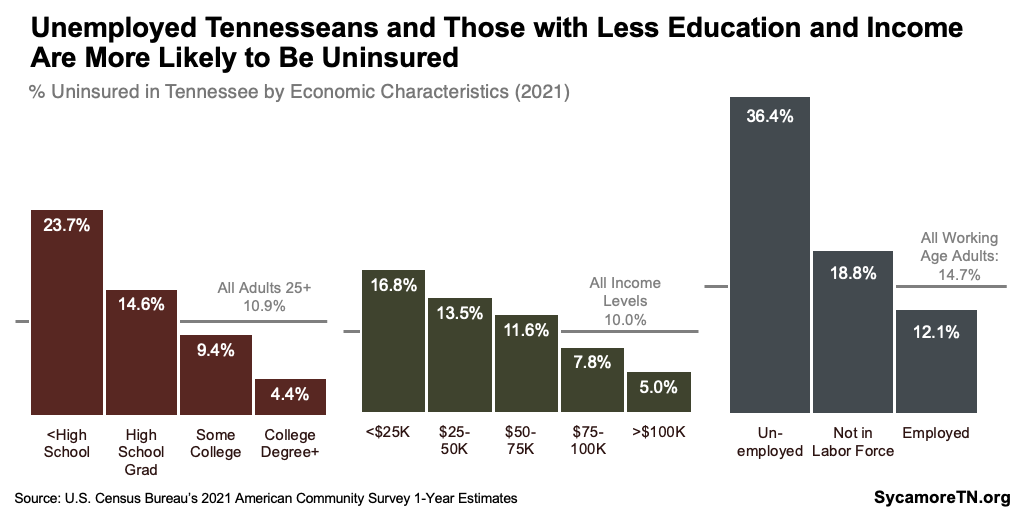
Figure 7
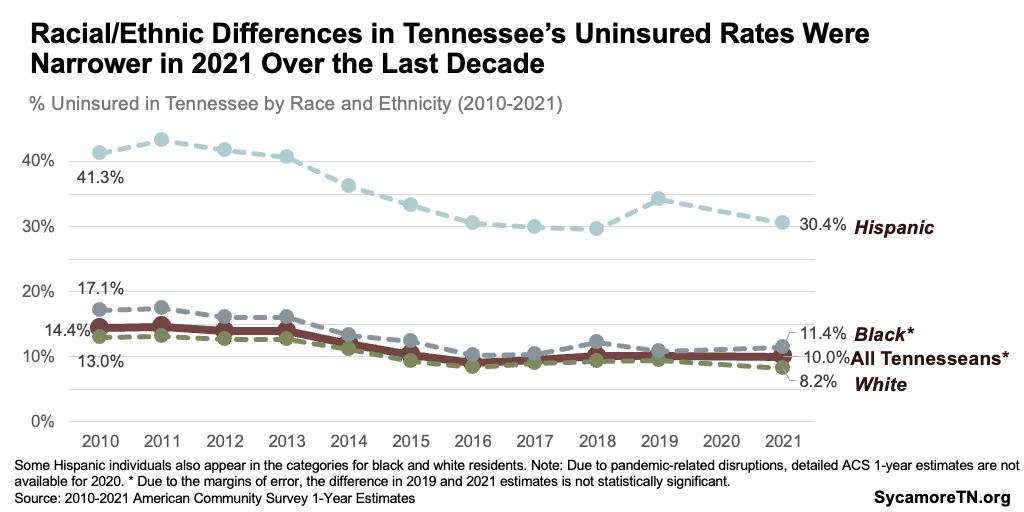
Figure 8
Geographic Variation
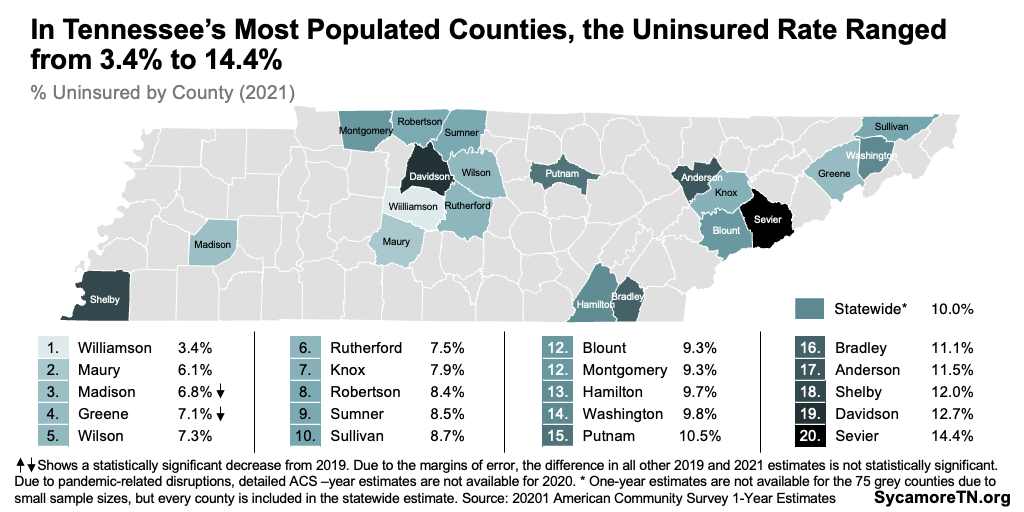
Uninsured rates in Tennessee also vary by geography. (1) The Census Bureau’s September data release includes 2021 estimates for counties with populations above 65,000. Among the 20 Tennessee counties with available data, the uninsured rate ranged from 3.4% in Williamson County to 15.4% in Sevier County (Figure 8). Due to margins of error, the difference in 2019 and 2021 values was statistically significant for only two of these counties – Greene and Madison. See Table A1 in the Appendix for additional county data.
Closing words
References
Click to Open/Close
- U.S. Census Bureau.2010-2021 American Community Survey 1-Year Estimates. [Online] September 2020. Available via https://data.census.gov/.