
New U.S. Census Bureau data show large differences in household income, poverty, education level, and health insurance status across Tennessee’s 95 counties — especially when we account for population density.
To explore the data for specific counties, use the interactive map and tool at the bottom of this post.
Key Takeaways
- On average, more densely-populated counties in Tennessee have higher incomes, less poverty, and lower uninsured rates.
- Counties in Middle Tennessee tend to have higher-than-average incomes, more educational attainment, and lower poverty rates.
Income & Poverty
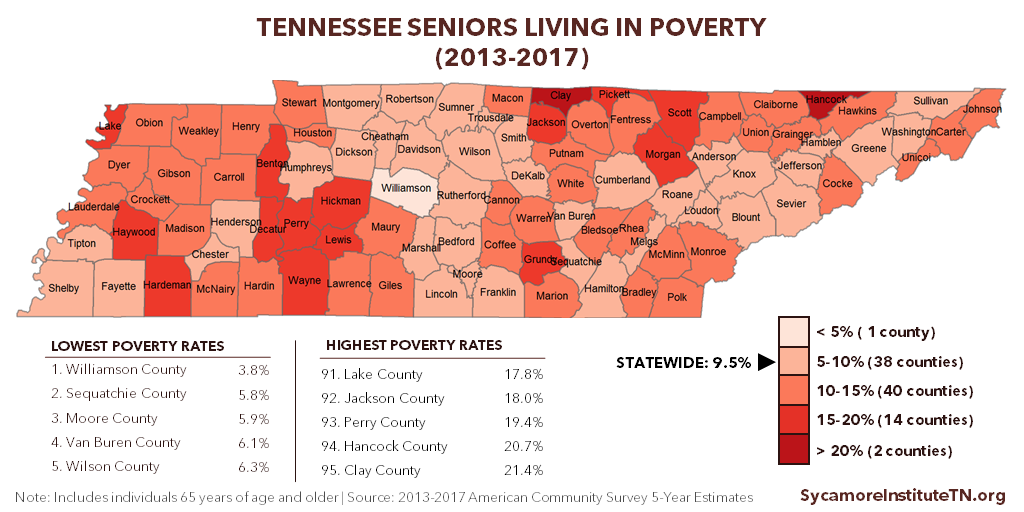
Income and poverty levels vary significantly across the state. For example, median income (where half of all incomes are higher and half are lower) was as high as $104,000 in Williamson County and as low as $30,000 in Hancock County (Figure 1). Many of the same counties with the lowest median incomes had the highest poverty rates (Figures 2, 3, and 4). Notably, nearly 1 in 4 Tennessee children live in poverty.
Rural, less densely-populated counties tend to have lower median incomes and higher poverty rates than average. This pattern exists across the state, from Lake County in the west to Grundy County in the middle and Johnson County in the east.
The 4 most urban, densely-populated counties have a mixed record on income and poverty. Davidson, Hamilton, and Knox Counties all have above-average median incomes. While Hamilton and Knox Counties also have less poverty than average, Davidson has above-average poverty. Shelby County has an average median income but higher-than-average poverty.
Figure 1
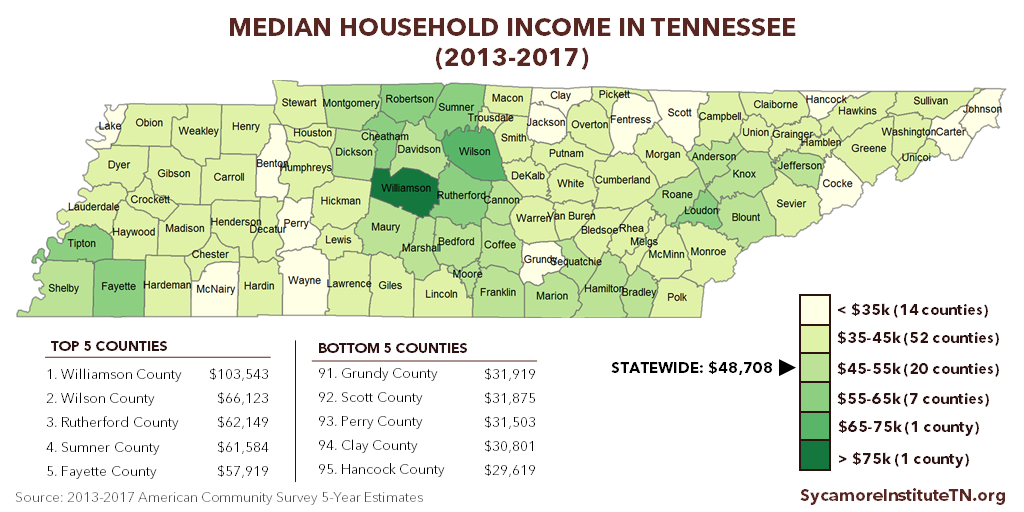
Figure 2

Figure 3
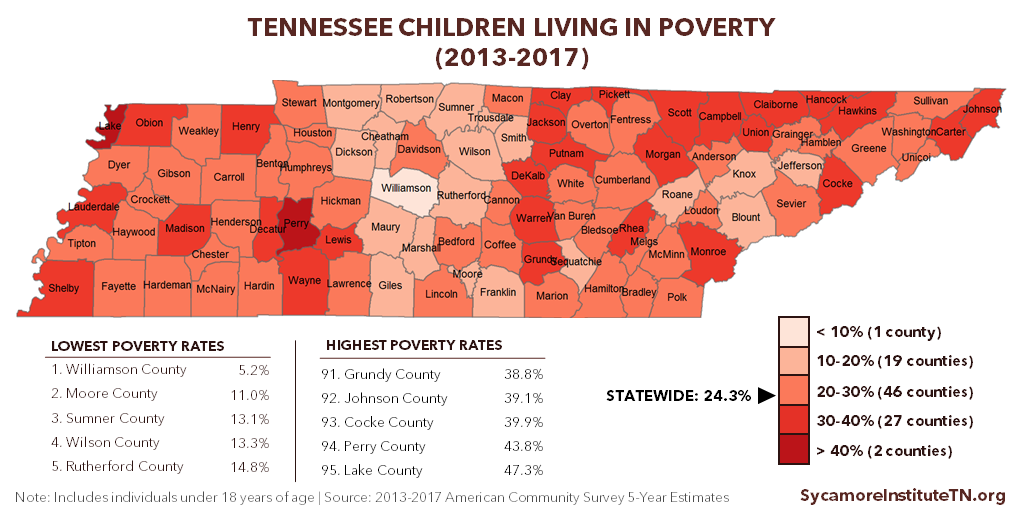
Figure 4
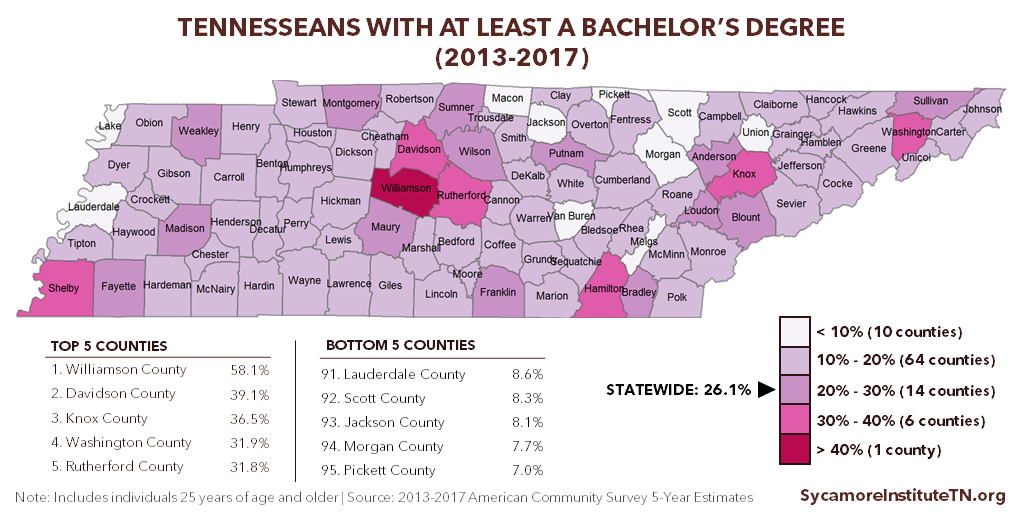
Level of Education
There is considerable variation in levels of education across Tennessee’s 95 counties. For example, about 64% of adults 25 and older in Williamson County had at least an associate’s degree compared with just 14% in Morgan County (Figure 5). In Williamson County, 58% had at least a bachelor’s degree compared with 7% in Pickett County (Figure 6).
The urban counties have higher-than-average rates of residents with at least an associate’s or bachelor’s degree. Williamson County stands out with the most educated population in the state. Hamblen and Sullivan Counties have relatively high population density but have lower-than-average rates of residents with at least an associate’s degree or more.
On average, less densely-populated counties have a smaller share of residents with post-secondary degrees. The 20 least densely-populated counties all have below-average rates of residents with an associate’s or bachelor’s degree.
Figure 5
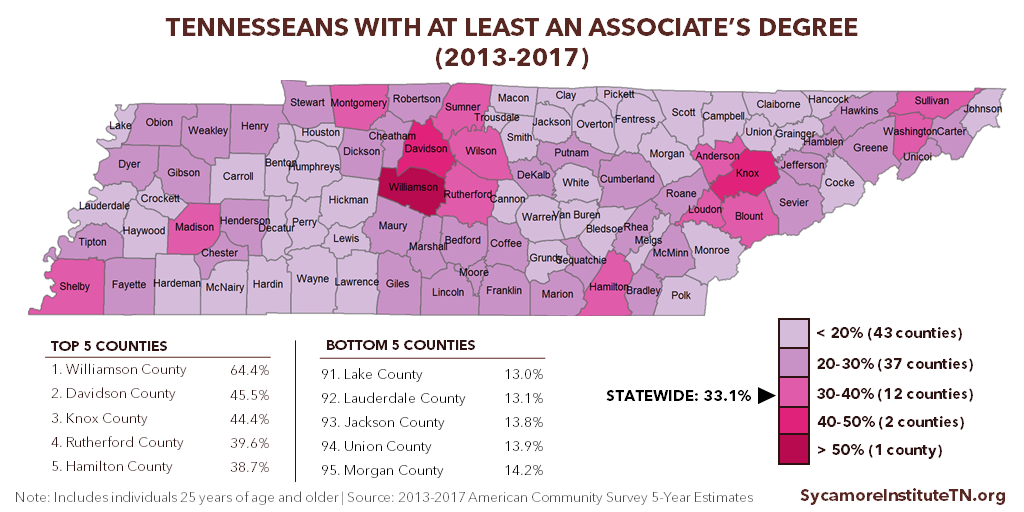
Figure 6
Uninsured Rates
Most counties had uninsured rates close to the statewide rate, but some counties had significantly higher rates. For example, 18.8% of people in Grundy County were uninsured — nearly twice the statewide rate of 10.9% (Figure 7). In Perry County, the rate of uninsured children was three times the statewide rate — 14.7% vs. 4.8% (Figure 8).
Three of the 10 most-densely populated counties — Davidson, Shelby, and Hamblen — had higher-than-average uninsured rates. The other 7 most densely-populated counties had below-average uninsured rates — with Williamson County having the state’s lowest rate at 5.3%.
Figure 7
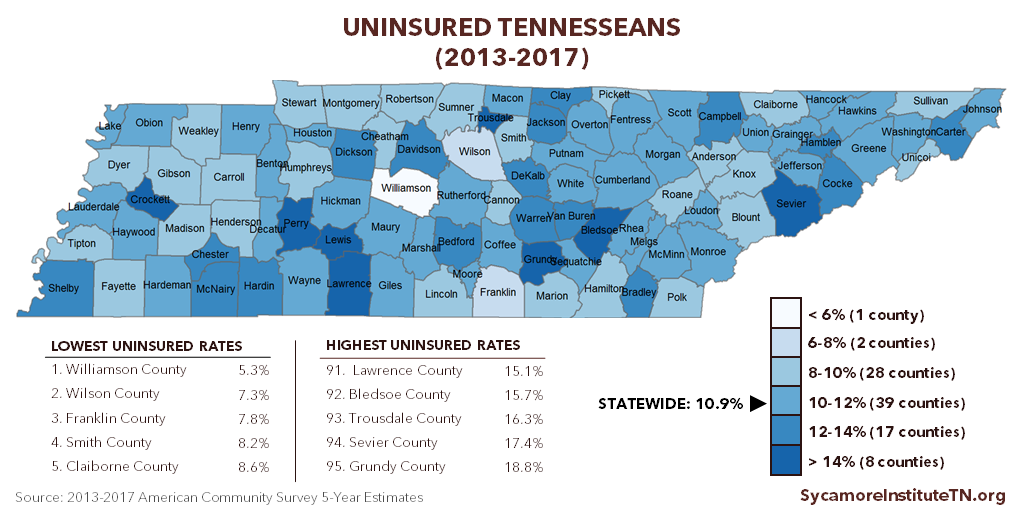
Figure 8
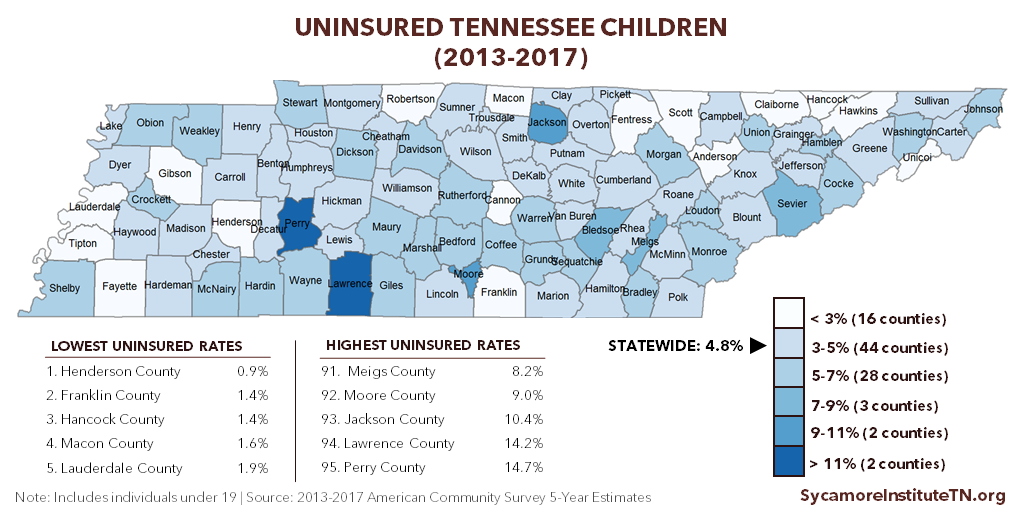
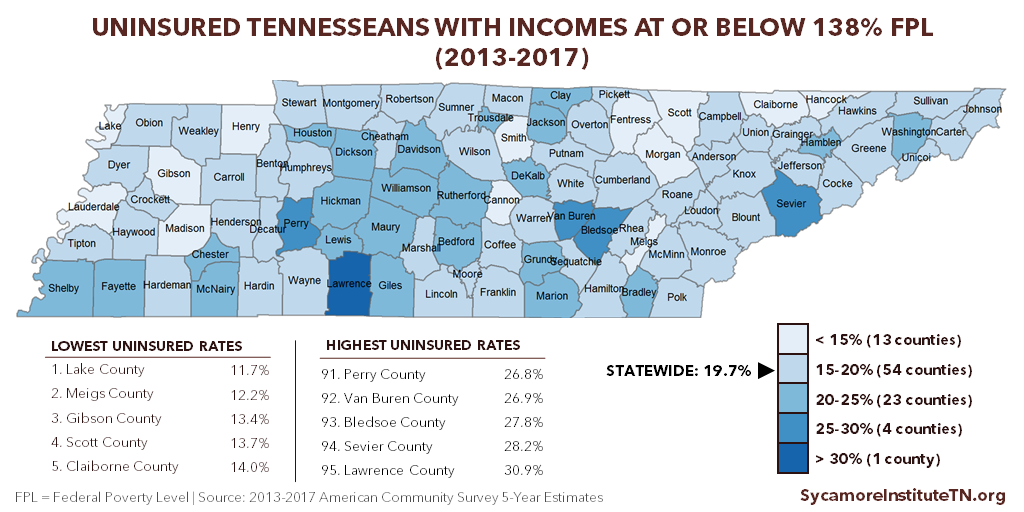
Figure 9
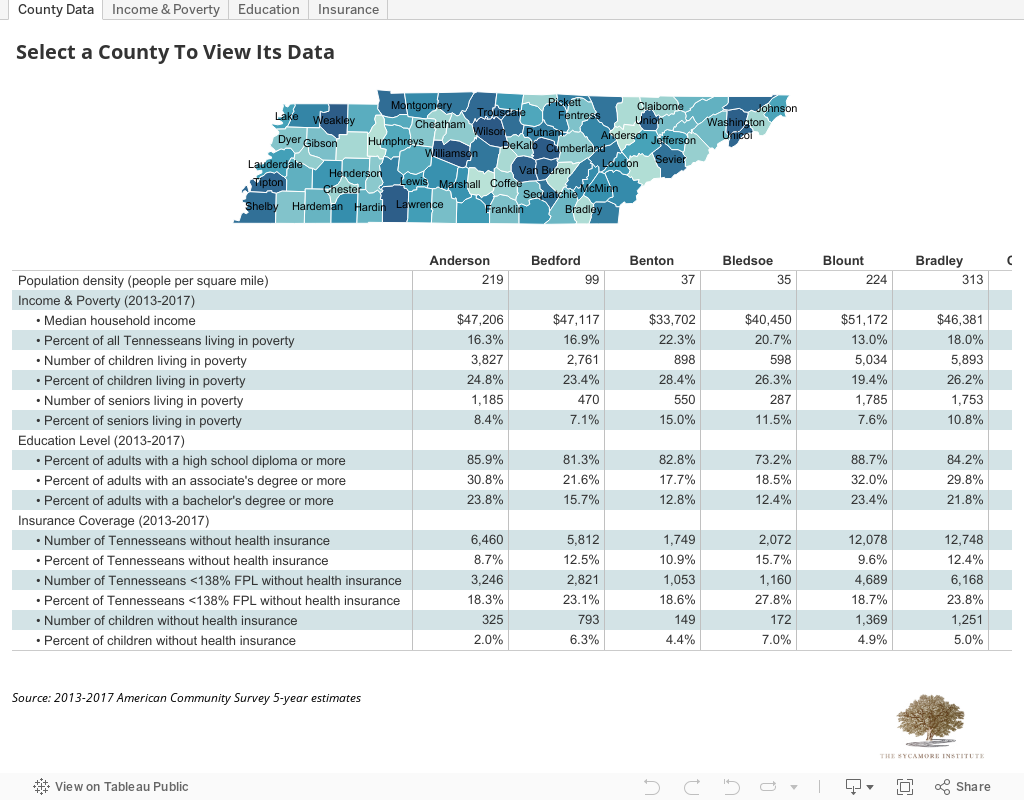
Explore the Data
To explore the data for specific counties, use this interactive map and tool.
About the Data
The 5-year average data shown here are based on the U.S. Census Bureau’s 2013-2017 American Community Survey 5-year estimates. While many metrics are often discussed in the context of a single year, the Census Bureau does not publish 1-year estimates for areas with small populations, which excludes many Tennessee counties. These multi-year estimates are more reliable than 1-year estimates and provide comparable data for all counties in Tennessee. (2)
Table 1: Incomes Associated with 2017 Federal Poverty Percentages
| % Federal Poverty Level (FPL | Single | Family of 4 |
|---|---|---|
| 138% | $16,643 | $33,948 |
| Source: U.S. Department of Health and Human Services (3) | ||
References
Click to Open/Close
- U.S. Census Bureau. 2013-2017 American Community Survey 5-year estimates. [Online] 2018. Accessed on December 7, 2018 via https://factfinder.census.gov/faces/nav/jsf/pages/index.xhtml.
- —. When to Use 1-year, 3-year, or 5-year Estimates. American Community Survey, Guidance for Data Users. [Online] 2018. [Accessed on December 10, 2018 via https://www.census.gov/programs-surveys/acs/guidance/estimates.html.
- U.S. Department of Health and Human Services (HHS). 2017 Poverty Guidelines. [Online] January 31, 2017. https://aspe.hhs.gov/2017-poverty-guidelines.


