The unemployment rate tells us about the share of people who do not have a job. Unemployment represents untapped potential for people to earn a living by producing goods and services. Lack of a job often negatively affects incomes, spending, savings, and well-being — both at the individual and family levels and across the economy. As a result, unemployment is one of the most common metrics used to describe the health of our economy and labor market, while many state and local economic development efforts focus on reducing it. (1) (2)
Key Takeaways
- The unemployment rate measures the percent of the labor force without a job. It is one of the most common metrics used to describe the economy and labor market.
- Tennessee’s unemployment levels reached historic lows in 2019 and were better than the national average.
- The unemployment rate can serve as a proxy for general economic conditions.
- It does not, however, tell us about the size, productivity, or participation of Tennessee’s potential pool of workers and can obscure disparities between groups within an area.
This is part of our series on the pros and cons of five common ways to measure prosperity and economic growth in Tennessee.
What is the Unemployment Rate?
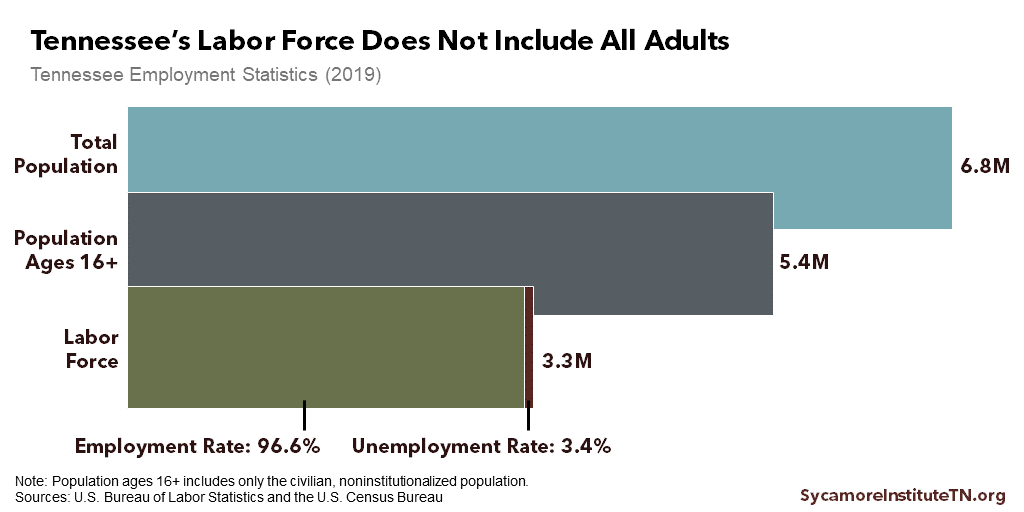
The unemployment rate measures the percent of the labor force without a job. The U.S. Bureau of Labor Statistics considers a person unemployed if they do not have a job but are available to work and have been actively looking for work in the prior four weeks. The labor force includes both those who are considered unemployed and individuals who are already working. (5)
Figure 1

Unemployment in Tennessee
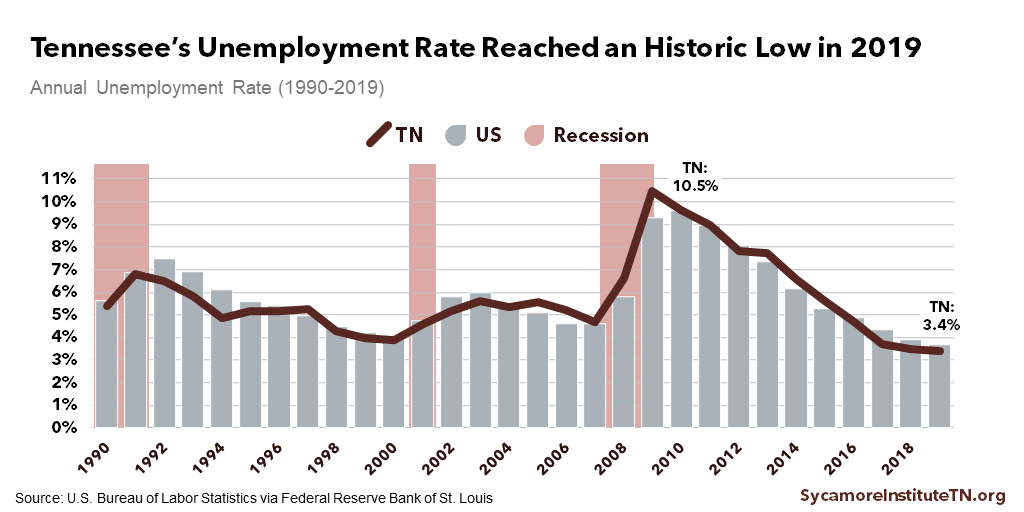
Tennessee’s unemployment levels reached historic lows in 2019 and were better than the national average (Figure 1). As of February 2020, Tennessee’s seasonally-adjusted unemployment rate was 3.4% — the 24th lowest in the country. (6) In 2019, Tennessee’s unemployment rate was 3.4% — the state’s lowest annual unemployment rate in history. Figure 2 displays how the unemployment rate relates to the state’s labor force and the broader population.
During the Great Recession, Tennessee’s unemployment rate reached a high of 10.5% — the highest annual unemployment rate over the last 3 decades and the 3rd highest annual unemployment rate since 1976.
Figure 2

Trade-Offs of Using Unemployment to Measure Prosperity
Advantages of the Measure
The unemployment rate offers several advantages for tracking and describing the economy.
- The unemployment rate can serve as a proxy for general economic conditions. Historically, the unemployment rate correlates with overall economic growth — when unemployment is low, economic output is generally higher. Trends in the official unemployment rate also track closely with more comprehensive measures of the labor market, such as labor force participation, wages, and hours worked. (2)(9)
- The rate provides a standardized way to track changes in the economy over time across geographic areas. Data are collected and reported every month at the national, state, and county levels.
Limitations of the Measure
The unemployment rate also has several characteristics that prevent it from offering a comprehensive picture of Tennessee’s potential pool of workers. (10)
- The unemployment rate does not account for everyone in Tennessee’s labor market. “Discouraged” workers who leave the labor force after long periods without a job do not count as unemployed.
- It does not explain the “why” behind people’s employment situations. The unemployment rate does not differentiate between employed and “underemployed” workers — e.g. people with part-time or temporary jobs who want more hours or a permanent job. Nor does it capture the reasons people are not working, how long they have been unemployed, or why part-time workers are not working full-time.
- Monthly unemployment rates do not provide information about differences across demographic groups within an area. Like all population-level metrics, topline figures can obscure disparities.
- Unemployment may fall even when the economy is not improving. For example, if more workers become discouraged and stop looking for work, the unemployment rate will drop even if there is no increase in people working.
- The unemployment rate does not measure the quality or adequacy of employment. The metric does not capture average wages, amount of hours worked, or the presence or absence of benefits.
References
Click to Open/Close
- Scott, Katherine, Stiles, Jeremy and Avery, Sally. Economic Development, Education, and Health in Tennessee. Center for Economic Research in Tennessee, Tennessee Department of Economic and Community Development. [Online] January 23, 2017. Accessed via https://www.tnecd.com/files/459/economic-development-education-and-health_01-23-2017-2-.pdf.
- Dvorkin, Maximiliano. Assessing the Health of the Labor Market: The Unemployment Rate vs. Other Indicators. Federal Reserve Bank of St. Louis. [Online] January 2015. https://www.stlouisfed.org/publications/regional-economist/january-2015/labor-market-health.
- U.S. Bureau of Labor Statistics (BLS). Unemployment Rate in Tennessee [TNUR]. [Online] [Cited: April 3, 2020.] Retrieved from FRED, Federal Reserve Bank of St. Louis via https://fred.stlouisfed.org/series/TNUR.
- —. Civilian Unemployment Rate [UNRATE]. [Online] [Cited: April 3, 2020.] Retrieved from FRED, Federal Reserve Bank of St. Louis via https://fred.stlouisfed.org/series/UNRATE.
- —. How the Government Measures Unemployment. [Online] October 8, 2015. https://www.bls.gov/cps/cps_htgm.htm.
- —. Local Area Unemployment Statistics: Unemployment Rates for States, Seasonally-Adjusted (February 2020). [Online] March 27, 2020. [Cited: April 3, 2020.] https://www.bls.gov/web/laus/laumstrk.htm.
- U.S. Bureau of Labor Statistics. Local Area Unemployment Statistics. [Online] [Cited: April 3, 2020.] Accessed via https://data.bls.gov/pdq/SurveyOutputServlet.
- U.S. Census Bureau. Population Estimates, July 1, 2019. [Online] [Cited: April 3, 2020.] Accessed from https://www.census.gov/quickfacts/TN.
- Guisinger, Amy Y., et al. A State-Level Analysis of Okun’s Law. Federal Reserve Bank of St. Louis. [Online] October 2017. https://s3.amazonaws.com/real.stlouisfed.org/wp/2015/2015-029.pdf.
- Desilver, Drew. What the Unemployment Rate Does – and Doesn’t – Say About The Economy. Pew Research Center. [Online] March 7, 2017. http://www.pewresearch.org/fact-tank/2017/03/07/employment-vs-unemployment-different-stories-from-the-jobs-numbers/.


