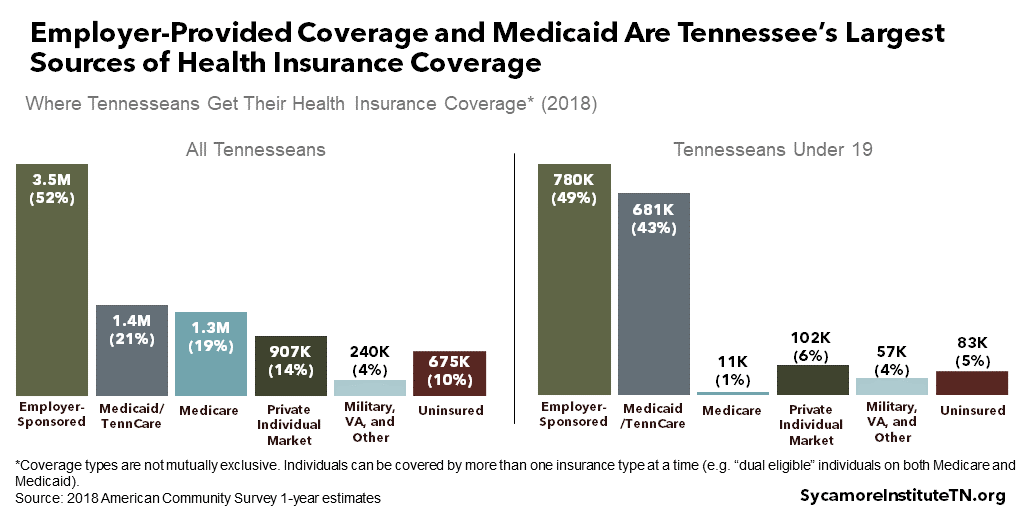
Currently, about 1.4 million Tennesseans statewide get health insurance coverage through TennCare. (1) (2) In fact, the state’s Medicaid program is one of Tennesseans’ largest sources of insurance coverage — second only to employer-provided plans in 2018 (Figure 1). The program primarily covers low-income children, individuals with disabilities, pregnant women, and caretakers of children.
Children in Tennessee are particularly reliant on TennCare. As of September 2019, the program covered nearly 790,000 children — comprising over half the program’s enrollees and nearly 47% of the state’s children. (2) (3)
Figure 1
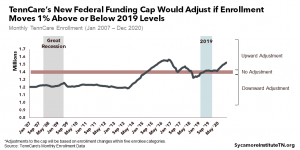
Big changes may be in store for TennCare if proposals for a block grant or a work requirement go into effect. These changes may be felt differently across the state depending on how many people are enrolled in the program.
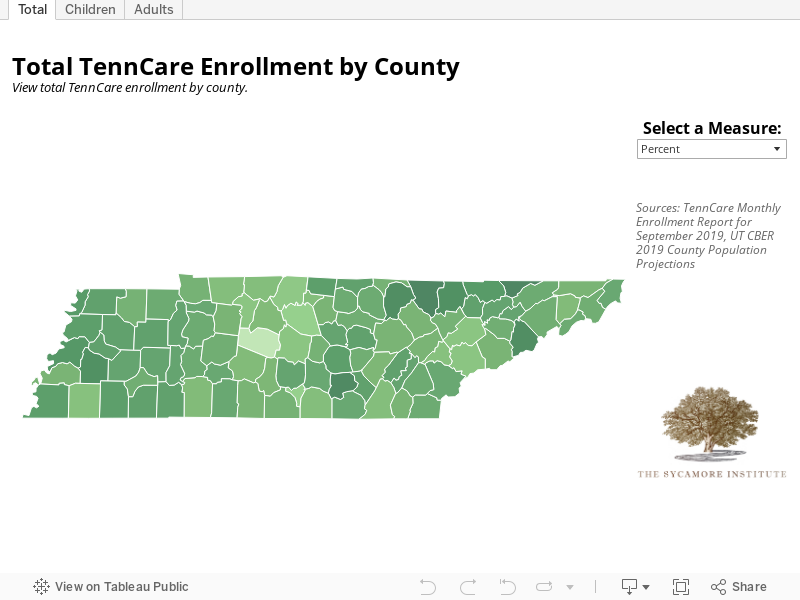
The state’s most populous areas have the largest TennCare rolls, but its more rural areas have the greatest share of the local population enrolled. For example, as of September 2019, Shelby County has more enrollees than any other county — 145,000 children and 106,000 adults. However, Grundy, Hancock, Lake, and Scott counties are the most reliant as a percent of the population. TennCare enrollees account for: (2) (3)
- An estimated 34% of all individuals in Scott and Hancock Counties.
- About 80% of all children in Lake County.
- Approximately 23% of all adults in Grundy, Hancock, and Scott Counties.
Use the data tool below to explore further how TennCare enrollment varies across the state.
References
Click to Open/Close
- U.S. Census Bureau. American Community Survey 1-Year Estimates . [Online] September 2019. [Cited: November 5, 2019.] Accessed via http://www.data.census.gov.
- TennCare. September 2019 Enrollment Data. [Online] October 2019. [Cited: November 5, 2019.] Accessed from https://www.tn.gov/tenncare/information-statistics/enrollment-data.html.
- UT Center for Business and Economic Research. 2018-2070 State Population Projections. [Online] November 1, 2019. [Cited: November 5, 2019.] Accessed via tndata.utk.edu/sdcpopulationprojections.htm.