Personal and household income metrics tell us about the earnings of individuals and families. Income can be saved or used to buy goods and services, each of which affects the well-being of individual households and our economy as a whole. Two of the most common ways to measure the income of a population are median household income and per capita personal income.
Key Takeaways
- Household income and personal income gauge the resources that Tennesseans have from wages and some (but not all) other sources of income.
- Measures of Tennesseans’ income reached historic highs in 2018 but remained below the national average.
- Both metrics provide important information about many of the financial resources available to most Tennessee families, but topline figures can obscure disparities between groups.
- Neither measure is a comprehensive assessment of economic well-being because they do not account for wealth or some types of earnings and public assistance.
This is part of our series on the pros and cons of five common ways to measure prosperity and economic growth in Tennessee.
What are Personal and Household Income?
Measurements of household and personal income gauge the resources that Tennesseans gain from various sources of income. Median household income and personal income per capita include wages and other sources of income like dividends and interest, pensions, rental income, and monetary public benefits (e.g. unemployment insurance or Social Security).
Household income measures all the income from individuals age 15 and older living together. A region’s median household income is the amount at which half of all households in that area earn more and half earn less. Households are defined as a single address. Median household income can provide useful insight into the level and distribution of personal income within an economy.
Personal income per capita measures the combined income of every resident in a particular geographical area divided by the population. (4) This metric can provide useful insight into the level of resources available to private citizens within an economy.
Personal and Household Income in Tennessee
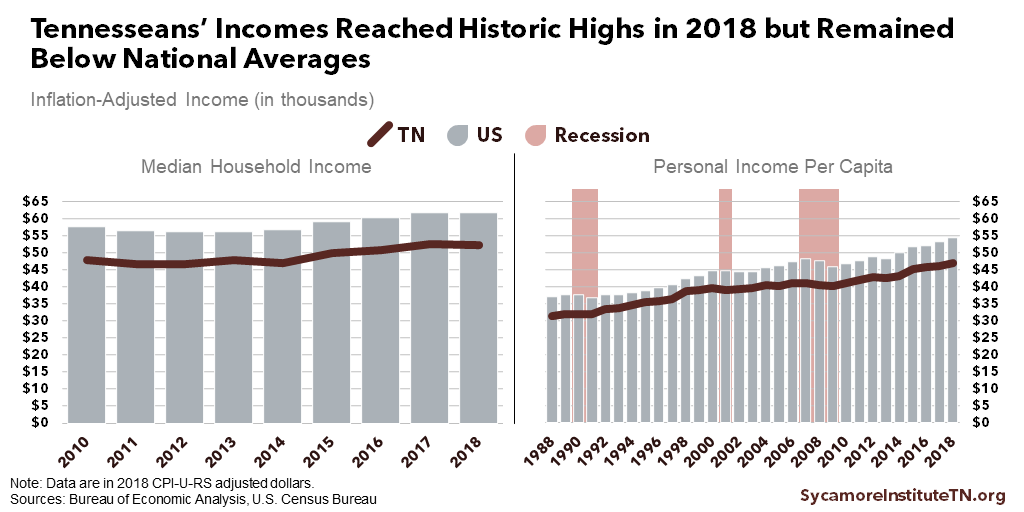
Median household income and personal income per capita are both at historic highs but remain lower than the national average (Figure 1). Each measure tells a different story about Tennessee’s progress in narrowing that gap. Both measures have been adjusted for inflation, which takes into account price increases and allows for apples-to-apples comparisons of the value of money over time.
- Tennessee’s median household income was $52,375 in 2018 — 15% lower than the national figure of $61,937. Both were at or near historic highs. Our state’s median household income grew faster than average in recent years after adjusting for inflation — narrowing the state’s gap between Tennessee and the country as a whole from a 17% deficit in 2010. Since 2010, Tennessee’s median household income has grown by an average of 1.1% each year compared with 0.9% nationally. (1) (3)
- Tennessee’s personal income per capita was $46,900 in 2018 — 14% lower than the national figure of $54,446. That gap between Tennessee and the U.S. overall has grown since the end of the Great Recession when it was 12%. Since 2009, Tennessee’s personal income per capita has grown by an average of 1.7% each year compared with 1.9% nationally. (2) (3)
Figure 1
Trade-Offs of Using Income to Measure Prosperity
Advantages of the Measure
Income measures are useful for tracking and describing changes in the amount and distribution of earnings within an economy.
- Personal and household income metrics provide important information about some of the financial resources available to Tennessee families. The data for both are collected annually at different geographic (national, state, county) and demographic (age, sex, race/ethnicity, education) levels.
- While topline figures can obscure disparities between groups, the underlying data provide a standardized way to compare progress over time and across areas, populations, and demographics. Personal income per capita accounts for population size and is useful for comparing incomes across geographic areas. Median household income is a good barometer of income distribution and ‘typical” household income because (unlike a statistical average) it is not skewed by outliers — small numbers of households with extremely high or low incomes.
Limitations of the Measure
Income measures also have characteristics that prevent them from offering a comprehensive picture of the economic well-being of individuals, households, and communities. (5) (6) (4) (7)
- Personal and household income measures exclude some types of earnings and public assistance and do not account for wealth.
- These metrics include cash benefits but not non-cash benefits like food stamps, subsidized housing, health insurance, and tax credits. As a result, they may underestimate the resources available to low-income households.
- They also exclude income from capital gains, which make up a larger share of total earnings for people with high incomes. As a result, they may underestimate the resources of high-income households.
- Since they gauge only the inflow of resources and not existing resources like savings and assets, they may not account for the ways in which wealth affects longer-term economic security and well-being.
- Median household income data is usually self-reported through surveys, and people often underreport their income.
- Various agencies count income differently, which makes it hard to compare income estimates from multiple sources. For example, the Census Bureau, Internal Revenue Service, and the Bureau of Economic Analysis all count income in slightly different ways.
- Median household income does not account for household size, so two households with equal incomes may not have the same economic status. The average household size has also decreased over time, and most historical comparisons do not account for this change.
- Personal income per capita may be skewed by outliers with extremely high or low incomes.
- Personal income per capita also has several unique limitations due to its reliance on population estimates. For example:
- Institutional populations (i.e. prisons, colleges, or nursing homes) are counted in population estimates but often have very little income. Areas with large institutional populations tend to have lower per capita personal incomes that do not reflect the economic well-being of local non-institutional residents.(4)
- Children are also included in population estimates but generally do not have income. Areas with large families or younger populations may have lower per capita incomes but do not necessarily have worse economic well-being.
References
Click to Open/Close
- U.S. Census Bureau. Income in the Past 12 Months (S1901). American Community Survey 1-Year Estimates. [Online] September 2019. [Cited: October 25, 2019.] Accessed via http://www.data.census.gov.
- U.S. Bureau of Economic Analysis (BEA). Per Capital Personal Income (Dollars). [Online] September 24, 2019. [Cited: October 25, 2019.] Accessed via https://apps.bea.gov/itable/index.cfm.
- U.S. Bureau of Labor Statistics (BLS). Updated CPI-U-RS Data, All Items, 1977-2018. [Online] October 16, 2019. [Cited: October 25, 2019.] Accessed via https://www.bls.gov/cpi/research-series/home.htm#CPI-U-RS%20Data.
- U.S. Bureau of Economic Analysis (BEA). Local Area Personal Income and Employment Methodology. [Online] November 2017. https://www.bea.gov/sites/default/files/methodologies/lapi2016.pdf.
- U.S. Census Bureau. Income : About. [Online] February 29, 2016. [Cited: November 1, 2019.] https://www.census.gov/topics/income-poverty/income/about.html.
- Congressional Budget Office (CBO). The Distribution of Household Income and Federal Taxes, 2013. [Online] June 2016. https://www.cbo.gov/sites/default/files/114th-congress-2015-2016/reports/51361-householdincomefedtaxes.pdf.
- Donovan, Sarah A, Labonte, Marc and Dalaker, Joseph. The U.S. Income Distribution: Trends and Issues. Congressional Research Service. [Online] December 8, 2016. [Cited: August 21, 2018.] https://fas.org/sgp/crs/misc/R44705.pdf.