Public policy at every level affects the opportunities and environments that influence Tennesseans’ health and prosperity. This report discusses the role of local governments in Tennessee and some of the ways state-level policy shapes their decisions. It is the first of many reports that will explore different aspects of the relationship between state and local government in Tennessee.
Key Takeaways
- County and municipal governments operate much of the public infrastructure that most directly affects Tennesseans’ daily lives, health, and prosperity.
- From a legal standpoint, local governments are an extension of the state government. As a result, state policy shapes the options, decisions, and priorities of Tennessee’s local governments. For example:
- State law creates the framework for what local governments do and how.
- State law limits how local governments can raise money.
- About one-fifth of local government funding comes directly from the state.
- State policy can indirectly shape local governments’ opportunities and challenges.
- The state monitors local governments’ finances.
- Tennessee has 95 counties, over 300 municipalities, and more than 400 special districts authorized by the state to raise revenue and/or provide services.
Local Policy Affects Health and Prosperity
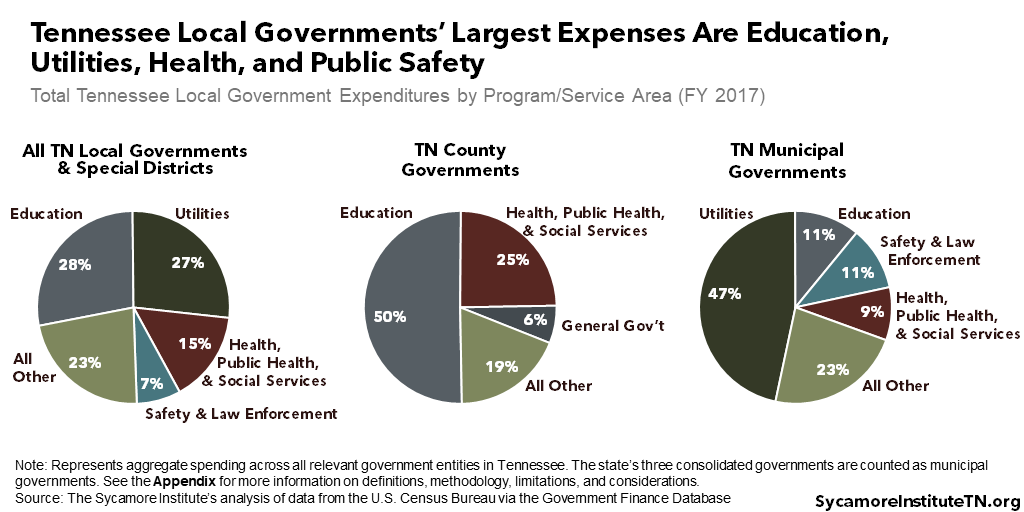
Local governments operate much of the public infrastructure that most directly affects Tennesseans’ daily lives, health, and prosperity. The programs, services, and policies of counties, municipalities, and other local entities play a role in whether or not people and communities thrive. For example, local governments in Tennessee spent nearly 80% of their FY 2017 budgets to educate children, provide utilities like water and electricity, and look after residents’ health and safety (Figure 1). (1) The remaining funds go to things like road construction and maintenance, parks and playgrounds, libraries, and protecting natural resources.
Figure 1
5 Ways State Policy Shapes Local Governance in Tennessee
From a legal standpoint, local governments are an extension of the state government. In fact, with few exceptions, local governments only have the powers given to them by state governments — a concept known as “Dillon’s Rule” that the U.S. and state supreme courts have upheld multiple times. (2) (3) (4)
As a result, state policy shapes the options, decisions, and priorities of Tennessee’s local governments. Our urban, suburban, and rural areas face many of the same issues but have unique local contexts. Here are five ways state policy can affect the ability of local governments to tackle challenges and exploit opportunities.
1. State law creates the framework for what local governments do and how.
State law specifies how locals govern themselves and the types of services they provide. For example, Tennessee code explicitly defines the services that county governments must and may provide (Table 1). (5) State law also establishes the rules for creating a city charter, the document that spells out a municipal government’s specific functions and services. Except for in 14 cities with home rule, amending a charter requires the state legislature’s approval. (6)
The state can also prevent local governments from adopting certain policies. For example, state law restricts locals from broadly regulating tobacco use, firearms, or disposable food containers (e.g. plastic bags, cups). (7) (8) (9) Any exemptions from these types of restrictions require a new state law.
2. State law limits how local governments can raise money.
Tennessee gives local governments the authority to collect revenue, but only in specific ways. Our state constitution gives the General Assembly the power to create and define the revenue levers available to county and municipal governments. (12)
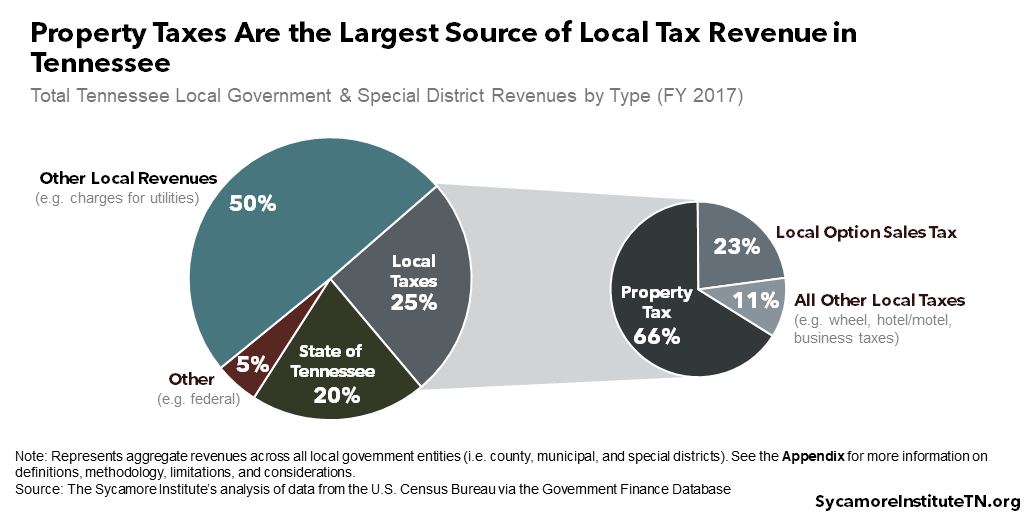
Property taxes and local sales taxes are the largest of these local revenue sources. In FY 2017, for example, about 66% of all local government and special districts’ own tax revenues came from property taxes and 23% came from the local option sales tax (Figure 2). (1)
Table 1
Tennessee State Law Mandates the Services County Governments Offer
Tennessee State Law Mandates the Services County Governments Offer
County Services | County Services |
|---|---|
Figure 2
Property Tax — The state constitution lays out broad parameters for how local governments can tax property. While there are no limits on property tax rates or amounts, local governments do have to follow certain rules to administer the tax. For example, the state constitution dictates that property taxes apply to 40% of the value of industrial and commercial properties and 25% of the value of residential and farm properties. (12)
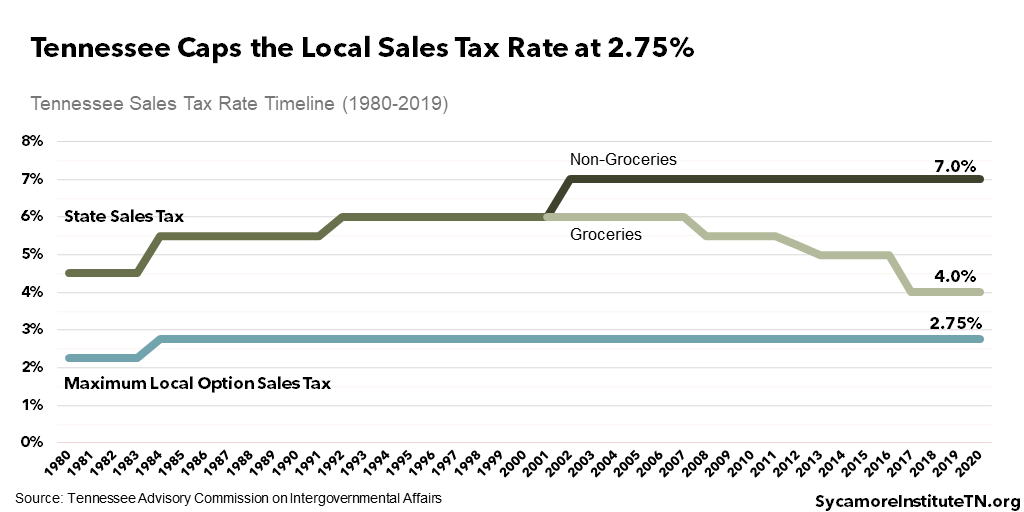
Sales Tax — State law allows local governments to levy their own sales tax of up to 2.75% on top of the state’s 4% tax on food and 7% tax on other items (Figure 3). The current maximum local sales tax rate took effect in 1984. (13) As of July 1, 2019, 50 counties levied the maximum 2.75%, as did another 31 municipalities in counties with lower rates. (14)
Tennessee also sets other parameters for local sales tax. For example, state law defines what items are taxed (i.e. the sales tax base) and any exemptions. (15) Local sales taxes only apply to the first $1,600 of any single item, and local voters must approve local rate increases. (16) (17)
Figure 3
3. About one-fifth of local government funding comes directly from the state.
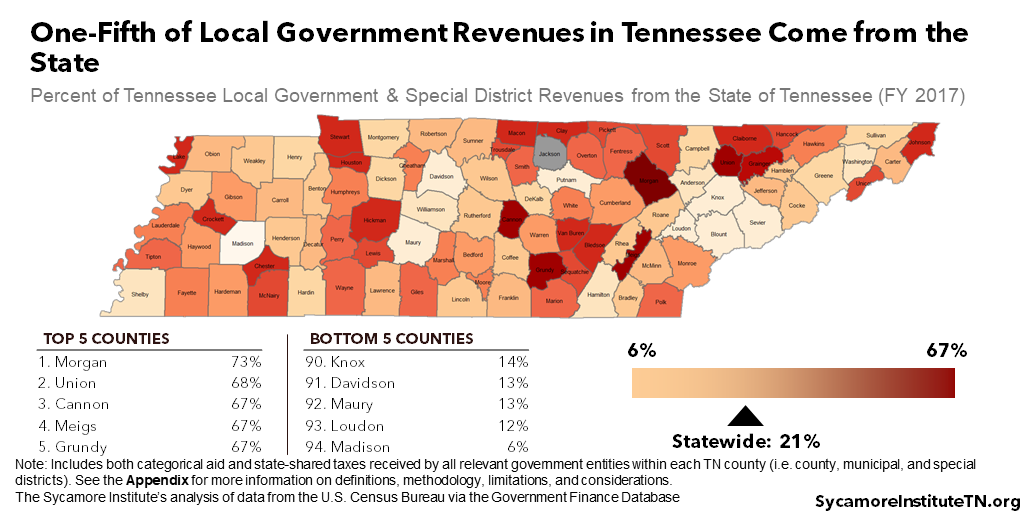
Revenues provided by the state account for a significant portion of local government budgets in Tennessee. These revenues include both categorical aid and state tax collections shared with cities and counties. In total, Tennessee’s local governments and special districts got about 21% of their combined revenues from the state in FY 2017. Within each county, state funding to all local government and special districts combined ranged from 6% of total revenues in Madison County to 67% in Grundy (Figure 4). (1)
Figure 4
State Aid
State categorical aid includes grants, contracts, and reimbursements targeted for specific purposes. Local governments receive state categorical aid for things like education, public health, and housing state prisoners in local jails. In FY 2018, the state distributed $4.9 billion for local K-12 education, which accounted for 48% of education spending by Tennessee’s 136 local school districts. (10)
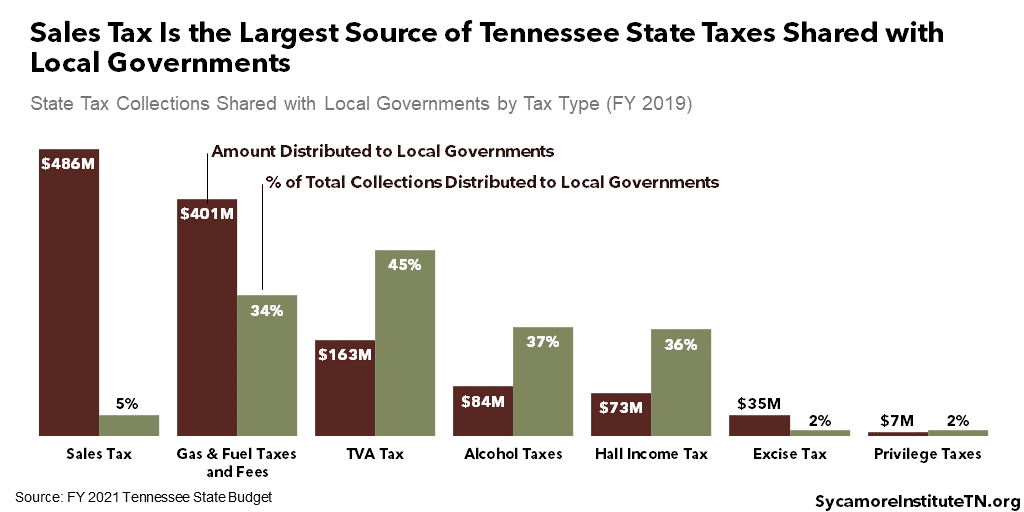
State-Shared Taxes
Tennessee shares a portion of many state taxes with local governments. In FY 2019, the state shared over $1.2 billion (or 8%) of its tax collections with local governments. The largest were $486 million of state sales tax collections and $401 million in gas and fuel taxes (Figure 5). (11)
Each individual tax is divvied up among local governments in different ways. For example, of the state’s $0.26/gallon gas tax, about 62% goes to the state budget, while 25% goes to counties and 13% to cities for road construction and maintenance. Each city or town’s share of that money depends on its population. Counties split half of their allocation equally, while the state distributes the other half based on each county’s population and land area. (11) The state laws that create each tax spell out the distribution of its revenues.
Figure 5
4. State policy can indirectly shape local governments’ opportunities and challenges
State policies not directly related to local government can still affect local policymakers’ priorities, opportunities, and challenges. Two examples:
- Criminal Justice — The state decides criminal law, but state and local governments share the responsibility of housing people convicted of violating those laws. As incarceration rates have risen in recent years, Tennessee has increasingly relied on local jails to house felony offenders as a way to manage overcrowding in state facilities. While the state reimburses local jails for housing these inmates, those funds may not fully cover every county’s costs. Any shortfall or surplus could affect local budget priorities.
- Economic Development — The state’s economic development spending in a community may help that area grow and prosper. Downstream effects like more workers, higher incomes, population growth, and increased property values may affect both the demand for local services and the resources available to fund those services. Locals may also decide to shift limited resources from other priorities to activities that bring in state funds.
State law requires local governments to maintain their spending in certain areas in order to receive state funds. “Maintenance of effort” rules require that local governments sustain their funding from one year to the next for education, law enforcement, roads and infrastructure, public libraries, and election commissions. Locals who don’t meet these requirements risk losing state funds. (18) (19) (20) These requirements are meant to keep locals from cutting their own investments when state funding grows. They can also affect the incentives behind local government spending decisions.
5. The state monitors local governments’ finances.
Tennessee’s state government has broad authority to monitor local budgets. In fact, Tennessee has one of nation’s most robust state systems for monitoring local finance, according to a 2016 analysis. (21) For example, the state’s comptroller reviews local budgets and financial statements, conducts audits, and — in extraordinary circumstances — can dictate corrective actions to ensure local financial stability. (22) (23) (24) (25) (26) (27) (28) (29)
Local Governments in Tennessee
Tennessee has 95 counties, over 300 municipalities, and more than 400 special districts authorized by the state government to raise revenue and/or provide services.
County Governments
Counties have been described as Tennessee’s “default” level of government, providing at minimum a set of basic services to every resident. (30) About 40% of Tennesseans live in unincorporated areas that receive services from a county government only — ranging from 92% in Morgan County to zero in the state’s three counties with consolidated governments (Figure 6). (31)
Municipal Governments
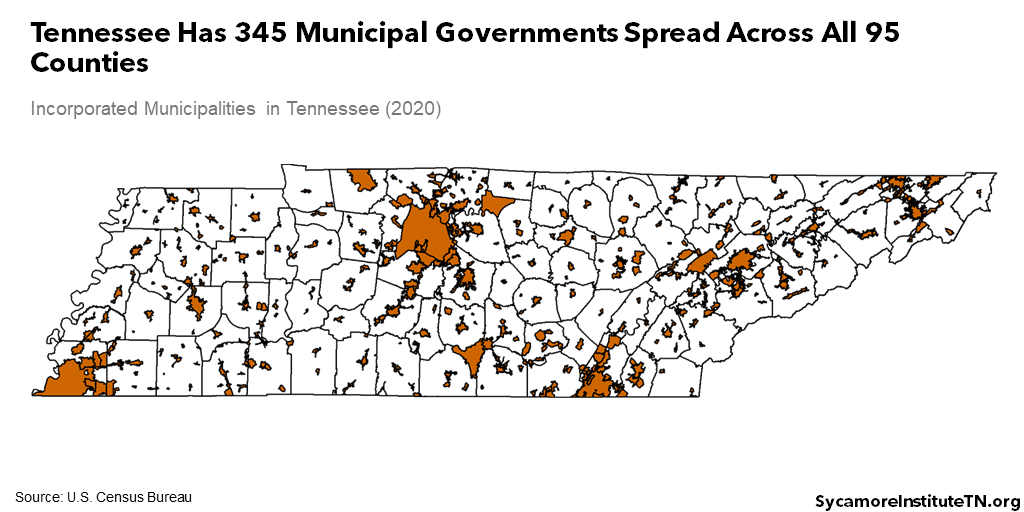
Tennessee’s 345 municipal governments tailor services otherwise provided by the county for their citizens (Figure 7). Residents in part of a county may seek to form a municipality if they want more services than their county offers or believe they can deliver them more efficiently. Municipalities include both cities and towns, which have no legal difference in Tennessee.
Consolidated Governments
Tennessee has three consolidated governments that combine the roles of county and municipality. In Hartsville (Trousdale County), Lynchburg (Moore County), and Nashville (Davidson County), a single entity is responsible for all of the services that a county and municipal government would otherwise provide separately.
Figure 6
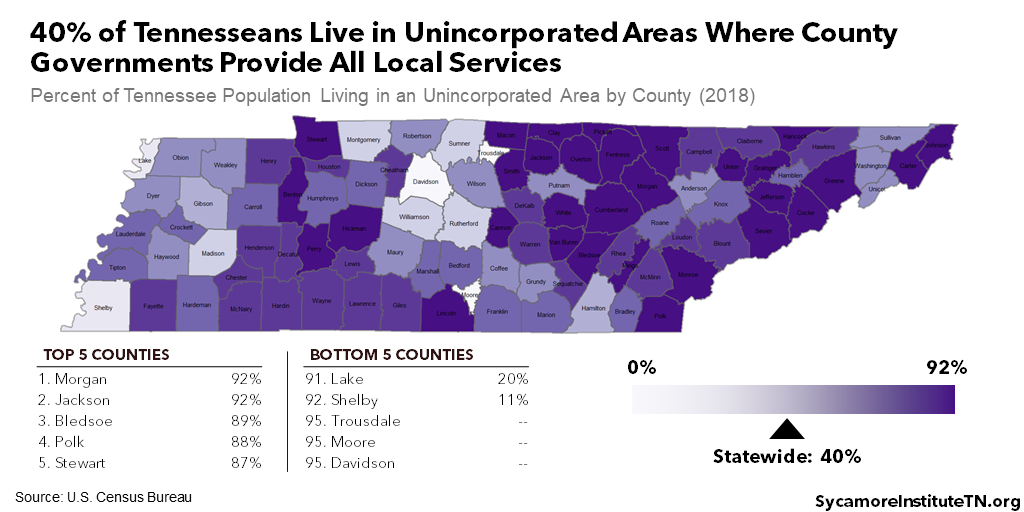
Figure 7
School Districts
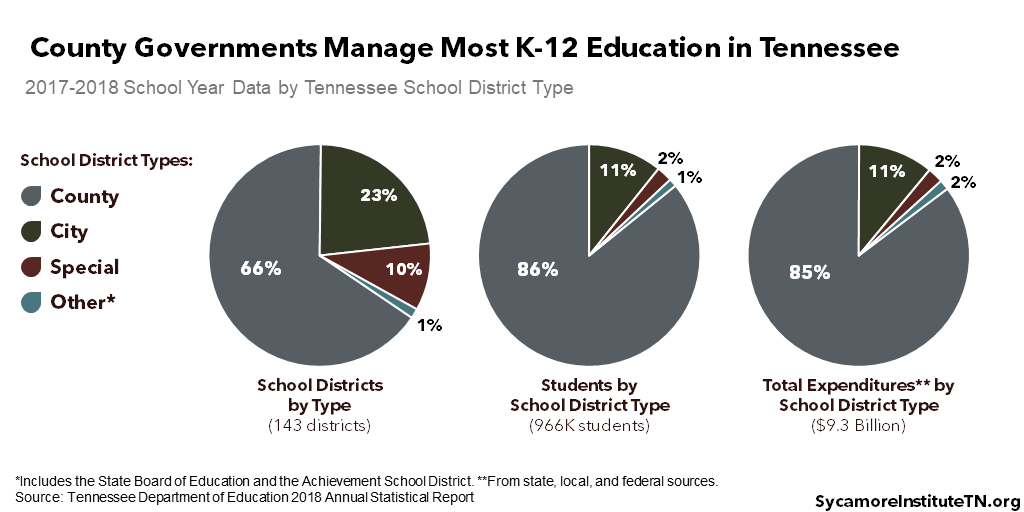
Either a county or municipal government controls most Tennessee school districts, but some are managed by independent local bodies. Of the state’s 143 school districts (Figure 8): (10)
- County governments operate 94.
- Municipal governments run 33.
- Independent bodies govern 14 special school districts.
- The state manages two.
Special Districts
Tennessee has over 400 special districts authorized to provide specific publicly-funded services. In addition to the 14 school districts mentioned above, other limited-authority special districts govern services like airports, public housing, utilities, and railroads.
Figure 8
Parting Words
State policy has a significant role in shaping local decisions, policies, and programs. How locals respond to the accompanying opportunities and challenges meaningfully affects the health and prosperity of Tennesseans across the state.
Moving forward, Sycamore will take a deeper look at these relationships to provide additional tools for understanding the trade-offs of state and local policy options.
References
Click to Open/Close
- U.S. Census Bureau. 2017 Census of Governments – Finance. [Online] October 31, 2019. Accessed via The Government Finance Database at https://willamette.edu/mba/research-impact/public-datasets/.
- National League of Cities. Cities 101: Delegation of Power. [Online] December 13, 2016. https://www.nlc.org/resource/cities-101-delegation-of-power.
- University of Tennessee Municipal Technical Advisory Service. Dillon’s Rule (#MTAS-866). [Online] [Cited: January 23, 2020.] https://www.mtas.tennessee.edu/reference/dillons-rule.
- University of Tennessee County Technical Assistance Service. County Government Under the Tennessee Constitution (#CTAS-443). [Online] [Cited: January 23, 2020.] https://eli.ctas.tennessee.edu/pdf_get/168/.
- —. Required and Optional Services (CTAS-2113). [Online] [Cited: January 17, 2020.] https://eli.ctas.tennessee.edu/reference/required-and-optional-services.
- University of Tennessee Municipal Technical Advisory Service. Charters (#MTAS-158). [Online] [Cited: January 23, 2020.] https://www.mtas.tennessee.edu/reference/charters.
- State of Tennessee. Tenn. Code Ann. § 39-17-1551.
- —. Tenn. Code Ann. § 39-17-1314.
- —. Tenn. Code Ann. § 7-51-2002.
- Tennessee Department of Education. 2018 Annual Statistical Report (Tables 7, 19, and 50). [Online] 2018. Data downloaded from https://www.tn.gov/content/tn/education/data/department-reports/2018-annual-statistical-report.html.
- State of Tennessee. FY 2021 State Budget. [Online] February 3, 2020. https://www.tn.gov/finance/fa/fa-budget-information/fa-budget-archive/fa-budget-publication-2019-2020.html.
- —. The Constitution of the State of Tennessee. [Online] November 4, 2014. http://www.capitol.tn.gov/about/docs/tn-constitution.pdf.
- Tennessee Advisory Commission on Intergovernmental Relations (TACIR). The Local Government Finance Series: The Local Option Sales Tax in Tennessee. [Online] June 2002. https://www.tn.gov/content/dam/tn/tacir/documents/LocalOptSalTax.pdf.
- Tennessee Department of Revenue. Tennessee Sales and Use Tax County and City Local Tax Rates – July 1, 2019. [Online] 2019. [Cited: October 18, 2019.] https://www.tn.gov/content/dam/tn/revenue/documents/taxes/sales/taxlist.pdf.
- State of Tennessee. Tenn. Code Ann. Title 67 Chapter 6.
- —. Tenn. Code Ann. § 67-6-702.
- —. Tenn. Code Ann. § 67-6-706.
- Wesson, Linda and Bergfeld, Tara. Understanding Tennessee’s Maintenance of Effort in Education Laws. Tennessee Comptroller of the Treasury. [Online] September 2015. https://comptroller.tn.gov/content/dam/cot/orea/documents/orea-reports-2015/2015_OREA_MaintofEffort.pdf.
- University of Tennessee County Technical Assistance Service. Maintenance of Effort. [Online] [Cited: December 13, 2019.] http://www.ctas.tennessee.edu/storyline/maintenanceeffort/output/story_html5.html.
- University of Tennessee County Technical Assistance Center. Maintenance of Effort (CTAS-722). [Online] [Cited: February 3, 2020.] http://eli.ctas.tennessee.edu/reference/maintenance-effort-0.
- The Pew Charitable Trusts. State Strategies to Detect Local Fiscal Distress: How States Assess and Monitor the Financial Health of Local Governments. [Online] September 2016. https://www.pewtrusts.org/-/media/assets/2016/09/detecting_local_distress_report.pdf.
- State of Tennessee. Tenn. Code Ann. § 4-3-305. [Online] [Cited: February 3, 2020.]
- —. Tenn. Code Ann. § 4-3-304.
- —. References to Comptroller’s Duties throughout Tenn. Cod Ann. Title 9 Public Finances.
- —. Tenn. Code Ann. § 9-11-116.
- —. Tenn. Code Ann. § 9-21-403. .
- —. Tenn. Code Ann. § 9-21-406.
- —. Tenn. Code Ann. § 9-21-213.
- —. Tenn. Code Ann. § 9-3-211.
- Chervin, Stanley. Fiscal Effort, Fiscal Capacity, and Fiscal Need: Separate Concepts, Separate Problems. Tennessee Advisory Commission on Intergovernmental Relations (TACIR). [Online] June 2007. https://www.tn.gov/content/dam/tn/tacir/documents/effort_capacity_need.pdf.
- U.S. Census Bureau. Tennessee Subcounty Resident Population Estimates: April 1, 2010 to July 1, 2018. [Online] June 27, 2019. Data Accessed from https://www.census.gov/data/tables/time-series/demo/popest/2010s-total-cities-and-towns.html.
- —. Government Finance and Employment: Classification Manual. [Online] October 2006.
- Tennessee Comptroller of the Treasury. FY 2017 County Financial Data obtained from the Division of Local Government Audit. [Online] [Cited: November 18, 2019.] Available via https://apps.cot.tn.gov/tag/.
- Shelby County, Tennessee. Comprehensive Annual Financial Report for the Year Ended June 30, 2019. [Online] December 28, 2018. Obtained via the Tennessee Comptroller of the Treasury from https://comptroller.tn.gov/content/dam/cot/la/advanced-search/2018/other/1524-2018-cn-shelby-co-rpt-cpa273-12-28-18.pdf.
Featured photo adapted from image by arianravan.