Tennessee’s economy frequently tops the list of concerns for politicians and voters alike. However, different metrics may paint very different pictures of the health of our economy and the prosperity of Tennesseans.
Key Takeaways
- Economic growth is important for thriving communities and a prosperous Tennessee.
- There are many ways to measure growth and prosperity, and no single metric tells the whole story. It takes a combination of economic indicators to get the full picture.
- The five metrics discussed here measure different aspects of the economy, and each has pros and cons.
Many Ways to Measure the Economy
There are many ways to measure growth and prosperity, and no single metric tells the whole story. For example, Tennessee’s record low unemployment rate in 2019 was below the national average. However, the share of working-age Tennesseans in the labor force was also consistently below the national average — in part, due to poorer health and lower levels of education. (1)
Focusing on just one metric could cause us to overlook information with major implications for Tennessee’s long-term prosperity and the financial security of its citizens.
The 5 Metrics We’ll Examine
This report focuses on five common metrics that policymakers and the media use to evaluate Tennessee’s economy. They include (click each link for a deeper dive):
3 Key Aspects of Each Metric
As we look at each metric, we’ll examine what (if anything) it tells us about:
- The overall state of Tennessee’s economy.
- Tennessee’s workforce and its productivity.
- The economic security of individual Tennesseans and their families.
Types of Economic Indicators
Economists often categorize metrics based whether they signal changes in the overall economy before, during, or after the fact.
- Leading Indicators usually change ahead of the overall economy and help predict future economic shifts (although those predictions do not always come true). Retail sales and the stock market are examples of leading indicators.
- Coincident Indicators change at about the same time as the overall economy and describe the current state of the economy. Personal income is an example of a coincident indicator.
- Lagging Indicators usually begin to change after the overall economy and can help confirm predictions about economic patterns. Unemployment rates and price inflation are examples of lagging indicators.
What Does ”The Economy” Even Mean?
In the simplest terms, the economy consists of people exchanging items of value. For example, an employer gives you money in exchange for your work. You give other people money in exchange for goods and services like food, housing, and transportation. Businesses use the money they get from you to pay their employees, get more customers, create new/better products, and hire more people. The economy is, in short, a cycle. (2)
In practice, the economy is much more complicated. Competition, investment, regulations, taxes, trade, population trends, technological innovations, and many other factors affect how and to what extent people engage in economic activity.
The Highlights
Below we provide the key takeaways of our analysis of each metric.
Unemployment
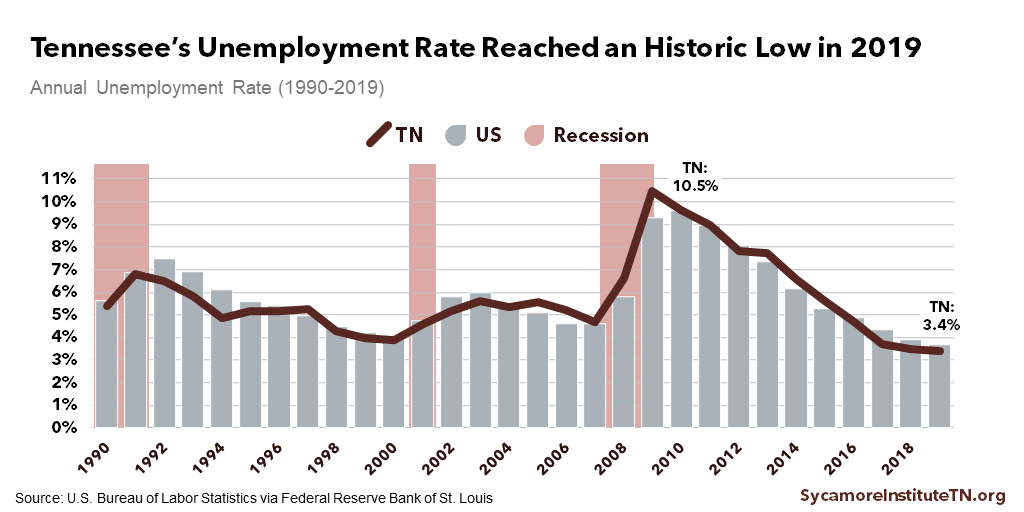
- The unemployment rate measures the percent of the labor force without a job. It is one of the most common metrics used to describe the economy and labor market.
- Tennessee’s unemployment levels reached historic lows in 2019 and were better than the national average (Figure 1).
- The unemployment rate can serve as a proxy for general economic conditions.
- It does not, however, tell us about the size, productivity, or participation of Tennessee’s potential pool of workers and can obscure disparities between groups within an area.
Figure 1
Labor Force Participation
- The labor force participation rate measures the share of a population age 16 and older that is working or actively looking for work. It is a common way to measure the health of the labor market.
- Tennessee’s labor force participation rate is consistently lower than the national average, but the gap has narrowed in recent years as the state’s rate has grown (Figure 2).
- Labor force participation sheds light on people’s willingness to work at any given time but show why some people aren’t working or seeking work. It can also obscure disparities among groups within an area.
- Labor force participation can fluctuate due to trends that are not necessarily tied to the health or distress of the broader economy.
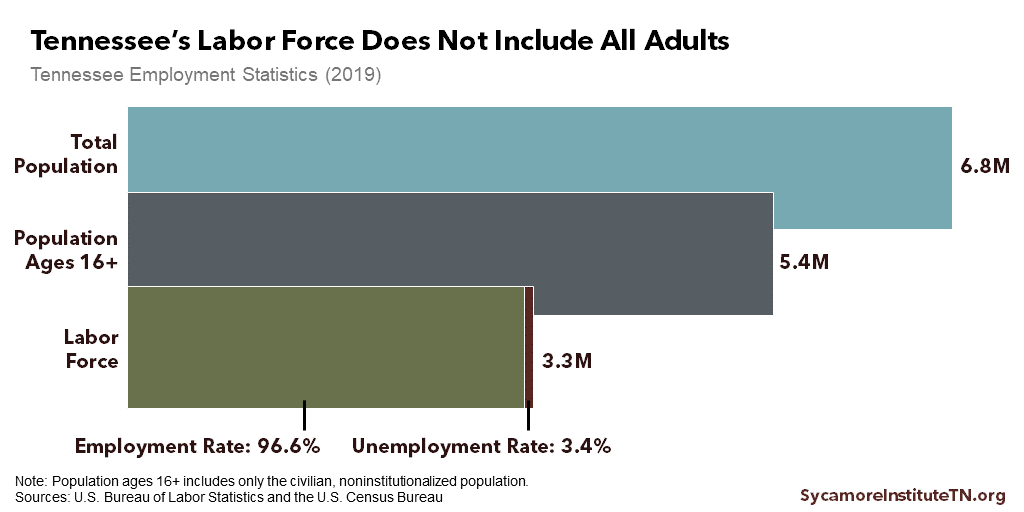
Figure 3 displays the relationship between Tennessee’s population, labor force participation, and employment figures.
Figure 2
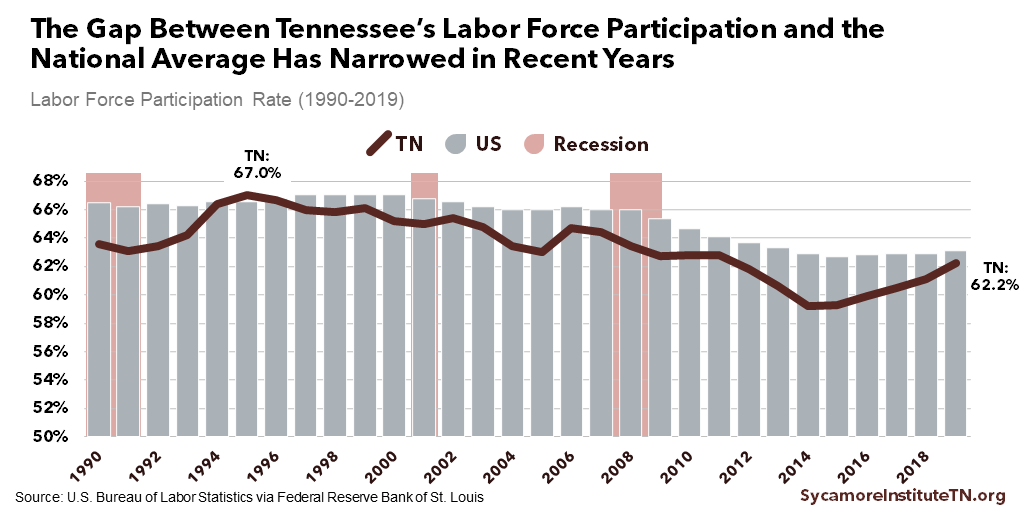
Figure 3
Gross Domestic Product
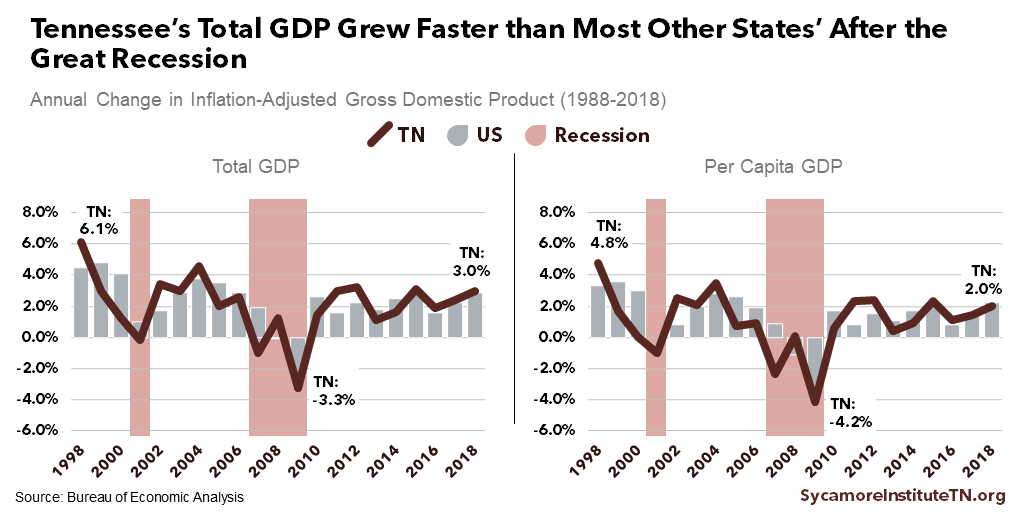
- Gross domestic product (GDP) estimates the total dollar value of all goods and services produced in an economy during a specific period.
- Tennessee’s GDP grew faster than most other states’ after the Great Recession but slower than during past recovery periods (Figure 4).
- GDP is calculated quarterly and provides a standardized way to track the overall size of an economy over time and across areas.
- While GDP provides valuable information about goods and services, it does not capture many important aspects of and contributions to economic well-being.
Figure 4
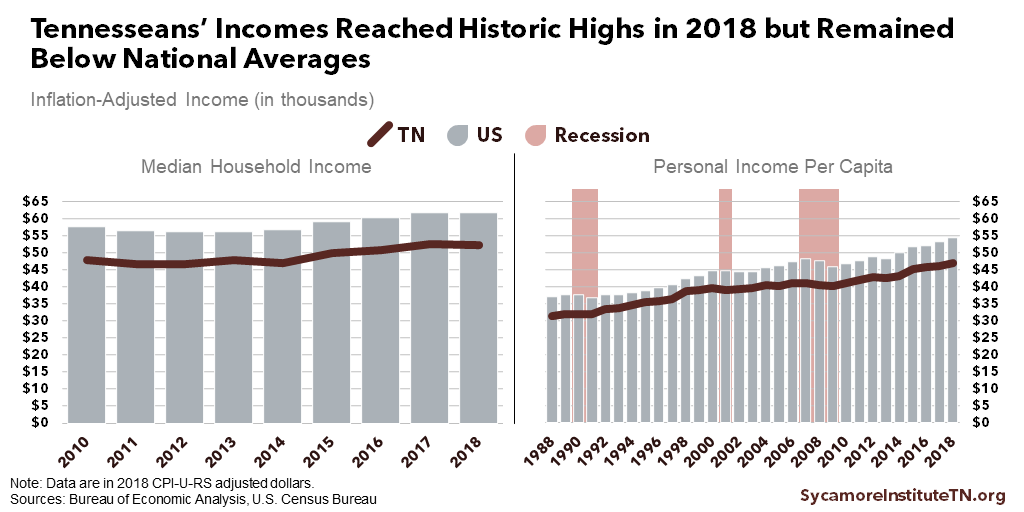
Personal & Household Income
- Household income and personal income gauge the resources that Tennesseans have from wages and some (but not all) other sources of income.
- Measures of Tennesseans’ income reached historic highs in 2018 but remained below the national average (Figure 5).
- Both metrics provide important information about many of the financial resources available to most Tennessee families, but topline figures can obscure disparities among groups.
- Neither measure is a comprehensive assessment of economic well-being because they do not account for wealth or some types of earnings and public assistance.
Figure 5
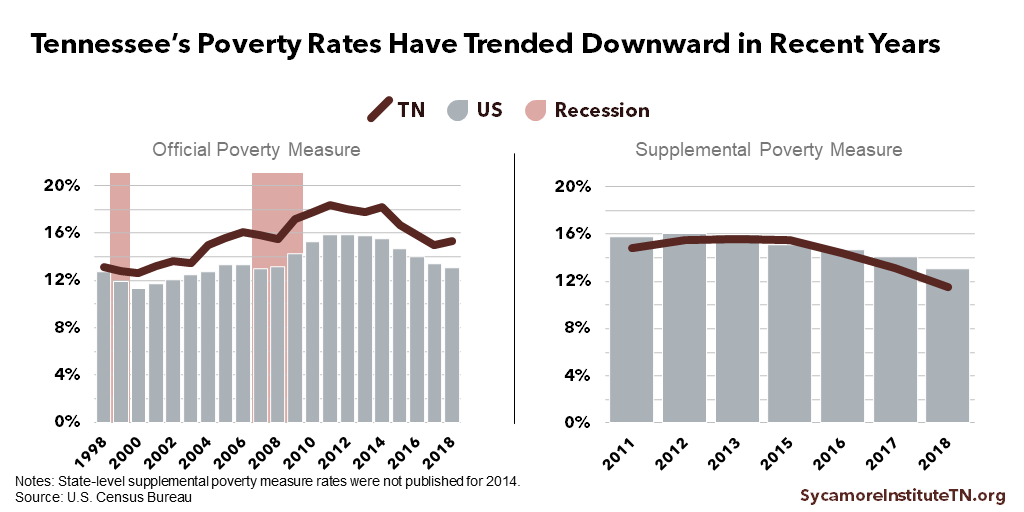
Poverty
- Poverty rates estimate the share of people with economic resources below certain thresholds for meeting basic needs. The official poverty measure is widely seen as flawed but is the most often used.
- In Tennessee, the official poverty measure is above the national average while the supplemental poverty measure is below the national average. Both rates have trended downward in recent years (Figure 6).
- Poverty data offer standard metrics of how many people find it hard to meet their needs across time periods, areas and demographics. However, topline rates can obscure disparities among groups.
- The official poverty rate does not count some resources that may help a family to meet basic needs and does not necessarily reflect those needs’ current costs or how they vary across and within states.
Figure 6
Parting Words
There are many reasons for policymakers and citizens to care what these five metrics do and don’t say about Tennessee’s economy. For example, the economy affects our state budget — the foundation for state policymakers’ goals for Tennessee. We also know that our prosperity and the health of our citizens have a complex and mutually influential relationship. For instance, Tennessee’s high rates of chronic disease affect our workforce and impose a significant cost on our economy. Research also shows that people with more income, wealth, education, and social standing tend to live longer, healthier lives.
References
Click to Open/Close
The series of policy briefs summarized here cites each of the sources listed below at least once. For specific citations, please see the full briefs on unemployment, labor force participation, GDP, income, and poverty.
- UT Boyd Center for Business and Economic Research. An Economic Report to the Governor of the State of Tennessee. Haslam College of Business, The University of Tennessee Knoxville. [Online] January 2018. [Cited: August 17, 2018.] http://cber.haslam.utk.edu/erg/erg2018.pdf.
- U.S. Bureau of Economic Analysis (BEA). Measuring the Economy: A Primer on GDP and the National Income and Product Accounts. [Online] December 2015. https://www.bea.gov/sites/default/files/methodologies/nipa_primer.pdf.
- U.S. Bureau of Labor Statistics (BLS). Unemployment Rate in Tennessee [TNUR]. [Online] [Cited: April 3, 2020.] Retrieved from FRED, Federal Reserve Bank of St. Louis via https://fred.stlouisfed.org/series/TNUR.
- —. Civilian Unemployment Rate [UNRATE]. [Online] [Cited: April 3, 2020.] Retrieved from FRED, Federal Reserve Bank of St. Louis via https://fred.stlouisfed.org/series/UNRATE.
- —. Tennessee Civilian Labor Force Participation Rate (LBSSA47). [Online] [Cited: April 3, 2020.] Retrieved from FRED, Federal Reserve Bank of St. Louis via https://fred.stlouisfed.org/series/LBSSA47.
- —. U.S. Civilian Labor Force Participation Rate [CIVPART]. [Online] [Cited: April 3, 2020.] Retrieved from FRED, Federal Reserve Bank of St. Louis via https://fred.stlouisfed.org/series/CIVPART.
- U.S. Bureau of Labor Statistics. Local Area Unemployment Statistics. [Online] [Cited: April 3, 2020.] Accessed via https://data.bls.gov/pdq/SurveyOutputServlet.
- U.S. Census Bureau. Population Estimates, July 1, 2019. [Online] [Cited: April 3, 2020.] Accessed from https://www.census.gov/quickfacts/TN.
- U.S. Bureau of Economic Analysis (BEA). Real GDP by State: All Industry Total (Percent Change from Preceding Period). [Online] May 1, 2019. [Cited: October 25, 2019.] Accessed via https://apps.bea.gov/itable/index.cfm.
- U.S. Census Bureau. Income in the Past 12 Months (S1901). American Community Survey 1-Year Estimates. [Online] September 2019. [Cited: October 25, 2019.] Accessed via http://www.data.census.gov.
- U.S. Bureau of Economic Analysis (BEA). Per Capital Personal Income (Dollars). [Online] September 24, 2019. [Cited: October 25, 2019.] Accessed via https://apps.bea.gov/itable/index.cfm.
- U.S. Bureau of Labor Statistics (BLS). Updated CPI-U-RS Data, All Items, 1977-2018. [Online] October 16, 2019. [Cited: October 25, 2019.] Accessed via https://www.bls.gov/cpi/research-series/home.htm#CPI-U-RS%20Data.
- U.S. Census Bureau. Small Area Income and Poverty Estimates (SAIPE). [Online] [Cited: November 1, 2019.] https://www.census.gov/data-tools/demo/saipe/#/?map_geoSelector=aa_c.
- —. Poverty Status in the Past 12 Months (S1701). American Community Survey 1-Year Estimates. [Online] September 2019. [Cited: October 25, 2019.] Accessed via http://www.data.census.gov.
- —. The Supplemental Poverty Measure. [Online] 2010-2019. [Cited: November 1, 2019.] Accessed from https://www.census.gov/topics/income-poverty/supplemental-poverty-measure/library/publications.html.
- Scott, Katherine, Stiles, Jeremy and Avery, Sally. Economic Development, Education, and Health in Tennessee. Center for Economic Research in Tennessee, Tennessee Department of Economic and Community Development. [Online] January 23, 2017. Accessed via https://www.tnecd.com/files/459/economic-development-education-and-health_01-23-2017-2-.pdf.
- Dvorkin, Maximiliano. Assessing the Health of the Labor Market: The Unemployment Rate vs. Other Indicators. Federal Reserve Bank of St. Louis. [Online] January 2015. https://www.stlouisfed.org/publications/regional-economist/january-2015/labor-market-health.
- U.S. Bureau of Labor Statistics (BLS). How the Government Measures Unemployment. [Online] October 8, 2015. https://www.bls.gov/cps/cps_htgm.htm.
- —. Local Area Unemployment Statistics: Unemployment Rates for States, Seasonally-Adjusted (February 2020). [Online] March 27, 2020. [Cited: April 3, 2020.] https://www.bls.gov/web/laus/laumstrk.htm.
- Guisinger, Amy Y., et al. A State-Level Analysis of Okun’s Law. Federal Reserve Bank of St. Louis. [Online] October 2017. https://s3.amazonaws.com/real.stlouisfed.org/wp/2015/2015-029.pdf.
- Desilver, Drew. What the Unemployment Rate Does – and Doesn’t – Say About The Economy. Pew Research Center. [Online] March 7, 2017. http://www.pewresearch.org/fact-tank/2017/03/07/employment-vs-unemployment-different-stories-from-the-jobs-numbers/.
- Hotchkiss, Julie L. Decomposing Changes in the Aggregate Labor Force Participation Rate (Working Paper 2009-6a). Federal Reserve Bank of Atlanta. [Online] July 2009. https://www.frbatlanta.org/-/media/documents/research/publications/wp/2009/wp0906a.pdf.
- Council of Economic Advisers. The Labor Force Participation Rate Since 2007: Causes and Policy Implications. Executive Office of the President of the United States. [Online] July 2014. https://obamawhitehouse.archives.gov/sites/default/files/docs/labor_force_participation_report.pdf.
- Donovan, Sarah A. An Overview of the Employment-Population Ratio. Congressional Research Service. [Online] May 25, 2015. https://fas.org/sgp/crs/misc/R44055.pdf.
- U.S. Bureau of Economic Analysis (BEA). Gross Domestic Product by State: All Industry Total (Millions of Current Dollars). [Online] May 1, 2019. [Cited: October 25, 2019.] Accessed via https://apps.bea.gov/itable/index.cfm.
- —. Per Capita Real GDP by State (Chained 2012 Dollars). [Online] May 1, 2019. [Cited: October 25, 2019.] Accessed via https://apps.bea.gov/itable/index.cfm.
- —. Compound Annual Growth Rate Between Two Periods of Real GDP in Chained Dollars by State. [Online] May 1, 2019. [Cited: October 25, 2019.] Accessed via https://apps.bea.gov/itable/index.cfm.
- Katz, Arnold J. An Overview of BEA’s Source Data and Estimating Methods for Quarterly GDP. U.S. Bureau of Economic Analysis. [Online] 2006. https://www.bea.gov/system/files/papers/P2006-8.pdf.
- Giannetti, B F, et al. A Review of Limitations of GDP and Alternative Indicies to Monitor Human Well-Being and to Manage Eco-System Functionality. Journal of Cleaner Production, 87(11-25). [Online] 2015. http://www.advancesincleanerproduction.net/papers/journals/2014/2014_jcp.pdf.
- Dynan, Karen and Sheiner, Louise. Huthcins Center Working Paper #43: GDP as a Measure of Economic Well-Being. Hutchins Center on Fiscal & Monetary Policy at Brookings. [Online] August 2018. https://www.brookings.edu/wp-content/uploads/2018/08/WP43-8.23.18.pdf.
- Cha, Mijin. What’s Missing from GDP? Demos. [Online] January 29, 2013. https://www.demos.org/publication/whats-missing-gdp.
- Dobbs, Richard, Remes, Jaana and Woetzel, Jonathan. Is GDP the Best Measure of Growth? McKinsey Global Institute. [Online] January 2015. https://www.mckinsey.com/featured-insights/employment-and-growth/is-gdp-the-best-measure-of-growth.
- Lange, Glenn-Marie, Wodon, Quentin and Carey, Kevin. The Changing Wealth of Nations 2018 : Building a Sustainable Future. The World Bank. [Online] January 30, 2018. https://openknowledge.worldbank.org/handle/10986/29001.
- Bate, Roger. What is Prosperity and How Do We Measure It? American Enterprise Institute. [Online] October 27, 2009. http://www.aei.org/publication/what-is-prosperity-and-how-do-we-measure-it/.
- U.S. Bureau of Economic Analysis (BEA). Local Area Personal Income and Employment Methodology. [Online] November 2017. https://www.bea.gov/sites/default/files/methodologies/lapi2016.pdf.
- U.S. Census Bureau. Income : About. [Online] February 29, 2016. [Cited: November 1, 2019.] https://www.census.gov/topics/income-poverty/income/about.html.
- Congressional Budget Office (CBO). The Distribution of Household Income and Federal Taxes, 2013. [Online] June 2016. https://www.cbo.gov/sites/default/files/114th-congress-2015-2016/reports/51361-householdincomefedtaxes.pdf.
- Donovan, Sarah A, Labonte, Marc and Dalaker, Joseph. The U.S. Income Distribution: Trends and Issues. Congressional Research Service. [Online] December 8, 2016. [Cited: August 21, 2018.] https://fas.org/sgp/crs/misc/R44705.pdf.
- U.S. Census Bureau. How the Census Bureau Measures Poverty. [Online] August 27, 2019. [Cited: November 1, 2019.] https://www.census.gov/topics/income-poverty/poverty/guidance/poverty-measures.html.
- National Academy of Sciences. Measuring Poverty: A New Approach. [Online] 1995. https://www.nap.edu/catalog/4759/measuring-poverty-a-new-approach.
- Fisher, Gordon M. The Development and History of the U.S. Poverty Thresholds – A Brief Overview. U.S. Department of Health and Human Services (HHS). [Online] January 1, 1997. https://aspe.hhs.gov/history-poverty-thresholds.
- Fox, Liana. The Supplemental Poverty Measure: 2018. U.S. Census Bureau. [Online] October 2019. https://www.census.gov/content/dam/Census/library/publications/2019/demo/p60-268.pdf.
- Bridges, Benjamin and Gesumaria, Robert V. The Supplemental Poverty Measure (SPM) and Children: How and Why the SPM and Official Poverty Estimates Differ. U.S. Social Security Administration. [Online] 2015. https://www.ssa.gov/policy/docs/ssb/v75n3/v75n3p55.html.
- Besharov, Douglas J. and Germanis, Peter. Reconsidering the Federal Poverty Measure. University of Maryland School of Public Policy, Welfare Reform Academy. [Online] June 14, 2004. http://www.welfareacademy.org/pubs/poverty/povmeasure.description.pdf.
- Office of the Assistant Secretary for Planning and Evaluation (ASPE). Frequently Asked Questions Related to the Poverty Guidelines and Poverty: What Programs Use the Poverty Guidelines? U.S. Department of Health and Human Services. [Online] [Cited: November 1, 2019.] https://aspe.hhs.gov/frequently-asked-questions-related-poverty-guidelines-and-poverty.
- Weidinger, Matt. The Government’s Official Poverty Data Miss an Increasing Share of Antipoverty Spending. American Enterprise Institute. [Online] September 2019. https://www.aei.org/wp-content/uploads/2019/09/The-Governments-Official-Poverty-Data.pdf.
- Matthews, Dylan. The Official Poverty Measure is Garbage. The Census Has Found a Better Way. Vox. [Online] September 12, 2017. https://www.vox.com/2015/9/16/9337041/supplemental-poverty-measure.