Medical debt is surprisingly common and can have far-reaching effects on prosperity and health. This study focuses on medical debt in collections, exploring how the prevalence and amount of debt vary across Tennessee’s 95 counties.
For background, prior reports explain how medical debt occurs as well as who has medical debt in Tennessee and how it affects people’s lives. Future work will focus on options for policymakers who want to address the issue.
Key Takeaways
- The share of Tennesseans with medical debt on their credit report in 2016 varied across the state’s 95 counties, ranging from a low of 10% to a high of 43%.
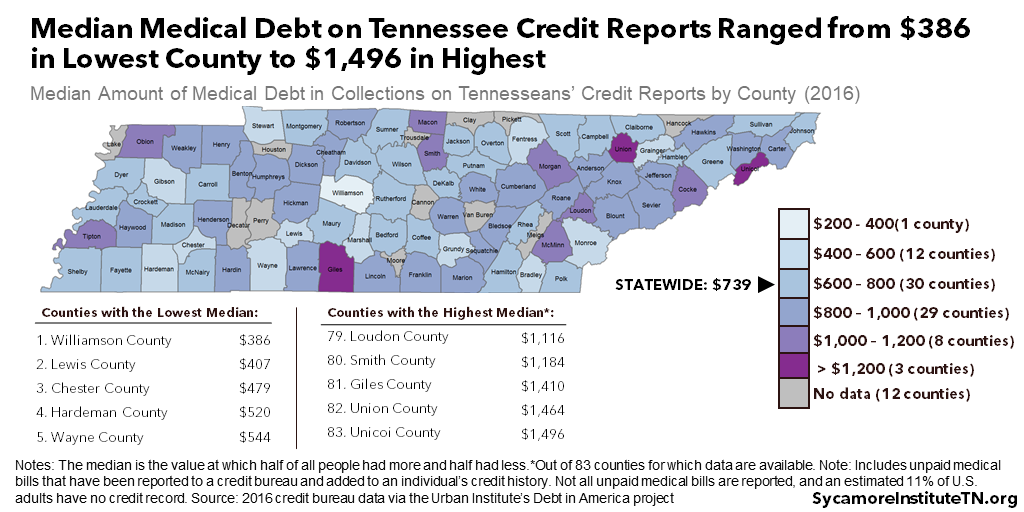
- The median amount of medical debt on Tennessee credit reports ranged from $386 in the lowest county to $1,496 in the highest.
- Tennessee counties with higher rates of medical debt were more likely to have elevated rates of uninsured residents, auto/retail loans and delinquencies, and payday lenders per capita.
Acknowledgement: This research was funded by the Annie E. Casey Foundation. We thank them for their support but acknowledge that the findings and conclusions presented in this report are those of the authors alone, and do not necessarily reflect the opinions of the Foundation.
Sycamore takes a neutral and objective approach to analyze and explain public policy issues. Funders do not determine research findings. More information on our code of ethics is available here.
How Medical Debt Impedes Prosperity and Health
Medical debt can have far-reaching effects on economic prosperity and health. Even small medical bills may be more than some families can afford without cutting back elsewhere or taking loans. (1) (2) (3) (4) When an unpaid medical bill becomes debt, it can have lasting and compounding effects. For example, it can reduce access to and increase the costs of debt types associated with economic mobility and long-term wealth creation. People with medical debt are also more likely to have worse physical and mental health and to forego needed medical care — which have economic effects of their own. (5) (6) (7) (8)
Medical Debt in Collections Across Tennessee’s 95 Counties
The share of Tennesseans with medical debt on their credit reports in 2016 ranged from 10% in Williamson County to 43% in Lake County (Figure 1), according to a sample of credit bureau data. Those rates compare to about 24% statewide and 18% across the U.S. (9)
The median amount of medical debt on Tennesseans’ credit reports ranged from $386 in Williamson County to $1,496 in Unicoi County (Figure 2). (9) Statewide, the median was $739. In other words, half of the affected Tennesseans had less than $739 of medical debt on their credit histories, and half had more. Counties with higher median debt amounts did not necessarily have a higher share of residents with medical debt.
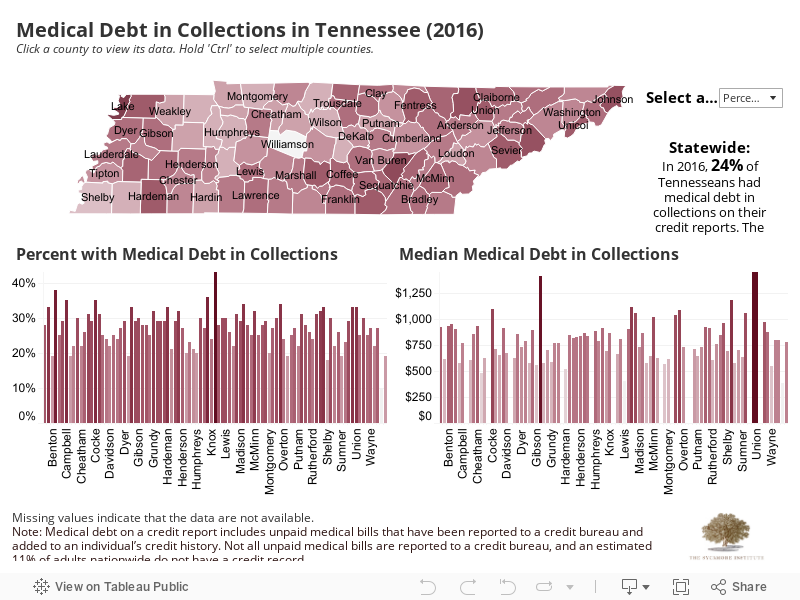
Use our interactive map at the bottom of this page to explore the data further.
Figure 1
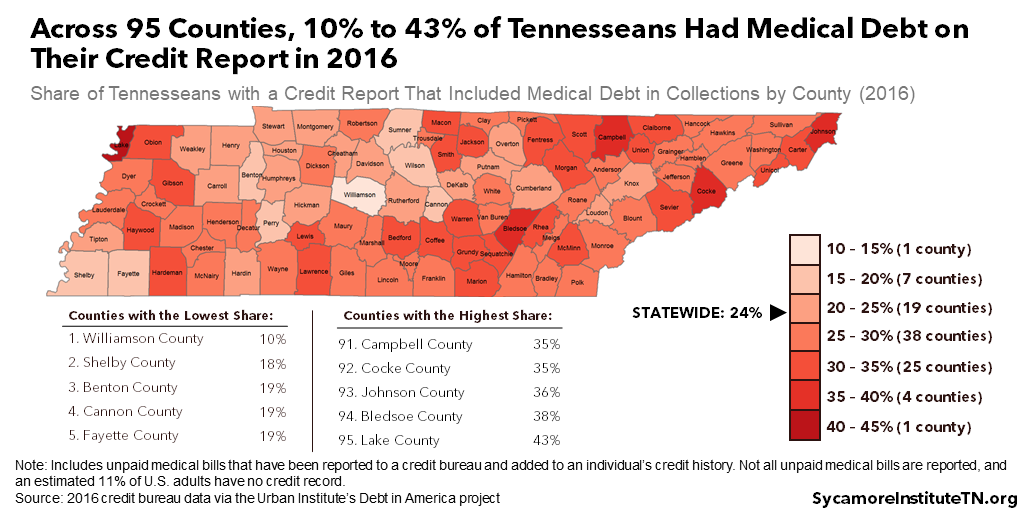
Figure 2
Characteristics of Counties with High Rates of Medical Debt
To understand better the variation in medical debt prevalence across Tennessee, Sycamore analyzed the relationship with 18 county-level traits — including demographics, socioeconomics, housing, health and health care, and other types of debt. This type of analysis can inform the development of community-level approaches that may reduce the prevalence of medical debt (see our Summary of Methods and Limitations).
Counties with higher rates of medical debt were more likely to have elevated rates of uninsured residents, auto/retail loans and delinquencies, payday lenders per capita, and residents age 20-44. When controlling for other factors, we found no statistically significant relationships between the other county-level attributes we analyzed and the share of population with medical debt on a credit report. Below, we provide more details and context for our major findings. See Table A3 in the Appendix for the complete results of our main analysis.
Higher Uninsured Rates
Counties with higher rates of medical debt in collections were more likely to have higher uninsured rates. This finding backs up a 2015 survey in which Americans without health insurance were more likely to report having unpaid medical bills than those with health insurance. (12) A major purpose of health insurance is to provide financial protection against catastrophic medical expenses. (4)
Other Types of Debt
Residents of counties with higher rates of medical debt in collections were more likely to have (and be delinquent on) auto/retail loans, but less likely to have student loan debt. Existing research shows consumers with medical debt are more likely to have other types of debt, both good and bad — like credit cards, car loans, mortgages, and payday loans. (13) (4) (12) (14) Due to medical debt’s effect on credit scores, those forms of credit may have higher costs and less favorable terms.
The inverse relationship we found between medical debt and student loan debt was surprising. The reasons are unclear and warrant more research.
More Payday Lenders Per Capita
Counties with higher rates of medical debt in collections tended to have more payday lenders per capita. Payday loans are short-term, high-interest loans. A separate 2015 survey estimated that 51% of Tennesseans with unpaid medical bills (vs. 23% without) reported taking a payday loan in the last five years. (15) Our analysis indicates this relationship occurs at the community level as well as the individual level. Determining causation, however, may be a chicken and egg question. Are people with unpaid medical bills more likely to take payday loans, or do people who use payday loans have more trouble paying medical bills? The answer may be either or both.
Residents Age 20-44
Counties with higher rates of medical debt in collections tended to have a larger share of residents between 20 and 44 years of age. Previous research has found that prevalence of medical debt peaks between the ages of 27-44 and steadily decreases with age. (16) Using 2015 survey data, we estimated that medical debt was most common among Tennesseans aged 35-44. (17)
Parting Words
Medical debt is a complex topic with far-reaching implications for Tennesseans’ health and prosperity. This report is one of several that we hope will inform an evidence-based discussion about medical debt in Tennessee, its effects, and potential policy levers. In the future, we will explore options for policymakers who want to address the prevalence and effects of medical debt in our state.
Figure 3

Summary of Methods and Limitations
We performed descriptive, bivariate, and regression analysis to examine the association between the share of the population with medical debt in collections and other county-level characteristics. Our analysis, which has some limitations, relied primarily on credit bureau data from the Urban Institute (9) and 2013-2017 American Community Survey 5-year estimates (18).
The data used for this analysis do not include individuals without a credit report or whose unpaid bills have not been reported to a credit bureau (Figure 3). A 2015 study estimated that 11% of adults nationwide do not have a credit report, and those with lower incomes are less likely to have a credit report. (10) As a result, the medical debt estimates based on credit bureau data likely underestimate the prevalence of medical debt in Tennessee.
This analysis uses county-level data to understand medical debt in Tennessee, whereas a previous analysis relied on individual-level data. Looking at both community and personal characteristics provides different but complimentary information. (19)
See the Methods Appendix for information about our data sources, methods, and limitations and the complete results from our analyses.
Using the Interactive Map
Use our interactive map below to explore variations in the prevalence and amount of medical debt across Tennessee’s 95 counties. To select multiple counties, either click and drag the selection box or hold CTRL + click to add or remove counties from your selection.
References
Click to Open/Close
- Consumer and Community Development Research Section. Report on the Economic Well-Being of U.S. Households in 2017. Federal Reserve Board, Division of Consumer and Community Affairs. May 2018. https://www.federalreserve.gov/publications/files/2017-report-economic-well-being-us-households-201805.pdf.
- Seifert, Robert W and Rukanina, Mark. Bankruptcy Is the Tip of a Medical-Debt Iceberg. Health Affairs, 25(2): W89-W92. 2006. https://www.healthaffairs.org/doi/10.1377/hlthaff.25.w89.
- Pollitz, Karen and Cox, Cynthia. Medical Debt Among People with Health Insurance. Kaiser Family Foundation. [Online] January 7, 2014. https://www.kff.org/private-insurance/report/medical-debt-among-people-with-health-insurance/.
- Hamel, Liz, et al. The Burden of Medical Debt: Results from the Kaiser Family Foundation/New York Times Medical Bills Survey. Kaiser Family Foundation. January 2016. https://www.kff.org/health-costs/report/the-burden-of-medical-debt-results-from-the-kaiser-family-foundationnew-york-times-medical-bills-survey/.
- Kalousova, Lucie and Burgard, Sarah A. Debt and Foregone Medical Care. Journal of Health and Social Behavior, 54(2): 204-220. 2013. https://journals.sagepub.com/doi/pdf/10.1177/0022146513483772.
- Sweet, Elizabeth, et al. The High Price of Debt: Household Financial Debt and Its Impact on Mental and Physical Health. Social Science and Medicine, 91: 94-100. August 2013. https://www.ncbi.nlm.nih.gov/pmc/articles/PMC3718010/.
- Robertson, Christopher Tarver, Egelhof, Richard and Hoke, Michael. Get Sick, Get Out: The Medical Causes for Home Mortgage Foreclosures. Health Matrix: The Journal of Law-Medicine, 18(1). 2008. https://scholarlycommons.law.case.edu/healthmatrix/vol18/iss1/4/.
- Expanding Prosperity Impact Collaborative (EPIC). Lifting the Weight: Solving the Consumer Debt Crisis for Families, Communities & Future Generations. The Aspen Institute Financial Security Program. 2018. http://www.aspenepic.org/wp-content/uploads/2018/12/LiftingtheWeight_SolutionsFramework.pdf.
- Ratcliffe, Caroline, et al. Debt in American: An Interactive Map. The Urban Institute. December 6, 2017. Accessed on January 23, 2019 from https://apps.urban.org/features/debt-interactive-map/?type=medical&variable=perc_debt_collect&state=47.
- Brevoort, Kenneth, Grimm, Philipp and Kambara, Michelle. Data Point: Credit Invisibles. Consumer Financial Protection Bureau. May 2015. https://files.consumerfinance.gov/f/201505_cfpb_data-point-credit-invisibles.pdf.
- Karpman, Michael and Caswell, Kyle J. Past-Due Medical Debt Among Nonelderly Adults, 2012–15. Urban Institute. 2017. https://www.urban.org/research/publication/past-due-medical-debt-among-nonelderly-adults-2012-15.
- Consumer Financial Protection Bureau. What is a Payday Loan? [Online] June 2, 2017. Accessed on January 28, 2019 from https://www.consumerfinance.gov/ask-cfpb/what-is-a-payday-loan-en-1567/.
- Gross, Tal and Notowidigdo, Matthew J. Health Insurance and the Consumer Bankruptcy Decision: Evidence from Expansions of Medicaid. Journal of Public Economics, 95: 767-778. 2011. http://isiarticles.com/bundles/Article/pre/pdf/48303.pdf.
- Sycamore Institute’s Analysis of. 2012 and 2015 National Financial Capability Study. FINRA Investor Education Foundation. http://www.usfinancialcapability.org/downloads.php.
- Batty, Michael, Gibbs, Christa and Ippolito, Benedic. Unlike Medical Spending, Medical Bills In Collections Decrease with Patients’ Age. Health Affairs, 37(8): 1257-1264. 2018. https://www.healthaffairs.org/doi/pdf/10.1377/hlthaff.2018.0349.
- Melton, Courtnee and Pellegrin, Mandy. Medical Debt in Tennessee: Who Has It and Why Does It Matter? The Sycamore Institute. May 8, 2019. https://www.sycamoreinstitutetn.org/medical-debt-tennessee/.
- U.S. Census Bureau. 2013-2017 American Community Survey 5-Year Estimates. Accessed on February 11, 2019 via http://factfinder.census.gov.
- Braga, Breno, et al. Local Conditions and Debt in Collections. Urban Institute. June 2016. https://www.urban.org/sites/default/files/publication/81886/2000841-Local-Conditions-and-Debt-in-Collections.pdf.
- Andersen, R and Davidson, P. Improving access to care in America: individual and contextual indicators. In: Andersen R, Rice T, Kominski J, eds. Changing the US Health Care System: Key Issues in Health Services Policy and Management. 2007. https://www.academia.edu/14385102/IMPROVING_ACCESS_TO_CARE_IN_AMERICA_Individual_and_Contextual_Indicators.
- Thongnopnua, Joda, Morton, David and Sheppard, Nathan. Fighting Predatory Lending in Tennessee. Metro Ideas Project. January 2018. https://metroideas.org/projects/fighting-predatory-lending-in-tennessee/.
- University of Wisconsin Population Health Institute. 2018 County Health Rankings. Accessed on February 5, from http://www.countyhealthrankings.org/app/tennessee/2018/overview.
- Opportunity Nation. The 2017 Opportunity Index: Technical Supplement. 2018. Accessed on February 26, 2019 from http://opportunityindex.org/wp-content/uploads/2017/12/Opportunity-Index-2017-Technical-Supplement.pdf.
- Dartmouth Atlas Project. Medicare Reimbursements. 2016. Accessed on January 7, 2019 from https://www.dartmouthatlas.org/interactive-apps/medicare-reimbursements/.
- Ferrari, Silvia LP and Cribari-Neto, Francisco. Beta Regression for Modelling Rates and Proportions. Journal of Applied Statistics, 31(7): 799-815. 2004. https://www.ime.usp.br/~sferrari/beta.pdf.
- Kieschnick, Robert and McCullough, BD. Regression Analysis of Variates Observed on (0,1): Percentages, Proportions and Fractions. Statistical Modelling, 3: 193-213.2003. https://journals.sagepub.com/doi/10.1191/1471082X03st053oa.
Featured image by Cavalier92