Tennessee has faced a series of hospital closures over the last decade, bringing attention to the health care resources available in communities across the state. To inform related policy discussions, Sycamore created the Tennessee Health Care Capacity Dashboard — presented below along with several key findings on the health care capacity of counties without a hospital.
Note: Much of the information in this report was updated in the FY 2025 Budget in Brief.
Key Takeaways
- The Tennessee Health Care Capacity Dashboard compiles data on the hospital, primary care, and substance abuse/mental health care resources available in each of Tennessee’s 95 counties.
- The 20 counties without a hospital also tend to have lower capacity for primary and mental health care, but a hospital does not guarantee strong capacity for these provider types.
- The type and amount of medical resources a community requires locally can depend on its health care needs, ability to access and afford services, and the availability of alternatives.
Using the Dashboard
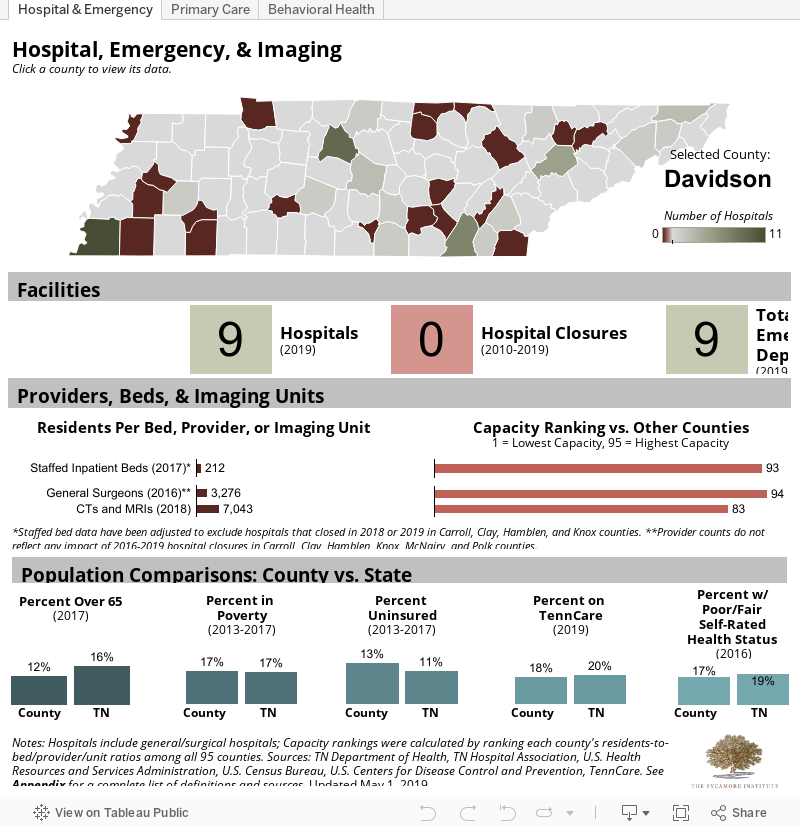
Use our Tennessee Health Care Capacity Dashboard to explore data on key health care resources available in each of Tennessee’s 95 counties. The dashboard compiles data from over 20 sources on the hospital, emergency, imaging, primary care, and substance abuse/mental health care resources available across the state. This tool’s hospital metrics include only general/surgical hospitals and exclude specialty, exclusively children’s, veterans, and psychiatric hospitals.
See the Appendix for a full list of sources, data definitions, and data notes. Download the full dataset here.
Hospital Closures and Counties Without a Hospital
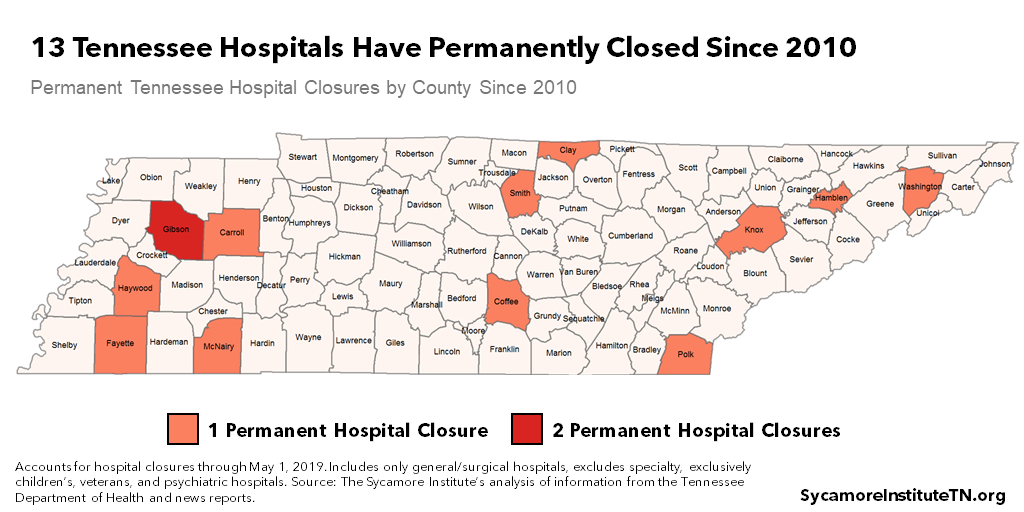
Since 2010, 13 Tennessee hospitals have permanently closed (Figure 1). According to one national tracker, Texas is the only state that has had more rural hospital closures than Tennessee. (1) Some of Tennessee’s 13 closed hospitals have continued some level of services (e.g. outpatient care, freestanding emergency department), and some were coupled with capacity expansions at other nearby hospitals.
Figure 1
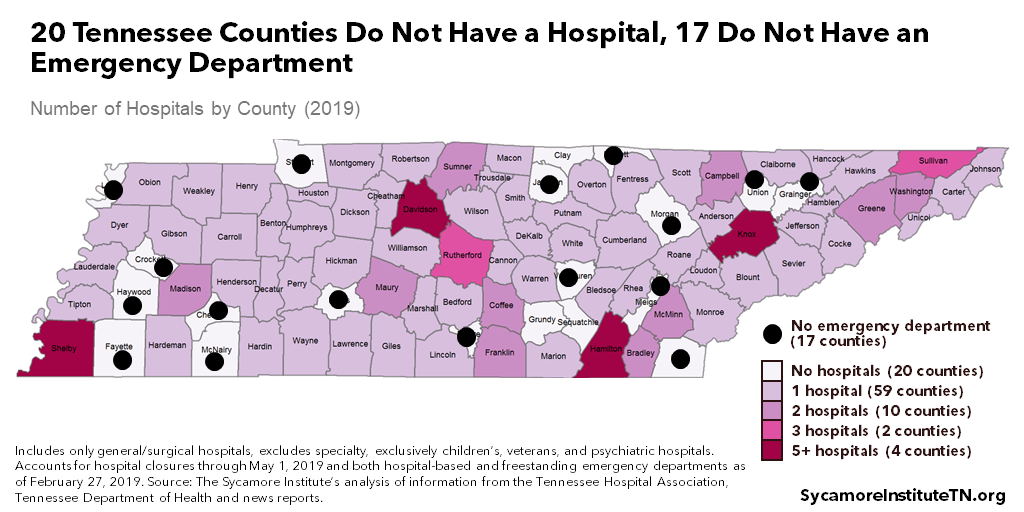
As of April 2019, 20 Tennessee counties had no hospital — 17 of which also had no emergency department (Figure 2). About 4.6% of Tennesseans live in a county without a hospital and 4.0% live in a county without an emergency department. (8) (3) (2) (6) (7) (5) (4) (9) A community’s health care capacity, however, also extends beyond the walls of a hospital. Figures 3 and 4 show two examples of how health care capacity varies across counties with and without a hospital.
Figure 2
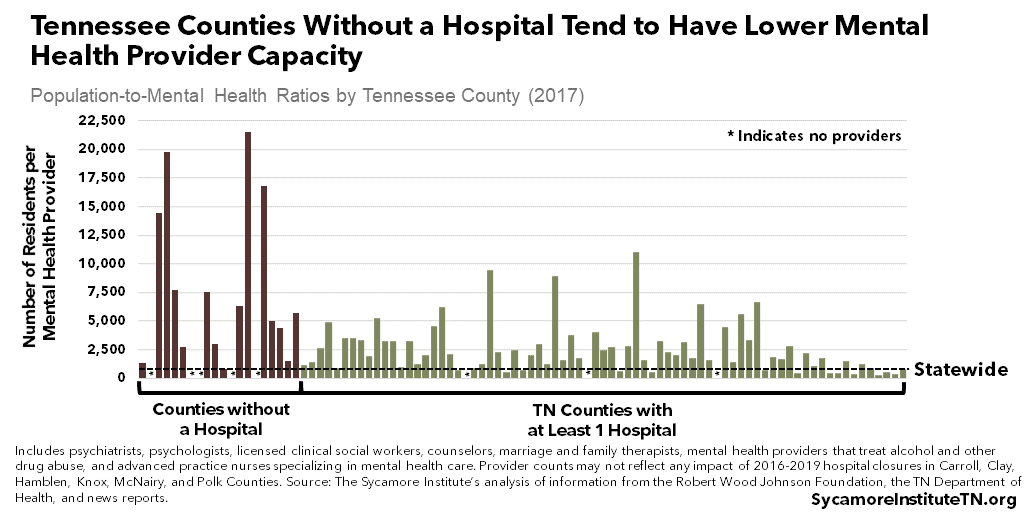
The 20 counties without a hospital tend to have lower capacity of primary care physicians (Figure 3) and mental health providers (Figure 4). However, they are not the only counties with relatively low access to these provider types. (7) For example, Bledsoe, Lauderdale, and Marshall counties and Hancock, Macon, and Trousdale counties are among the bottom 10 counties in number of residents per primary care physician and mental health provider, respectively. (10) (8) (11) (2) (3) (4) (5) (6)
Figure 3
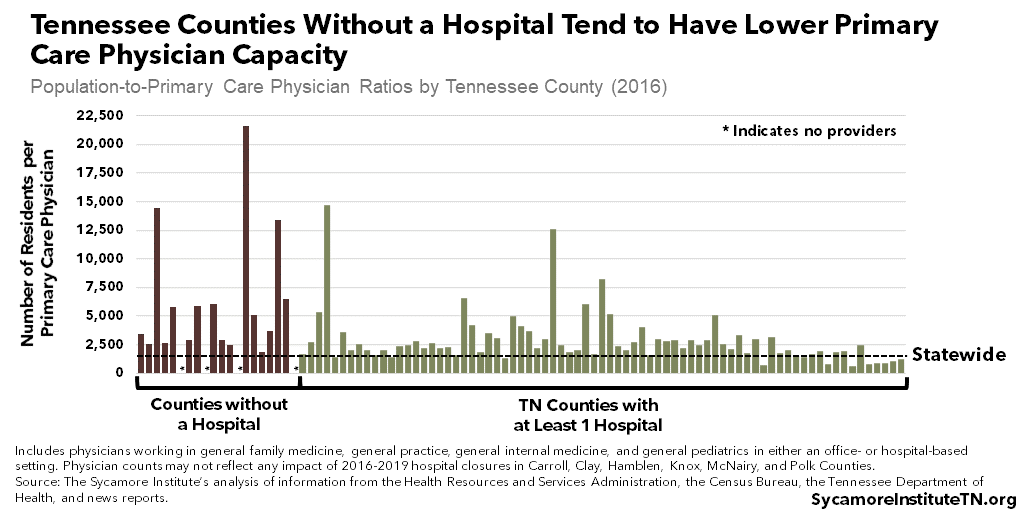
Figure 4
Other Factors to Consider
Determining what health care resources a given community needs locally is complicated and warrants further research. There is some consensus that primary and emergency care are the most essential health care services needed in rural communities. (12) There are, however, multiple factors that drive the type and amount of health care services a community might need:
- What are the medical needs of the community? The kinds of conditions individuals have may dictate the kinds of services that a community needs most. The demographics of a community also play a role as different age groups (e.g., children, women of childbearing age, elderly, etc.) may call for different kinds of health care services and providers.
- What resources does a community have to help access and afford medical services? For example, large numbers of uninsured, low-income, or underserved individuals may call for more safety net services like community health centers.
- Are alternatives available? For example, are another community’s resources in close proximity? Are telehealth services available and appropriate for the health care needs of the population? Are there other barriers that may affect a community’s ability to access these alternatives — for example, geographic, technological, or transportation barriers?
A Word of Caution
We caution readers not to mistake correlation with cause-and-effect. Correlation means that two factors move in the same or opposite directions at the same time. Causality means that changes in one factor lead to changes in another. Establishing cause-and-effect requires more sophisticated research design — like statistical controls, experimental designs with random assignments or matching techniques, or longitudinal designs. (13) (14) Sometimes two data points may be correlated, but there is some other factor at play.
The Larger Picture
Health care access — along with health behaviors and physical, social, and economic environments — are all major drivers of health that are influenced by where we live. Our communities and neighborhoods can affect our access to the factors that influence health — including not only health care resources but also education, jobs, social support, transportation, and healthy foods.
The drivers of health are also complex and interconnected — affecting one another while also influencing our health and well-being. Social and economic factors, for instance, can impact our access to health care. As an example, Tennessee counties with higher median incomes tend to have more practicing primary care physicians per resident. (16) Greater income and wealth generally provide better access to medical care, nutritious food, safe neighborhoods and communities, opportunities for physical activity, and high quality education. (15)
Parting Words
The Tennessee Health Care Capacity Dashboard provides an introduction to some of the resources available across Tennessee. It is a starting point for understanding the state’s health care challenges and opportunities — one of the many complicated and interrelated factors that affect the health and prosperity of Tennesseans.
See the Appendix for a full list of sources, data definitions, and data notes for the Tennessee Health Care Capacity Dashboard.
References
Click to Open/Close
- University of North Carolina Rural Health Research Group. 102 Rural Hospital Closures: January 2010 to Present. March 27, 2019. Accessed on March 27, 2019 from https://www.shepscenter.unc.edu/programs-projects/rural-health/rural-hospital-closures/.
- Tennessee Department of Health. Joint Annual Report: Hospital Data for 2017. December 3, 2018. Accessed on January 28, 2019 from https://apps.health.tn.gov/publicjars/default.aspx.
- —. Joint Annual Report: Hospital Data for 2010. September 23, 2011. Accessed on February 28, 2019 from https://apps.health.tn.gov/publicjars/default.aspx.
- WRCBtv. Update: Copper Basin Medical Center Permanently Closes. October 25, 20017. https://www.wrcbtv.com/story/35388582/inpatient-services-suspended-at-copper-basin-medical-center-due-to-lack-of-funds.
- WBBJ. McKenzie Hospital Announces Plans to Close. July 27, 2018. https://www.wbbjtv.com/2018/07/27/breaking-mckenzie-hospital-announces-plans-to-close/.
- Cookeville Regional Medical Center. Closing of Cumberland River Hospital. January 25, 2019. https://crmchealth.org/closing-cumberland-river-hospital.
- Nelson, Kristi and Whetstone, Tyler. Tenova to Close Physicans Regional, Lakeway Regional Hospitals by End of Year. Knoxville News Sentinal. October 25, 2018. https://www.knoxnews.com/story/news/2018/10/25/knoxville-tennova-close-physicians-regional-lakeway-regional-hospitals-end-year/1762397002/.
- U.S. Census Bureau. Table PEPAGESEX. Annual Population Estimates as of July 1, 2017. 2018. Accessed on February 25, 2019 from https://factfinder.census.gov.
- Data provided by the Tennessee Hospital Association on February 27, 2019.
- Health Resources and Services Administration. Area Health Resource Files — County Level Data. [Online] July 2018. Accessed on February 25, 2019 from https://data.hrsa.gov/data/download.
- Robert Wood Johnson Foundation and University of Wisconsin Population Health Institute. 2018 Tennessee Data. 2018 County Health Rankings. 2018. Accessed from http://www.countyhealthrankings.org/app/tennessee/2018/downloads.
- Rural Health Information Hub. Healthcare Access in Rural Communities. January 18, 2019. Accessed on March 27, 2019 from https://www.ruralhealthinfo.org/topics/healthcare-access#primary-care.
- Bachman, Ronet. Chapter 5, Causation and Research Designs. The Practice of Research in Criminology and Criminal Justice, 3rd edition. Thousand Oaks, CA: Pine Forge Press. 2007. https://us.sagepub.com/sites/default/files/upm-binaries/14289_BachmanChapter5.pdf.
- Reiter, Jerome P. Using Statistics to Determine Causal Relationships. The American Mathematical Monthly, Institute of Statistics and Decision Sciences, Duke University. January 2000. http://www2.stat.duke.edu/~jerry/Papers/causal.pdf.
- Braveman, Paula, Egerter, Susan and Barclay, Colleen. Income, Wealth and Health. Exploring the Social Determinants of Health – Issue Brief #4, Robert Wood Johnson Foundation. April 2011. http:/www.lchc.org/wp-content/uploads/02_LCHC_EconJustice.pdf.
- The Sycamore Institute. Analysis of data from the 2012-2016 American Community Survey 5-year estimates and the 2017 County Health Rankings. https://www.sycamoreinstitutetn.org/how-socioeconomic-factors-affect-health/.