This report provides context for discussions about criminal justice reform, using historical data to reveal trends in Tennessee’s incarcerated and corrections populations. It focuses on community supervision, prison releases, and recidivism for state felony offenses, which fall under the jurisdiction of the Tennessee Department of Correction (TDOC).
Other reports in this series look at historical trends in Tennessee’s incarcerated and corrections populations, the budgetary aspects of incarceration in Tennessee, and pre-trial detention.
Key Takeaways
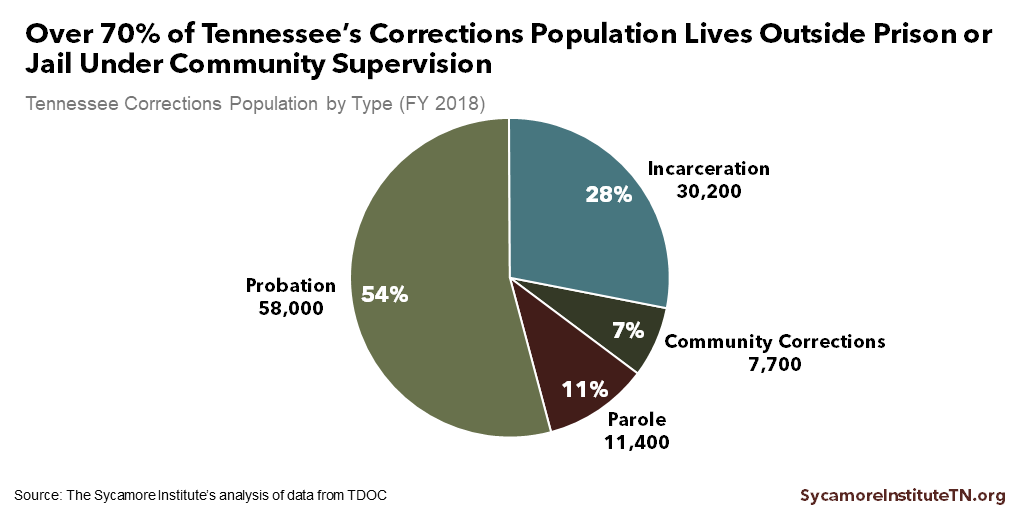
- 72% of Tennessee’s corrections population lived under community supervision in 2018 —58,000 on probation, 11,000 on parole, and 8,000 in the Community Corrections program.
- Each year, around 40% of entries to the state prisoner population are people going or returning to prison for violating community supervision requirements.
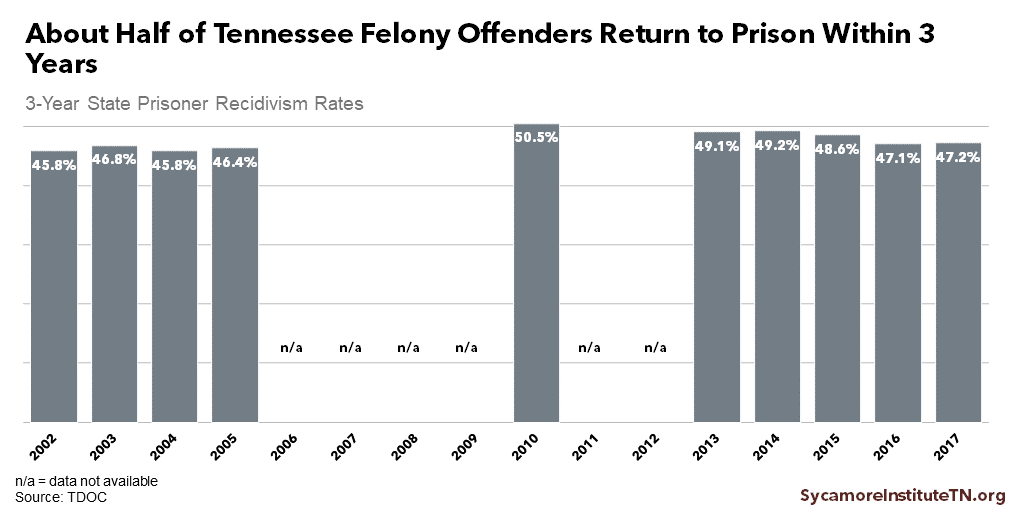
- About half of the state prisoners Tennessee releases each year return to prison within three years. From 2001-2005, recidivism was highest among those in Community Corrections and lowest for those whose sentences had expired.
- Expired sentences make up a growing share of state prisoner releases as the proportion of parole and probation releases falls.
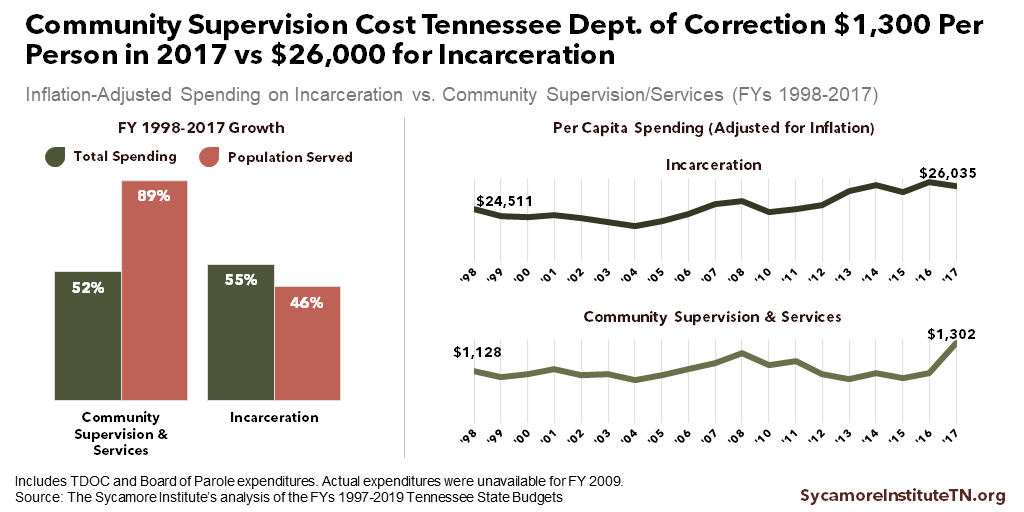
- Community supervision costs TDOC far less per offender than incarceration, and the number of people under community supervision has grown faster than related state spending.
What Happens Outside Prison Does Not Stay Outside Prison
The cycle of community supervision, release, and recidivism is a significant driver of the state prisoner population. Many current state prisoners were initially sentenced to supervision outside of prison or were previously released from prison.
Each year, around 40% of entries to Tennessee’s state prisoner population are people who violated probation, parole, or other community supervision (Figure 1). (7) While the populations overlap, violating community supervision requirements accounted for almost as many state prisoner entries in 2018 as all drug and violent offenses combined.
About half of the state prisoners Tennessee releases each year return to prison within three years (Figure 2). (2) (3) (4) Nationally, 95% of all state prisoners are eventually released. (5) In Tennessee, most are released into community supervision, and many will return to prison for committing new crimes or for violating the conditions of their release.
State prisoners — In this report, this term refers to inmates under the jurisdiction of the Tennessee Department of Correction (TDOC). These are convicted state felony offenders sentenced to reside in either state prisons or local jails.
State corrections population – In this report, this term refers to all convicted state felony offenders under TDOC jurisdiction. This includes state prisoners, state prisoners released into community supervision (i.e. probation, parole, or Community Corrections), and convicted state felony offenders sentenced to community supervision instead of incarceration.
Figure 1
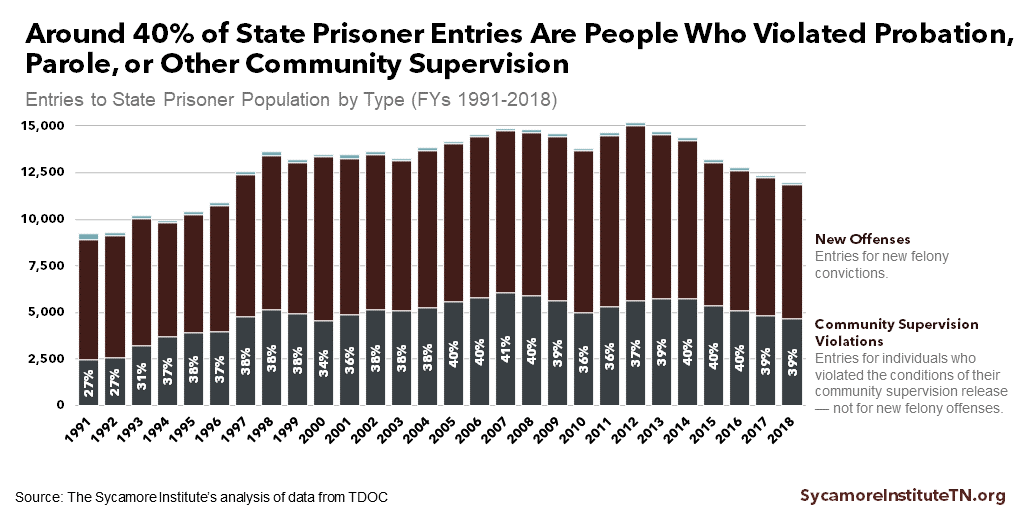
Figure 2
Community Supervision of Felony Offenders in Tennessee
About 72% of Tennessee’s state corrections population lived outside of prison or jail under community supervision in FY 2018 (Figure 3). (8) This group of more than 77,000 Tennesseans includes people sentenced to serve their entire time under community supervision and those released early from prison or jail.
Tennessee uses three types of community supervision — parole, probation, and Community Corrections. Each program varies in purpose, detail, and outcomes, but all are meant to provide an alternative to incarceration. (9)
People who fail to meet the conditions of their community supervision can have that status revoked and be imprisoned. Breaking these rules without committing a new felony is called a “technical violation.”
Figure 3
How Parole, Probation, and Community Corrections Work
Under parole, the state releases prisoners before their sentences expire to serve the remainder of their time in the community. Parole only becomes available after serving a portion of one’s sentence determined by state law, which varies by offense type. The Tennessee Parole Board, a seven-member panel appointed by the governor, decides who gets parole. People imprisoned for violating parole are re-incarcerated for the remainder of their unserved sentence.
With probation, a judge sentences newly convicted felony offenders to serve all or part of their time in the community. There are two levels of probation — regular and intensive — each with different levels of supervision and requirements. People imprisoned because they violated probation do not get credit toward their sentences for the time spent on probation.
Judges can also sentence non-violent felony offenders to Community Corrections, a program whose stated goal is “to reduce the probability of continued criminal behavior.” As of February 2019, there are 19 regional programs covering most counties in the state. (10) People incarcerated because they violated the terms of the Community Corrections program receive credit toward their sentences for the time spent in the program.
Each type of community supervision involves different levels of conditions and requirements. For example, these can include fees and fines, electronic monitoring, curfew checks, home visits, participation in treatment programs, employment, drug testing, and check-ins with supervision authorities.
Tennessee’s Community Supervision Population
The number of convicted felony offenders under community supervision in Tennessee peaked in 2015 (Figure 4). The relative size of the populations in each type of community supervision has changed little in the last two decades. In FY 2018, about 75% of people under community supervision were on probation, 15% on parole, and 10% in Community Corrections.
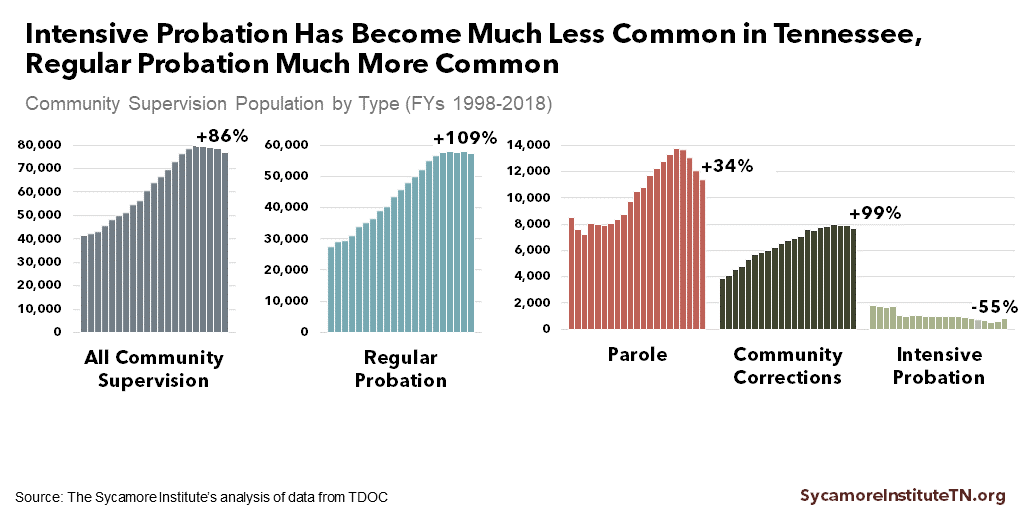
Intensive probation has become much less common and regular probation has become much more common (Figure 5). Overall, the community supervision population grew 86% from FYs 1998-2018 — with regular probation up 109%, Community Corrections up 99%, parole up 34%, and intensive probation down 55%. Over the same period, the state prisoner population rose 48%. Tennessee’s rate of community supervision (per 100,000 residents) was about 18% lower than the national rate in 2016 and ranked 24th highest among all states. (11)
Figure 4
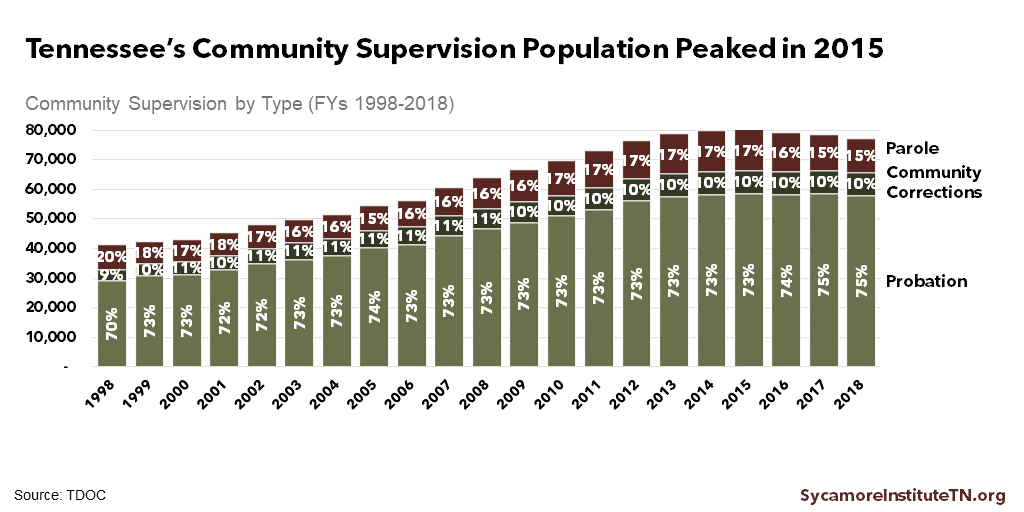
Figure 5
Release of State Prisoners in Tennessee
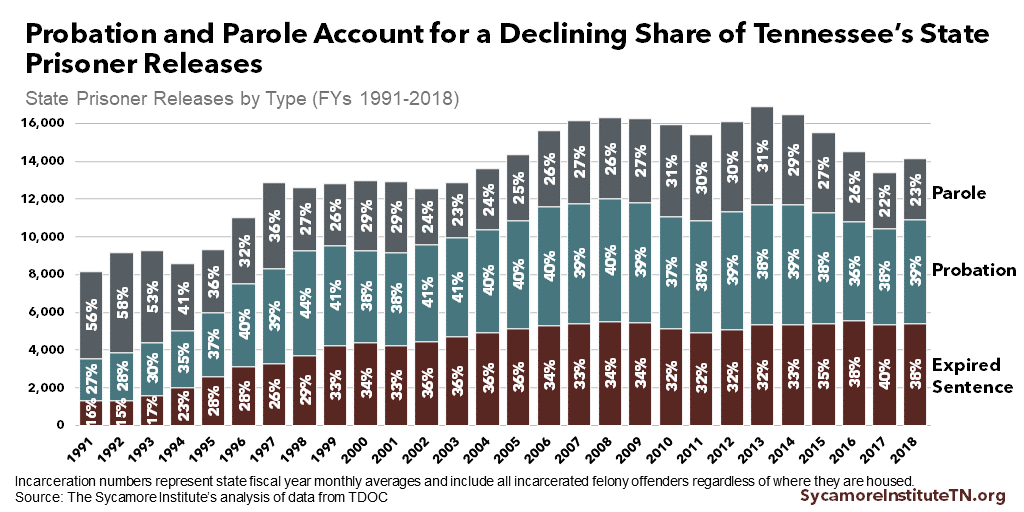
Over 14,000 state prisoner releases took place in 2018. Since 1991, annual releases have grown by 73% — compared with 129% growth in the total state prisoner population over the same period.
Releases into community supervision account for a declining share of all Tennessee state prisoner releases (Figure 6). (8) In FY 1991, people going into probation and parole accounted for 84% of all releases. By FY 2018, that proportion had fallen to 62%. Meanwhile, releases due to expired sentences make up a growing share of all releases, rising from 16% to 38% over the same period.
Figure 6
The majority of Tennessee state prisoners who get released each year are released from local jails (Figure 7). (12) (13) In FY 2018, local jails held about 27% of all state prisoners but handled 60% of state prisoner releases.
The total number of parole releases and the share of hearings that result in a parole release both peaked in 2012 (Figure 8). (8) The number of parole hearings declined by about 7% from FYs 2012-2018, while the approval rate fell from 40% to 24%. The result is a 46% decline in the number of parole releases during that period.
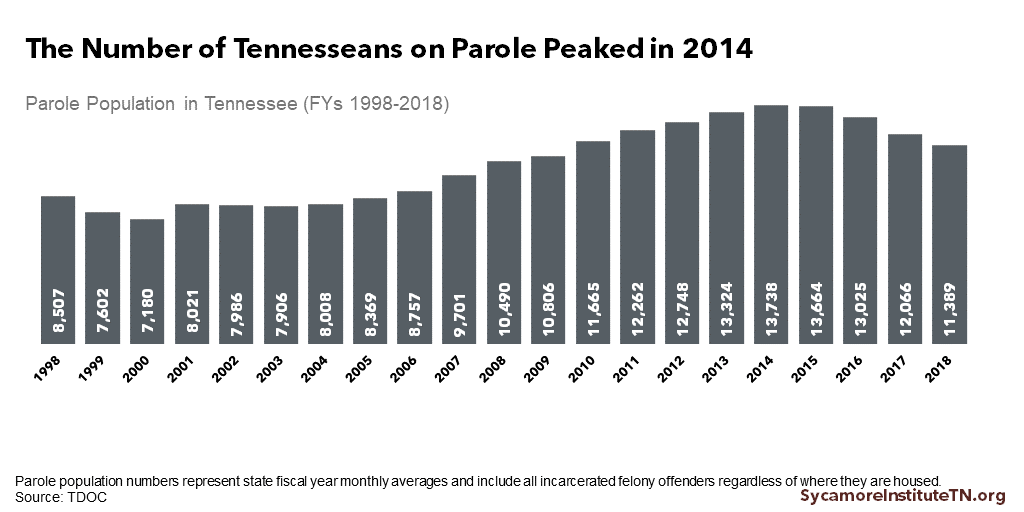
The number of Tennesseans on parole is falling as the number of releases granted by the Board of Parole has declined (Figure 9). The number of people on parole peaked in FY 2014 at 13,738. Over the next four years, the total number of parolees fell by roughly 17%.
Figure 7
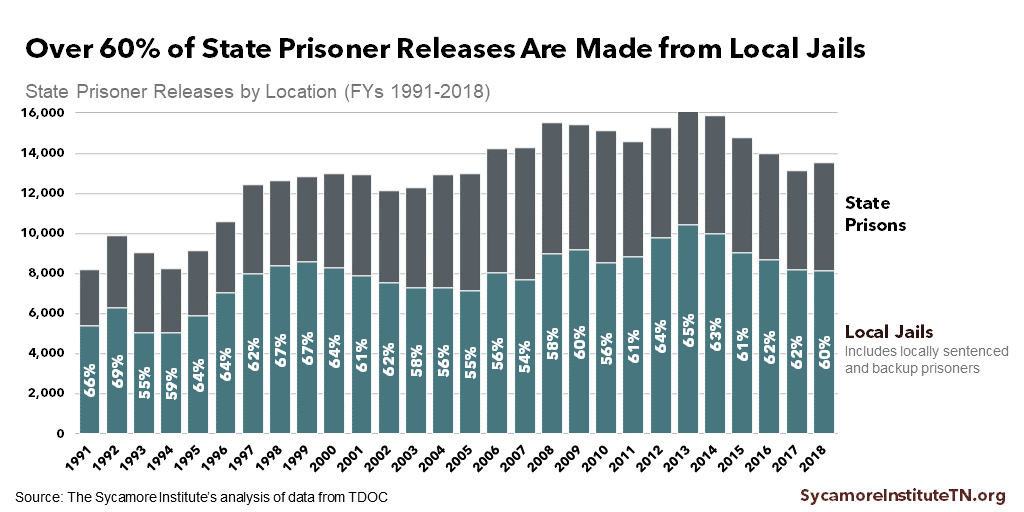
Figure 8
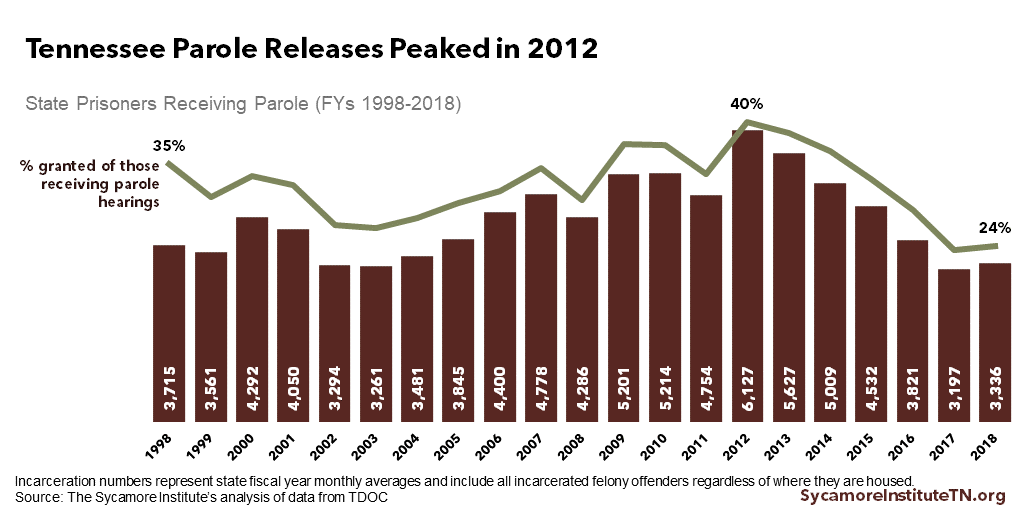
Figure 9
Recidivism Among Felony Offenders in Tennessee
Tennessee’s felony offender recidivism rate ranged from 45-51% between 2002 and 2017, although data on five of those years was not publicly available (Figure 2). (2) (3) (4) This metric includes state felony offenders who return to prison for new felony convictions or for violating community supervision requirements. The latter group accounts for around 40% of state prisoner entries each year (Figure 1). (7)
There are limited available data on several factors that might affect recidivism, so further research may be warranted. The next two paragraphs and charts focus on findings from TDOC’s detailed 2010 study of Tennessee felony offender recidivism. That study (the most recent available) provides three-year recidivism rates for 2001 to 2005.
State prisoners released from local jails had higher recidivism rates than offenders released from TDOC facilities, according to the TDOC study (Figure 10). (2) A subsequent report by the Tennessee Advisory Commission on Intergovernmental Relations (TACIR) notes that offenders housed in TDOC facilities typically have more access than those in local jails to health care services and programs that reduce the odds of recidivism. (14)
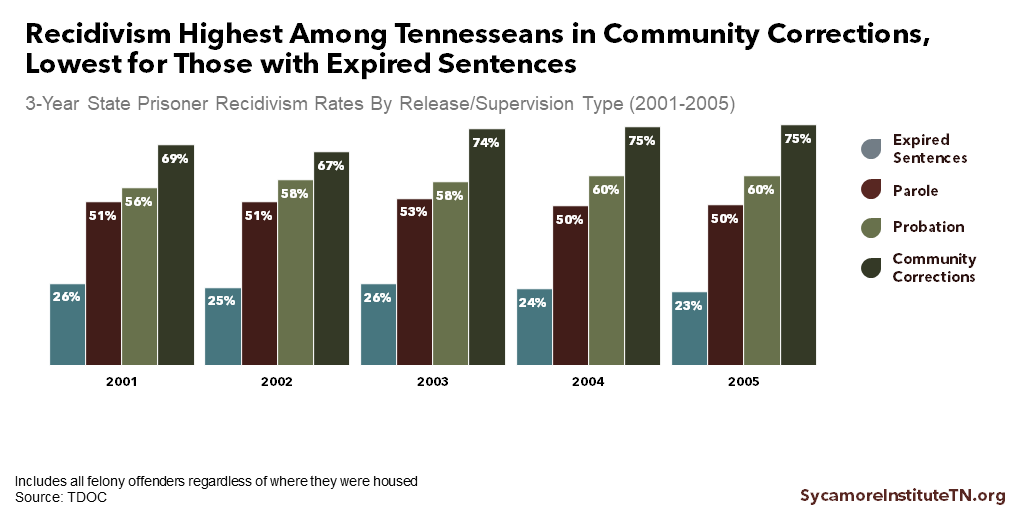
Recidivism rates were highest for people in the Community Corrections program and lowest for prisoners released when their sentences expired, according to the TDOC study (Figure 11). (2) For 2005, 23% of offenders released when their sentences expired were back in prison three years later compared to 75% in Community Corrections, 60% released on probation, and 50% of parolees.
Figure 10
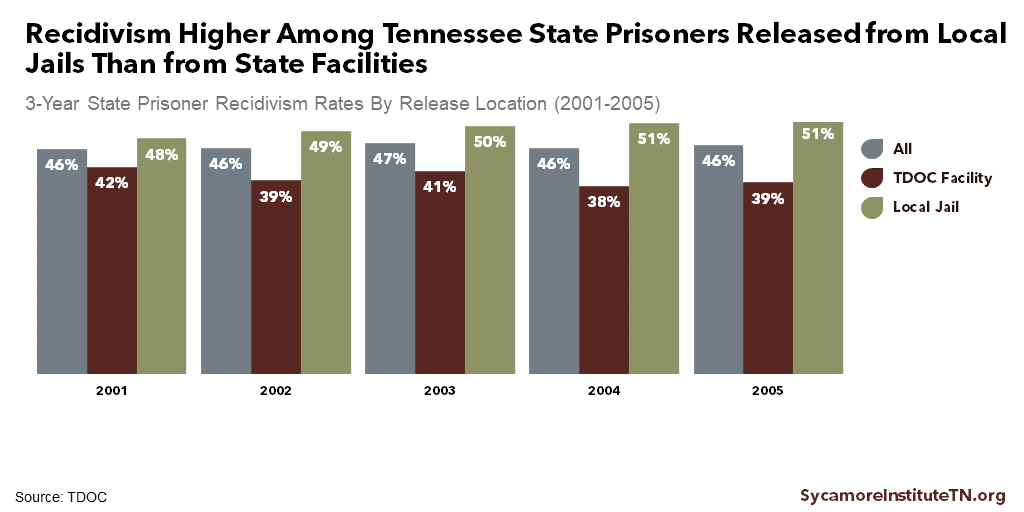
Figure 11
Community Supervision Costs TDOC Less Than Incarceration
Tennessee spent about $102 million in FY 2017 on community supervision and related services for about 77,000 people. (15) Meanwhile, TDOC also spent over 7.5 times as much to incarcerate a population that was 62% smaller. That year, community supervision and community-based services accounted for about 11% of Tennessee’s total spending on corrections.
The population under community supervision has grown faster than related state spending (Figure 12). (15) The community supervision population grew 89% from FYs 1998-2017, while inflation-adjusted spending on community supervision and services rose 52%. In contrast, Tennessee’s incarceration spending grew faster over the same period than the state prisoner population.
Over the last three years, Tennessee has made targeted investments in community supervision and services aimed at reducing prison entries for technical violations. Between FY 2016 and FY 2017 alone, total inflation—adjusted spending in this area grew 15%. This new, recurring spending largely reflects implementation of the Public Safety Act of 2016, which created a new graduated sanctions system for technical violations in lieu of re-incarceration. (15)
Figure 12
References
Click to Open/Close
- Tennessee Department of Correction (TDOC). Tennessee Felon Population Updates for 2002-2018. 2002-2018. Accessed from https://www.tn.gov/correction/statistics-and-information/felon-population-reports.html.
- Karpos, Dr. Mary, Gasiecki, Michael and Langston, Vanessa. Tennessee Department of Correction Recidivism Study Felon Releases 2001-2007. Tennessee Department of Correction. March 15, 2010. Accessed from http://nashvillepublicmedia.org/wp-content/uploads/2010/06/RecidivismStudy2001-2007.pdf.
- Tennessee Department of Correction (TDOC). Tennessee Recidivism Rate Shows Promising Decrease. April 20, 2017. https://www.tn.gov/correction/news/2017/4/20/tdoc-tennessee-recidivism-rate-shows-promising-decrease.html.
- —. Transparent TN: Public Safey. Accessed on January 4, 2019 from https://www.tn.gov/transparenttn/public-safety.html.
- Hughes, Timothy and Wilson, Doris James. Reentry Trends In The U.S. Bureau of Justice Statistics. [Online] 2004. https://www.bjs.gov/content/pub/pdf/reentry.pdf.
- Tennessee Department of Correction (TDOC). Tennessee Recidivism Rate Shows Promising Decrease. [Online] April 20, 2017. https://www.tn.gov/correction/news/2017/4/20/tdoc-tennessee-recidivism-rate-shows-promising-decrease.html.
- —. Transparent TN: Public Safey. Accessed on January 4, 2019 from https://www.tn.gov/transparenttn/public-safety.html.
- —. Tennessee Felon Population Updates for 2006-2018. [Online] 2006-2018. Accessed from https://www.tn.gov/correction/statistics-and-information/felon-population-reports.html.
- —. Types of Release. [Online] Accessed on January 10, 2019 from https://www.tn.gov/correction/cs/types-of-release.html.
- —. Community Corrections Program Directory. [Online] Accessed on February 27, 2019 from https://www.tn.gov/content/tn/correction/cs/types-of-release/community-corrections-program-directory.html.
- Bureau of Justice Statistics. Correctional Populations in the United States, 2016: Appendix Table 1. Estimated Number and Rate of Persons Supervised by U.S. Adult Correctional Systems, By Jurisdiction and Correctional Status, 2016. April 26, 2018. Data downloaded on January 16, 2019 from https://www.bjs.gov/index.cfm?ty=pbdetail&iid=6226.
- Tennessee Department of Correction (TDOC). Statistical Abstract for FYs 2008-2018. 2008-2018. Accessed from https://www.tn.gov/correction/statistics-and-information/annual-reports.html.
- —. Tennessee Department of Correction Annual Report for FYs 2003-2007. 2003-2007. Accessed from https://www.tn.gov/correction/statistics-and-information/annual-reports.html.
- Tennessee Advisory Commission on Intergovernmental Relations (TACIR). Housing Tennessee’s Convicted Felons: Improving Outcomes while Balanacing State and County Needs. 2017. https://www.tn.gov/content/dam/tn/tacir/documents/2017HousingTNConvictedFelons.pdf.
- State of Tennessee. Tennessee State Budgets for FY 1999-2000 through FY 2018-2019. Accessed from https://www.tn.gov/finance/fa/fa-budget-information/fa-budget-archive.html.
Featured image by Chattanooga Endeavors, Inc.