
This report provides context for discussions about criminal justice reform, using historical data to reveal trends in Tennessee’s incarcerated and corrections populations. It focuses on state prisoners, who fall under the jurisdiction of the Tennessee Department of Correction (TDOC).
A companion report looks at the budgetary aspects of incarceration in Tennessee. Two additional reports will focus on community supervision, prison releases, and recidivism as well as pre-trial incarceration.
Key Takeaways
- Tennessee’s state felony incarceration rate grew 68% from FY 1991-2018. Trends in state incarceration and crime rates vary significantly by offense type.
- State prisoners are disproportionately black, although the proportion of black inmates is falling. White women are the fastest growing segment of state prisoners.
- The state prisoner population is getting older, which could affect the state budget since older individuals tend to incur more medical expenses.
- In FY 2018, Tennessee housed 73% of its incarcerated felons in state prisons and 27% in local jails. The majority of state prisoners in local jails are waiting for space in a state facility.
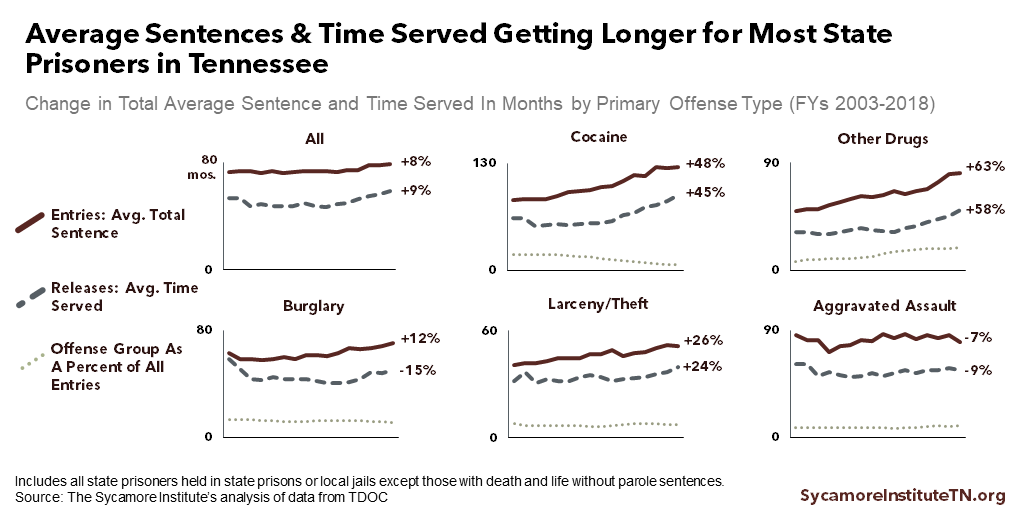
- Average sentences and time served are getting longer for most offense types, especially drug offenders who make up a growing share of incarcerations.
Where Are Tennesseans Incarcerated?
Tennesseans are incarcerated in federal, state, and local facilities depending on offense type (i.e. federal crimes and state felonies and misdemeanors) (Figure 1). In 2018, Tennessee’s state prisons held 22,130 individuals for state felony offenses. Local Tennessee jails held about 30,180 for state felonies and misdemeanors and federal crimes, and 8,080 were in federal facilities around the country for federal crimes. (1) (2) (3)
Tennessee and its local jurisdictions incarcerated 773 people for every 100,000 Tennesseans in 2018. Including federal inmates, about 892 people were incarcerated for every 100,000 Tennesseans. (1) (2) (3) (4)
Tennessee has some of the highest crime and incarceration rates in the nation. In 2016, Tennessee had the 4th highest violent crime rate, the 15th highest property crime rate, and the 11th highest combined state and local incarceration rate. [i] (5) (6) Although national drug crime data are less reliable, statistics suggest that Tennessee is among the top 10 states for drug-related arrests. (7)
This report focuses on state prisoners (individuals convicted of state felonies) housed in both state prisons and local jails who are under TDOC’s jurisdiction.
State prisoners, felony incarcerations, and state incarcerations — In this report, these terms refer to inmates under the jurisdiction of the Tennessee Department of Correction (TDOC). These are convicted state felony offenders sentenced to reside in either state prisons or local jails.
Figure 1
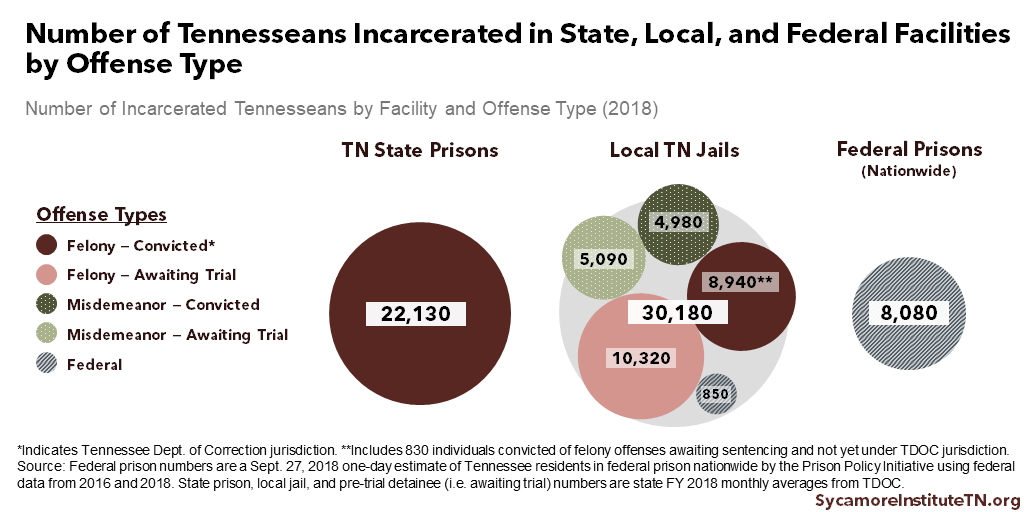
Population Incarcerated by the TN Department of Correction (TDOC)
TDOC has jurisdiction over state prisoners, and the department houses these inmates in either state prisons or local jails.
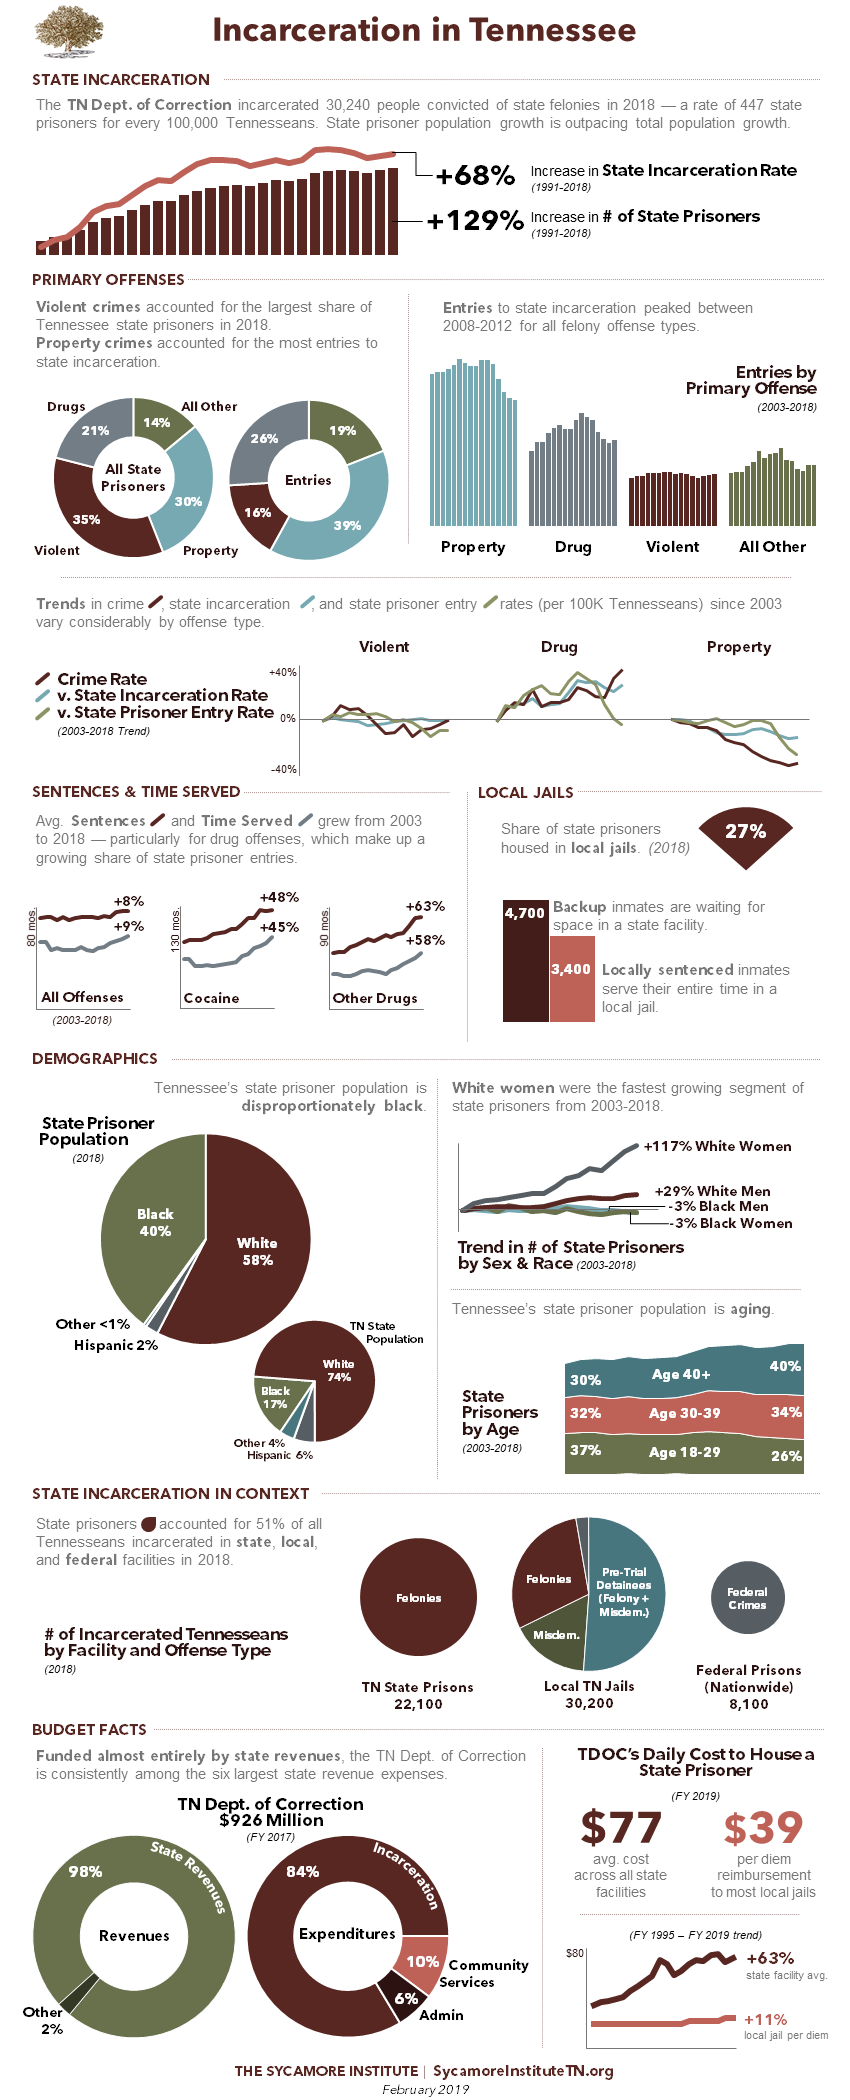
Tennessee incarcerated 30,240 state prisoners in FY 2018, or about 447 people for every 100,000 Tennesseans[ii] (Figure 2). (2) (8) Compared to FY 1991, the number of individuals incarcerated by TDOC more than doubled (129%), resulting in a 68% higher state incarceration rate. (9) (4) (10)
Time Periods and Trends
This report largely relies on publicly available data from the Tennessee Department of Correction. The time period of each analysis varies based on the availability of data. In general, Year 1 is the earliest year with data available for all metrics.
In some analyses, we use trends to compare measures with very different nominal values. For example, Figure 2 shows Tennessee held about 29,000 state prisoners in 2016. Nationally, there were 1.3 million state prisoners that year. Displaying the national data as a trend line shows that Tennessee’s state prisoner population grew about 20% faster than the nation’s from 1991 to 2016.
Figure 2
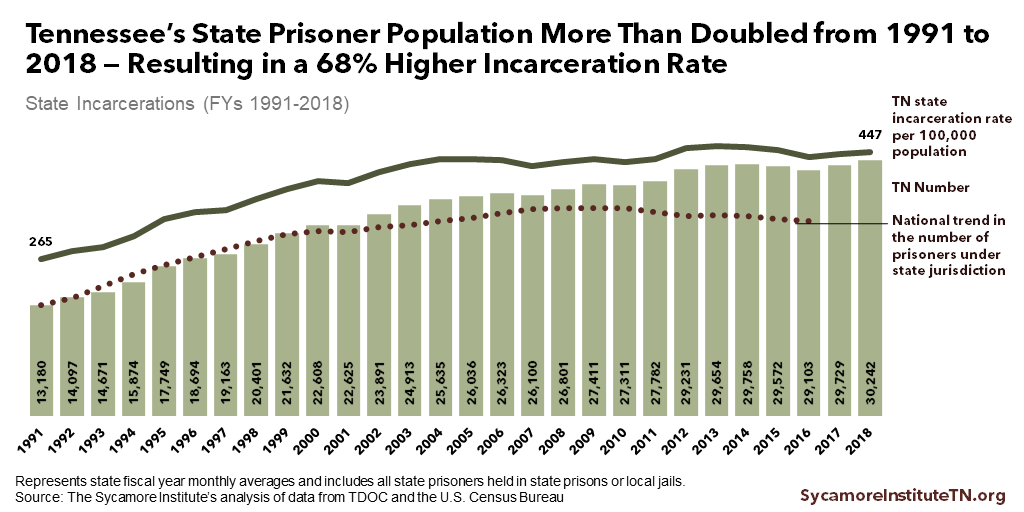
Figure 3
Offense Types Among Tennessee’s State Prisoner Population
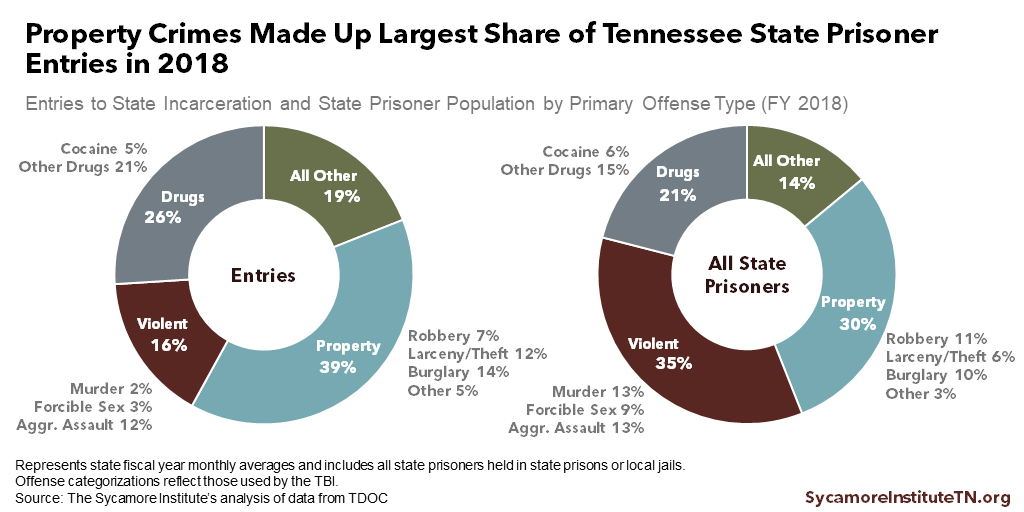
Property crimes accounted for the largest share of entries to state incarceration (39%) and the second largest share of all state prisoners (30%) in FY 2018 (Figure 3). Although violent offenses made up a much smaller portion of annual entries (16%), they garner longer sentences and were the largest share of the total state prisoner population (35%). (11) (12)
Offense Types Among Entries to State Incarceration
Entries to state incarceration peaked between FY 2008-2012 for all felony offense types (Figure 4). (11) (12) In FY 2018, drug and property crime entries were down 24% since peaking in FY 2012 and FY 2008, respectively. Violent crime entries were down 5% from their peak in FY 2009, and all other entries were down 21% from their FY 2012 peak. Compared to FY 2003, however, drug, violent, and other offense entries in FY 2018 were all up. Only property offense entries were down.
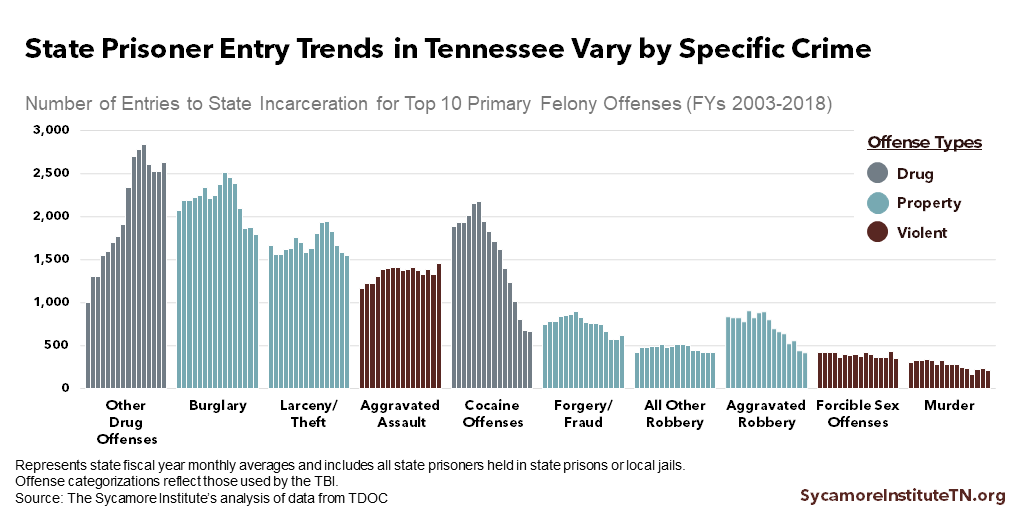
Entry trends for specific crimes varied considerably within these offense categories (Figure 5). (11) (12) For example, entries for cocaine-related crimes were down 70% in FY 2018 from their FY 2008 peak. Entries for all other drug offenses were up 163% from FY 2003 but down 7% from their FY 2014 peak. Among violent offenses, entries for murder were down 38% from their FY 2006 peak, while entries for aggravated assault were up 26% since FY 2003.
Figure 4
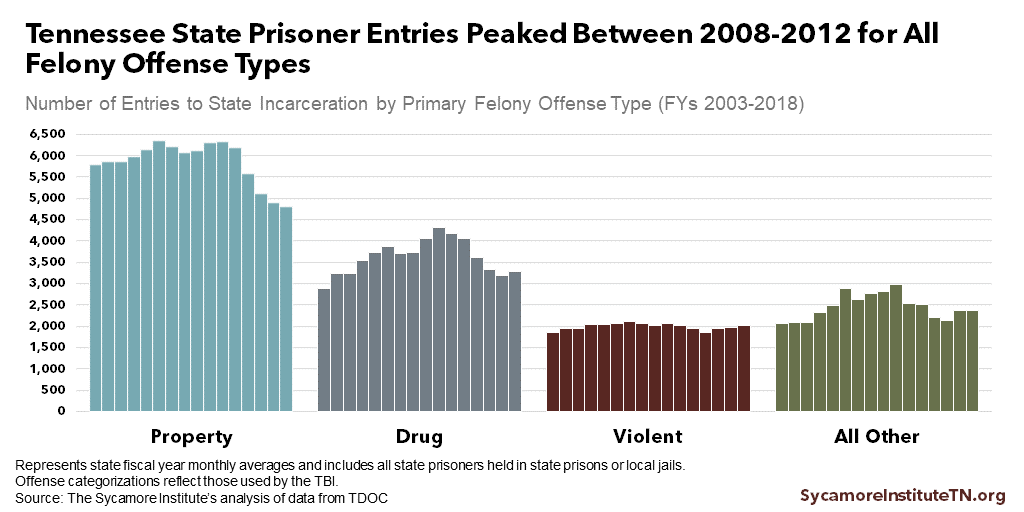
Figure 5
Offense Types Among All State Prisoners
Drug-related offenses account for a growing share of the state prisoner population, rising from 17% in FY 2003 to 21% in FY 2018 (Figure 6). (9) Driving this trend are the increase in entries for drug-related offenses and longer sentences (discussed later). (11) (12) Over the same period, the share of state prisoners incarcerated for property crimes fell from 37% to 30%.
State Incarceration by Offense Type in Context
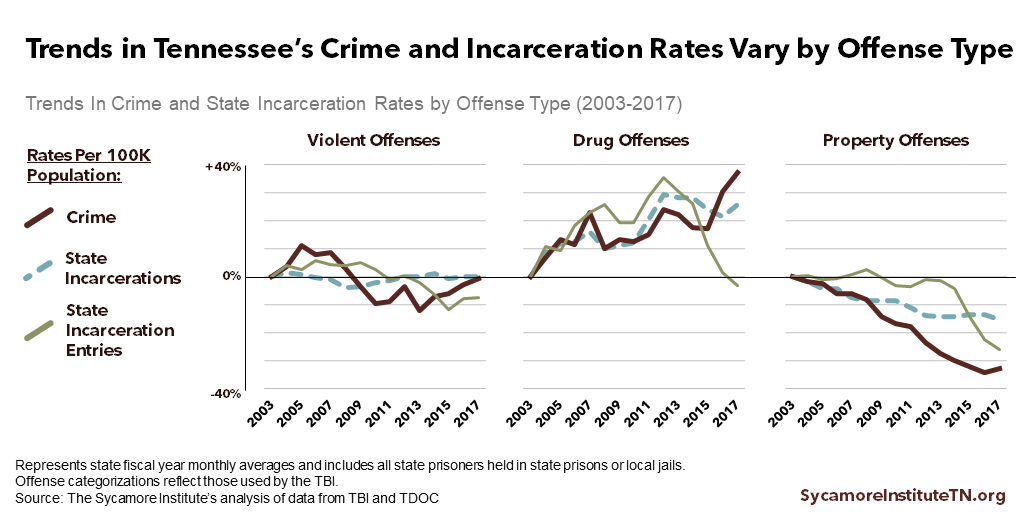
Trends in state incarceration and crime rates differ significantly by offense type — with property offenses seeing the sharpest drops from 2003 to 2017 (Figure 7). (13) (12)
- Violent Offenses: Tennessee’s violent crime rate fluctuated but ultimately fell 1% during this period. The rate of state prisoner entries for violent offenses fell 7%, and the state incarceration rate for violent offenses remained level.
- Drug Offenses: Tennessee’s drug crime rate grew 37% during this period. The rate of state prisoner entries for drug offenses experienced sharp growth in some years but ultimately fell 3%. The state incarceration rate for drug offenses increased by 26%.
- Property Offenses: Tennessee’s property crime rate dropped 33% during this period. The rate of state prisoner entries for property offenses fell 26%, and the state incarceration rate for property offenses declined by 13%.
Figure 6
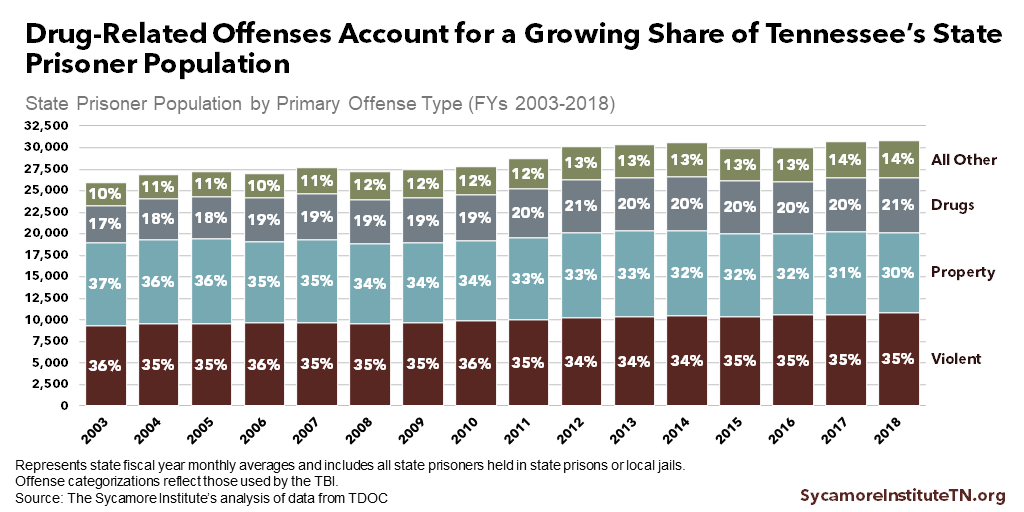
Figure 7
Demographics of Tennessee’s State Prisoner Population
Tennessee’s state prisoner population is disproportionately black (Figure 8). (11) (12) (8) Black Tennesseans make up about 17% of the state’s population but are 40% of its state prisoners. While still high, the proportion of black inmates is falling — down from almost half of the incarcerated population in 2003.
Despite recent declines, black men continue to have the highest rates of incarceration in Tennessee. (11) (8) For every 100,000 black men in Tennessee, about 2,200 are incarcerated for a felony — a rate about 3.5 times that of white men.
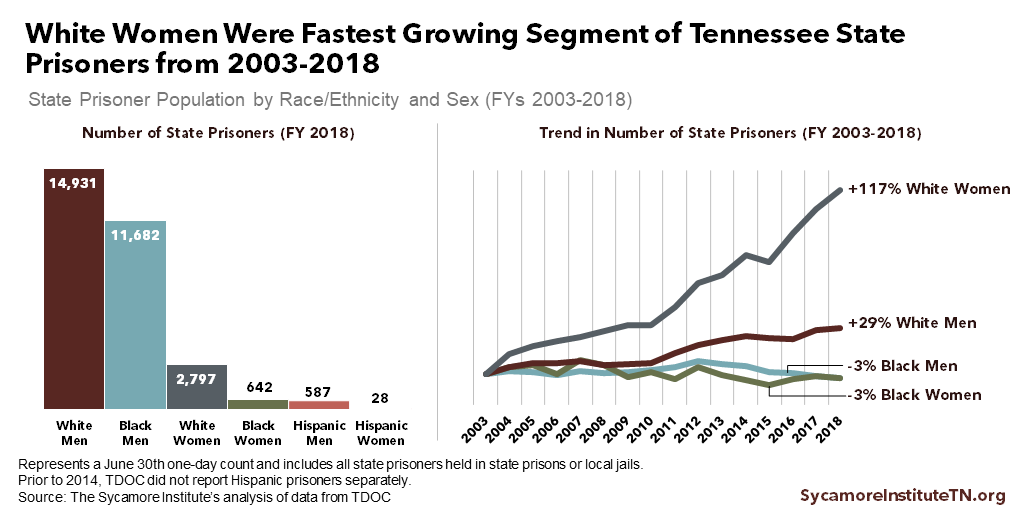
In the last 15 years, white women have been the fastest growing segment of Tennessee’s state prisoners (Figure 9). (12) (11) The number of incarcerated white women increased 117% from FY 2003-2018, compared to 29% growth for white men (who also had the largest nominal increase). Over the same period, inmate populations for both black men and black women fell 3%. Since FY 2014, when TDOC began to report Hispanic prisoners separately, incarcerations are up 4% for Hispanic men and down 13% for Hispanic women.
Figure 8
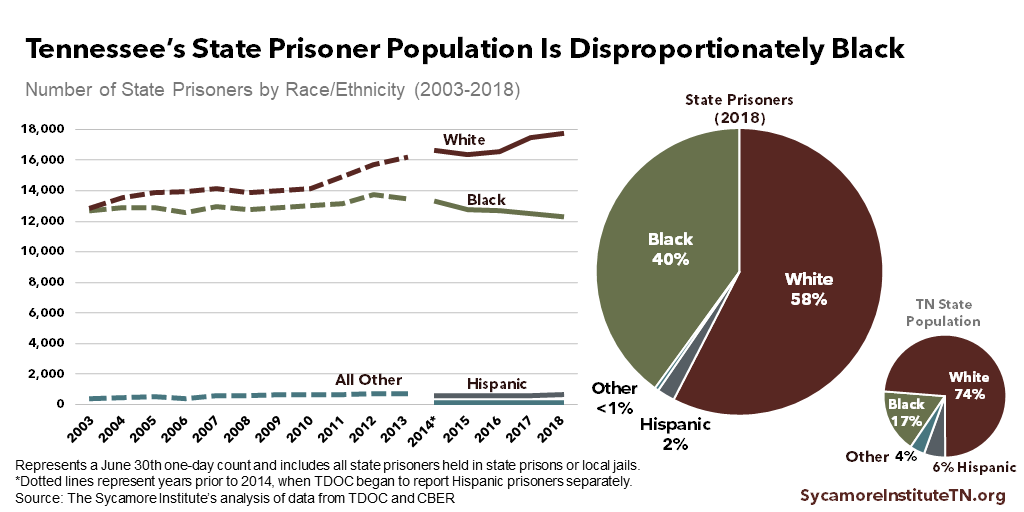
Figure 9
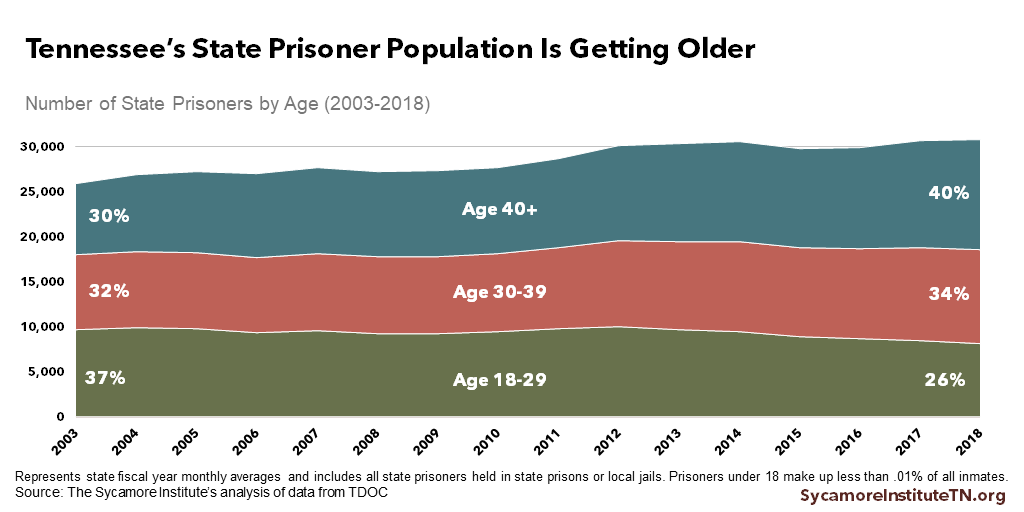
Tennessee’s incarcerated felon population is getting older (Figure 10). (12) (11) While younger on average than other Tennesseans, the prison population is aging as the country ages. The share of incarcerated felons in Tennessee age 40+ grew from 30% in 2003 to 40% in 2018. In the last five years alone, the number of inmates age 65+ grew by 20%.
The aging of Tennessee’s prison population has implications for the state budget. (12) (11) Older individuals tend to incur more medical expenses, and states are constitutionally required to provide inmates with adequate health care. (14) (15)
Figure 10
Where Tennessee State Prisoners Are Held
Tennessee housed 73% of its incarcerated felons in state prisons and 27% in local jails in FY 2018 (Figure 11). (9) The state prison system includes 14 facilities — 10 managed directly by TDOC and four operated under contract. Of the 22,130 felony offenders housed in state prisons in FY 2018, about one-third were in the four privately operated prisons. (16) Local jails housing state prisoners get a per diem reimbursement from the state.
In 2015, Tennessee had the nation’s 3rd highest rate of state prisoners housed in local jails. (17) However, the number of state prisoners held in local jails has grown slower than the number housed in state facilities since FY 1991.
State Prisoners Housed in Local Jails
TDOC houses state prisoners in local jails as a way to manage overcrowding in state facilities. (17) This inmate population is divided into “backup” and “locally sentenced” prisoners.
- Backup prisoners are sentenced to serve their time in state facilities but reside in local jails due to lack of available bed space. The number of backup prisoners grew 168% from FY 1995-2018, while the total number of state prisoners in local jails increased by 62% (Figure 11). (9)
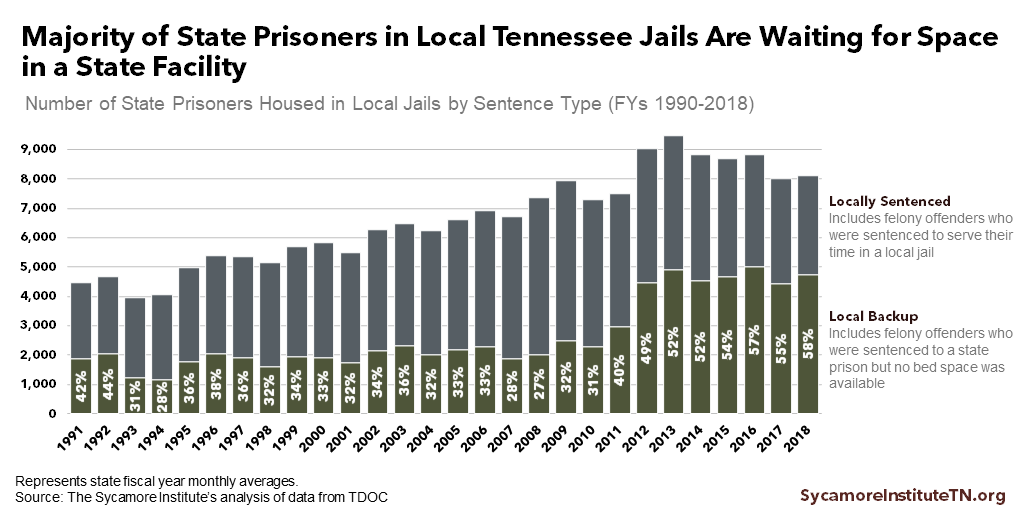
- Locally sentenced prisoners are intended to serve all of their time in local jails. These prisoners typically have sentences shorter than six years and are eligible to serve them in local jail per state law or contractual arrangement between TDOC and local facilities.(18) (17)
The majority of state prisoners in local jails are waiting for space in a state facility (Figure 12). (17) That has not always been true. Backup prisoners grew from 28% of all locally-housed state prisoners in FY 1994 to 58% in FY 2018.
In FY 2018, backup prisoners had an average sentence of 11 years compared to 5 years for locally sentenced prisoners and 17 years for prisoners in state facilities. (11)
Figure 11
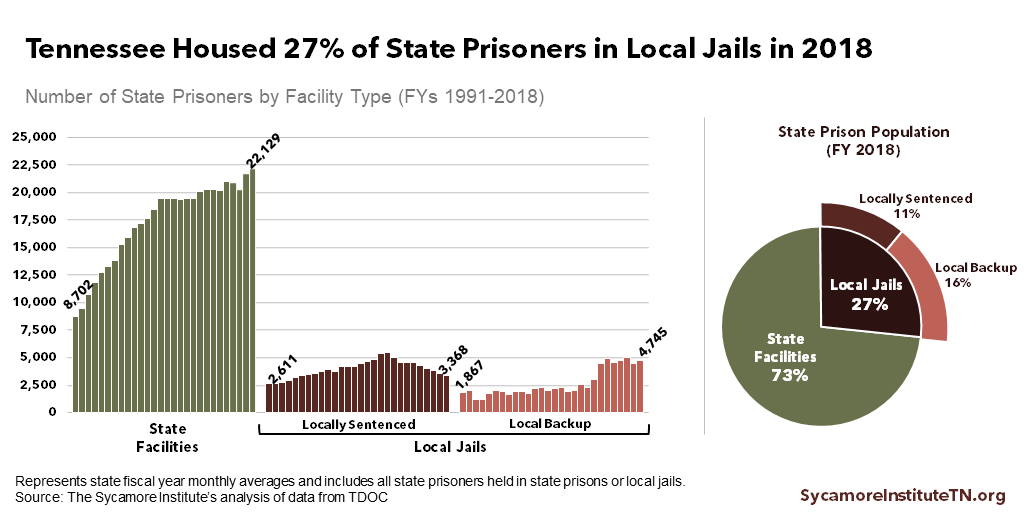
Figure 12
Sentences and Time Served for Tennessee’s State Prisoners
For most offense types, sentences and time served got longer in the last 15 years — especially drug-related felonies that make up a growing share of prison entries (Figure 13). (12) (11) For example, the average total sentence for non-cocaine-related drug offenses grew 63% between FY 2003-2018 — from 50 months to 82 months. The average time served by those inmates rose 58% — from 32 months to 50 months. Meanwhile, non-cocaine-related drug offenders grew from 8% of all TDOC entries to 21% over that period (Figure 5).
A growing share of state prisoners are required to serve at least 85% of their sentences. (11) (12) Often referred to as truth-in-sentencing, these requirements apply to a relatively small share of prison entries each year. Over the last 15 years, entries under this requirement ranged from 2.0% of all prisoner admissions in FY 2007 to 3.5% in FY 2017. However, the share of all state prisoners with this requirement grew from about 9% in FY 2003 to 16% in FY 2018.
Figure 13
Footnotes
[i] “Violent crime” includes murder, forcible rape, and aggravated assault. “Property crime” includes burglary, robbery, larceny, and motor vehicle theft. “Drug crime” includes drug and narcotic violations. These are the same categorizations used by the Tennessee Bureau of Investigation’s (TBI) Theme-Oriented Public Site (TOPS).
[ii] Throughout this report, we report many measures as rates per 100,000 population. For example, the state and local incarceration rate of 773 means that Tennessee held 773 people in state prisons and local jails for every 100,000 Tennesseans. Rates allow for comparisons over time that take into consideration changes in the state’s population.
References
Click to Open/Close
- Prison Policy Initiative. Correctional Control 2018: Incarceration and Supervision by State. 2018. https://www.prisonpolicy.org/reports/correctionalcontrol2018_data_appendix.html.
- Tennessee Department of Correction (TDOC). Tennessee Felon Population Update: Nov 2018. 2018. https://www.tn.gov/content/dam/tn/correction/documents/FelonNovember2018.pdf.
- —. Tennessee Jail Summary Report: November 2018. [Online] 2018. Accessed from https://www.tn.gov/content/dam/tn/correction/documents/JailNovember2018.pdf.
- U.S. Census Bureau. Annual Estimates of the Resident Population for the United States, Regions, States, and Puerto Rico: April 1, 2010 to July 1, 2018. December 2018. Data downloaded from https://www.census.gov/newsroom/press-kits/2018/pop-estimates-national-state.html.
- Federal Bureau of Investigation (FBI). Crime Data Explorer: Summary (SRS) Data with Estimates (1995-2017). September 24, 2018. Downloaded from https://crime-data-explorer.fr.cloud.gov/downloads-and-docs on Jan 8, 2019.
- Bureau of Justice Statistics (BJS). Correctional Populations in the United States, 2016: Appendix Table 1. Estimated Number and Rate of Persons Supervised by U.S. Adult Correctional Systems, By Jurisdiction and Correctional Status, 2016. Apr 26, 2018. Data downloaded from https://www.bjs.gov/index.cfm?ty=pbdetail&iid=6226 on Jan 16, 2019.
- Federal Bureau of Investigation (FBI). Table 69: Arrests by State. Crime in the U.S. 1999-2017. Accessed from https://ucr.fbi.gov/crime-in-the-u.s on Jan 30, 2019.
- University of Tennessee Boyd Center for Business and Economic Research (CBER). Tennessee State Data Center Population Projections for 2018. Sept 2018. Accessed from http://tndata.utk.edu/sdcpopulationprojections.htm on Jan 3, 2019.
- Tennessee Department of Correction (TDOC). Tennessee Felon Population Updates for 2000-2018. 2000-2018. Accessed from the Tennessee Department of Correction and https://www.tn.gov/correction/statistics-and-information/felon-population-reports.html.
- U.S. Census Bureau via the Bureau of Economic Analysis (BEA). Midyear Population Estimates. Sept 25, 2018. Accessed from https://apps.bea.gov/itable/index.cfm.
- Tennessee Department of Correction (TDOC). Statistical Abstract for FYs 2008-2018. 2008-2018. Accessed from https://www.tn.gov/correction/statistics-and-information/annual-reports.html.
- —. Tennessee Department of Correction Annual Report for FYs 2003-2007. 2003-2007. Accessed from https://www.tn.gov/correction/statistics-and-information/annual-reports.html.
- Tennessee Bureau of Investigation (TBI). Tennessee Incident Based Reporting System (TIBRS) Crime Data. 2019. Accessed via https://crimeinsight.tbi.tn.gov/public/Browse/browsetables.aspx on Jan 3, 2019.
- McKillop, Matt and Boucher, Alex. Aging Prison Populations Drive Up Costs. Pew. Feb 20, 2018. https://www.pewtrusts.org/en/research-and-analysis/articles/2018/02/20/aging-prison-populations-drive-up-costs.
- Bell, Ellyon, et al. Managing Prison Health Care Spending. Pew Charitable Trusts and John D. and Catherine T. MacArthur Foundation. Oct 2013. http://www.pewtrusts.org/~/media/legacy/uploadedfiles/pcs_assets/2014/pctcorrectionshealthcarebrief050814pdf.pdf.
- State of Tennessee. Tennessee State Budget for FY 2018-2019. 2018. https://www.tn.gov/finance/fa/fa-budget-information/fa-budget-archive/fa-budget-publication-2018-2019.html.
- Tennessee Advisory Commission on Intergovernmental Relations (TACIR). Housing Tennessee’s Convicted Felons: Improving Outcomes while Balanacing State and County Needs. 2017. https://www.tn.gov/content/dam/tn/tacir/documents/2017HousingTNConvictedFelons.pdf.
- State of Tennessee. TN Code § 40-35-104(b)(1) (2017). https://law.justia.com/codes/tennessee/2017/title-40/chapter-35/part-1/section-40-35-104/.
- Tennessee Department of Correction (TDOC). Tennessee Jail Summary Reports for 2000-2018. 2000-2018. Accessed from https://www.tn.gov/correction/statistics-and-information/jail-summary-reports.html.
Featured photo at top by Thomas Hawk


