The U.S. Census Bureau released new data in September on income, poverty, education, and health insurance coverage in 2019. These metrics paint a picture of the social and economic circumstances across America in the final year of a historically long period of economic growth. For years to come, they will serve as a baseline to measure many of the coronavirus recession’s short- and long-term effects.
Here’s what stands out from the estimates of Tennesseans’ education levels in 2019.
Key Takeaways
- An estimated 36.0% of Tennesseans age 25+ had at least an associate’s degree last year, and 28.7% had a bachelor’s or more – both higher than past years but lower than the national rate.
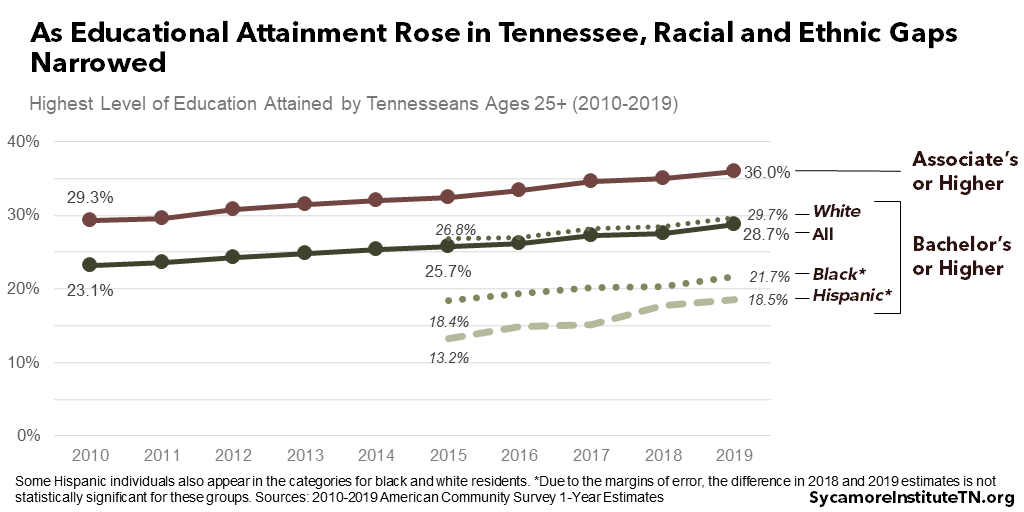
- Differences in post-secondary education rates among white, black, and Hispanic Tennesseans are shrinking, but significant gaps remain.
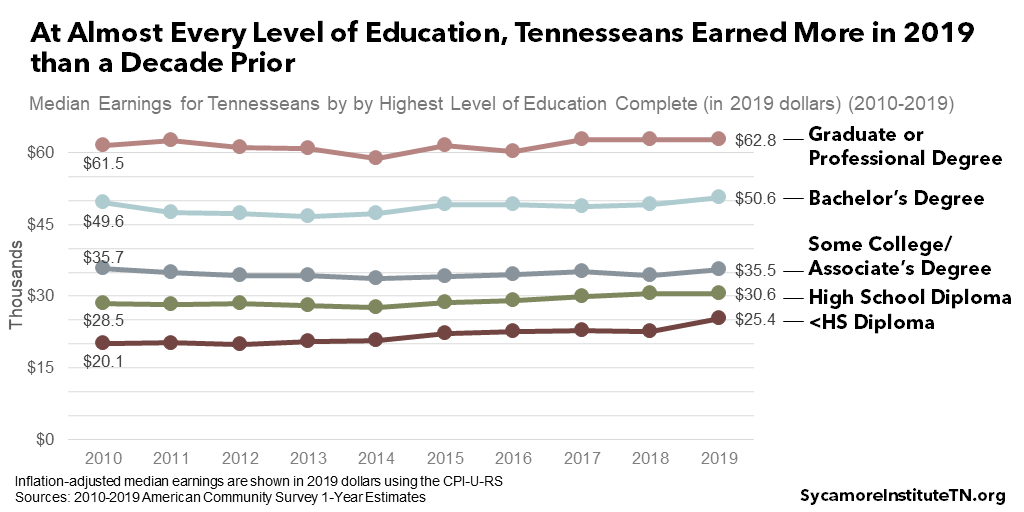
- Over the last decade, median earnings have grown for Tennesseans at almost every level of education after adjusting for inflation.
Education Levels in Tennessee
Tennessee’s recent upward trend in the share of residents with post-secondary degrees continued into 2019, though it remains lower than the national rate. An estimated 36.0% of Tennesseans 25 and older had at least an associate’s degree last year, and 28.7% had a bachelor’s degree or higher (Figure 1). Both metrics have risen in recent years (Figure 2). (1) Meanwhile, state policymakers have also sought to increase the number of Tennesseans with technical degrees and certifications. However, the American Community Survey does not collect information on those credentials.
Demographic and Geographic Variation
Differences in post-secondary education rates by race and ethnicity are shrinking, but significant gaps remain (Figure 2).[i] (1) From 2015 to 2019, the share of Tennesseans with at least a bachelor’s increased the most among Hispanics (up 5.3 percentage points), followed by black residents (up 3.3 points), and then white residents (up 2.9 points). Despite this progress, 19% of Hispanics and 22% of black Tennesseans had a bachelor’s or higher, compared to 30% of white residents.
Figure 1
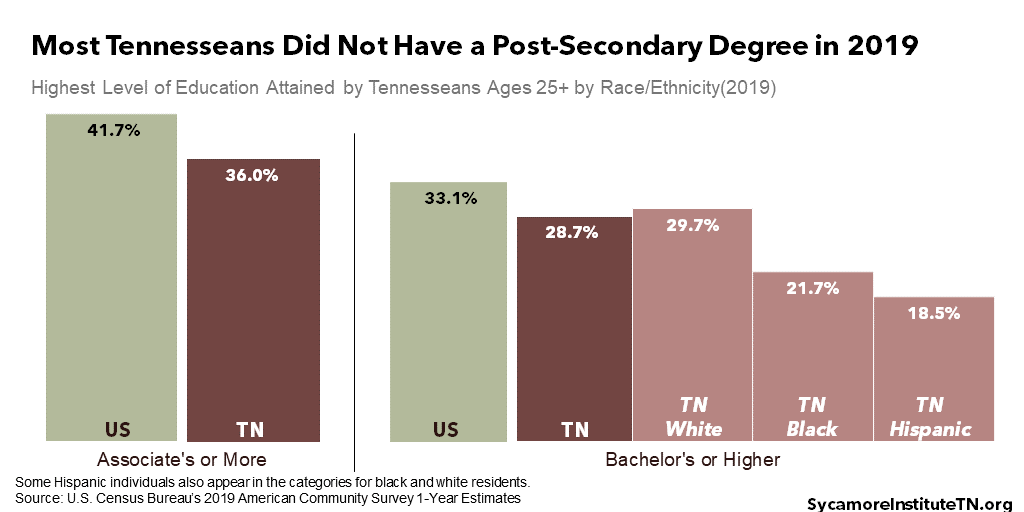
Figure 2
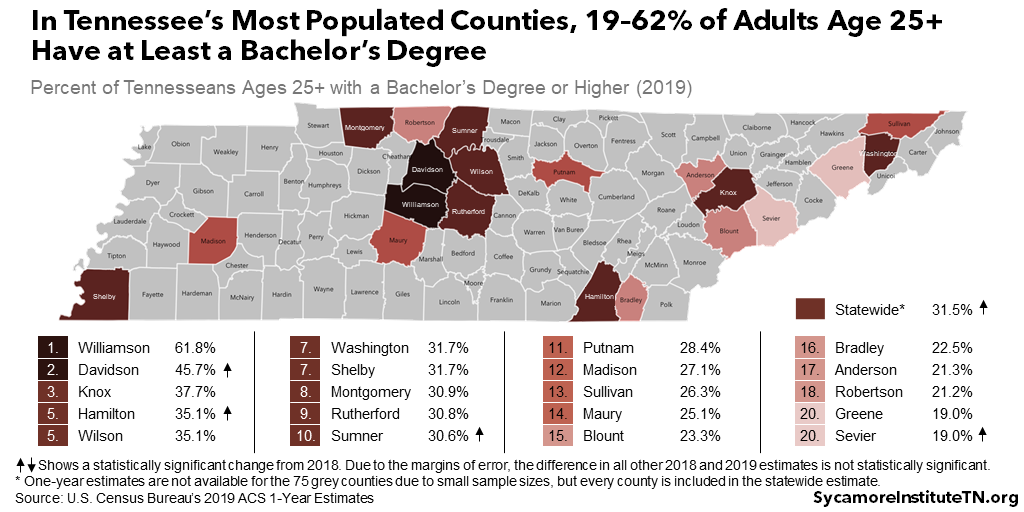
Rates of post-secondary education in Tennessee also vary by geography. The Census Bureau’s September data release also includes 2019 estimates for counties with populations above 65,000. Among the 20 Tennessee counties with available data (2):
- Associate’s Degree or More — The share of adults 25 and older with at least an associate’s degree ranged from 67.5% in Williamson County to 25.3% in Greene County (Figure 3). The share increased in Washington County and fell in Bradley, Blount, and Robertson Counties. Due to the margins of error, the difference in all other 2018 and 2019 estimates is not statistically significant.
- Bachelor’s Degree or More — Residents with bachelor’s degrees or more varied from 61.8% in Williamson County to 19.0% in Greene and Sevier Counties (Figure 4). Four counties saw a statistically significant increase from 2018: Davidson, Hamilton, Sevier, and Sumner.
See Table A1 in the Appendix for complete 2018-2019 county data and this link for a detailed breakdown for Shelby County.
Figure 3
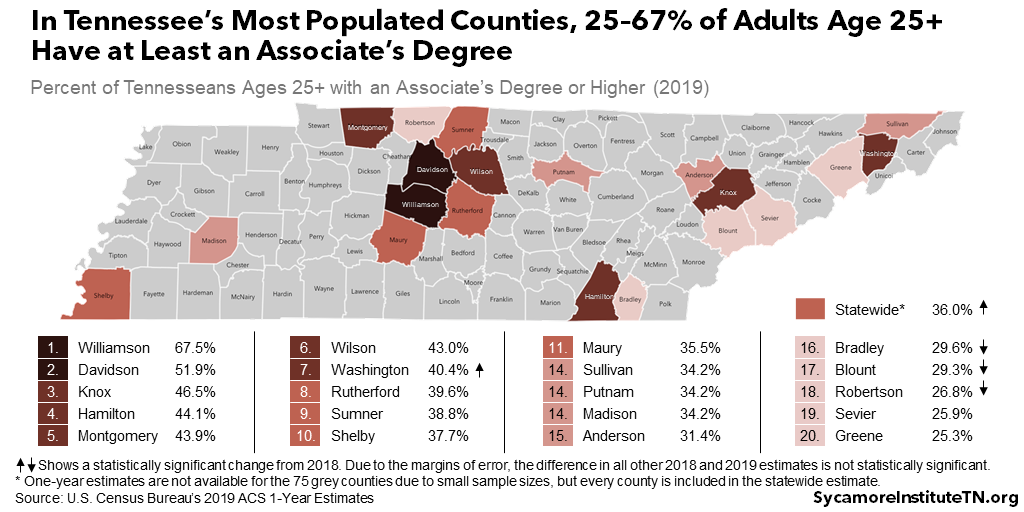
Figure 4
Education and Earnings in Tennessee
Higher levels of education continue to be associated with higher earnings in Tennessee (Figure 5). (1) In 2019, for example, Tennesseans with just a bachelor’s degree had median earnings of about $51,000. In other words, half of the people in that group made more and half earned less. For comparison, median earnings were 43% lower for Tennesseans with only some college or an associate’s degree — about $36,000.
Over the last decade, median earnings have grown for Tennesseans at almost every level of education (Figure 5). (1) (2) After adjusting for inflation, the greatest increase occurred for earnings of those with less than a high school diploma, which were 26% higher in 2019 than in 2010. Earnings grew more slowly for those with a high school diploma – up 7% — and those with a bachelor’s degree or with a graduate or professional degree — both up 2%. Meanwhile, median earnings declined just slightly for those with some college or an associate’s degree – down 0.5% in 2019 versus 2010.
Figure 5
References
Click to Open/Close
- U.S. Census Bureau. 2010-2019 American Community Survey 1-Year Estimates. [Online] September 17, 2020. Accessed from http://data.census.gov.
- U.S. Bureau of Labor Statistics. Consumer Price Index: R-CPI-U-RS. [Online] [Cited: September 14, 2020.] Accessed from https://www.bls.gov/cpi/research-series/r-cpi-u-rs-home.htm.
[1] Due to the margins of error, the difference in some 2018 and 2019 estimates is not statistically significant. The Census Bureau’s American Community Survey generates estimates based on a sample of the total population. The margin of error measures the likely range of the true value if every person were surveyed. When the error margins for two values overlap, the difference may simply be due to sampling or estimation issues. To learn more about the importance of samples, read our tips for interpreting statistics.