Each month, the Tennessee Department of Finance & Administration (F&A) reports how much tax revenue the state collected for the previous month. These reports help policymakers and the public understand how actual revenue collections compare to estimates from the start of the fiscal year. The Sycamore Institute’s Tennessee Tax Revenue Tracker, updated monthly, provides a quick visual snapshot of each report.
Last Updated: August 15, 2019
July 2019 Revenue Collections
The image below shows Tennessee’s revenue collections for FY 2019 relative to the estimates for which the state “budgeted” at the start of the fiscal year on July 1, 2018.
- Ultimately, Tennessee collected about $636 million (or 4%) more than was originally budgeted for the fiscal year that ended on June 30, 2019.
- Some of the over-collections were accounted for in the spending decisions made during the FY 2020 budget process, but a portion will be available for spending in future years.
For additional details, read F&A’s official July 2019 report on revenue collections.
![]()
Why Revenue Forecasts Are So Important
Forecasting how much tax revenue Tennessee will collect in a given year or month is a difficult but important part of maintaining a balanced budget, which the state constitution requires. F&A’s revenue forecasts have a major influence on decisions about spending. Overestimating revenues could force state policymakers to cut spending mid-year.
On the other hand, underestimating revenues creates unplanned surpluses which can be spent the following year or saved in the rainy day fund. The trade-off of a surplus is that policymakers may have preferred to either spend the money or reduce taxes in the current year.
See our Tennessee State Budget Primer for more on the implications of state revenue estimates and how accurate these estimates have been in recent years. To learn how F&A creates its revenue forecasts, read the department’s methodology here.
June 2019 Revenue Collections
The image below shows Tennessee’s revenue collections so far in FY 2019 relative to the estimates for which the state “budgeted” at the start of the fiscal year.
- Actual collections for June 2019 were about 6% higher than budgeted.
- As of June 30, 2019, Tennessee had collected about 96% of the $14.8 billion in total budgeted revenue for the current fiscal year.
- Collections through June were about $649 million higher (or 5%) than what was budgeted for the time period.
For additional details, read F&A’s official June 2019 report on revenue collections.
![]()
May 2019 Revenue Collections
The image below shows Tennessee’s revenue collections so far in FY 2019 relative to the estimates for which the state “budgeted” at the start of the fiscal year.
- Actual collections for May 2019 were about 4% higher than budgeted.
- As of May 31, 2019, Tennessee had collected about 86% of the $14.8 billion in total budgeted revenue for the current fiscal year.
- Collections through May were about $557 million higher (or 5%) than what was budgeted for the time period.
For additional details, read F&A’s official May 2019 report on revenue collections.
![]()
April 2019 Revenue Collections
The image below shows Tennessee’s revenue collections so far in FY 2019 relative to the estimates for which the state “budgeted” at the start of the fiscal year.
- Actual collections for April 2019 were about 14% higher than budgeted.
- As of April 30, 2019, Tennessee had collected about 78% of the $14.8 billion in total budgeted revenue for the current fiscal year.
- Collections through April were about $510 million higher (or 5%) than what was budgeted for the time period.
For additional details, read F&A’s official April 2019 report on revenue collections.
![]()
March 2019 Revenue Collections
The image below shows Tennessee’s revenue collections so far in FY 2019 relative to the estimates for which the state “budgeted” at the start of the fiscal year.
- Actual collections for March 2019 were about 3% higher than budgeted.
- As of March 31, 2019, Tennessee had collected about 63% of the $14.8 billion in total budgeted revenue for the current fiscal year.
- Collections through March were about $252 million higher (or 3%) than what was budgeted for the time period.
For additional details, read F&A’s official March 2019 report on revenue collections.
![]()
February 2019 Revenue Collections
The image below shows Tennessee’s revenue collections so far in FY 2019 relative to the estimates for which the state “budgeted” at the start of the fiscal year.
- Actual collections for February 2019 were about 4% higher than budgeted.
- As of February 28, 2019, Tennessee had collected about 56% of the $14.8 billion in total budgeted revenue for the current fiscal year.
- Collections through February were about $223 million higher (or 3%) than what was budgeted for the time period.
For additional details, read F&A’s official February 2019 report on revenue collections.
![]()
January 2019 Revenue Collections
The image below shows Tennessee’s revenue collections so far in FY 2018-2019 relative to the estimates for which the state “budgeted” at the start of the fiscal year.
- Actual collections for January 2019 were about 1% higher than budgeted.
- As of January 31, 2019, Tennessee had collected about 49% of the $14.8 billion in total budgeted revenue for the current fiscal year.
- Collections through January were about $183 million higher (or 3%) than what was budgeted for the time period.
For additional details, read F&A’s official January 2019 report on revenue collections.
![]()
December 2018 Revenue Collections
The image below shows Tennessee’s revenue collections so far in FY 2018-2019 relative to the estimates for which the state “budgeted” at the start of the fiscal year.
- Actual collections for December 2018 were about 1% higher than budgeted.
- As of December 31, 2018, Tennessee had collected about 40% of the $14.8 billion in total budgeted revenue for the current fiscal year.
- Collections through December were about $154 million higher (or 3%) than what was budgeted for the time period.
For additional details, read F&A’s official December 2018 report on revenue collections.
![]()
November 2018 Revenue Collections
The image below shows Tennessee’s revenue collections so far in FY 2018-2019 relative to the estimates for which the state “budgeted” at the start of the fiscal year.
- Actual collections for November 2018 were about 5% higher than budgeted.
- As of November 30, 2018, Tennessee had collected about 31% of the $14.8 billion in total budgeted revenue for the current fiscal year.
- Collections through November were about $137 million higher (or 3%) than what was budgeted for the time period.
For additional details, read F&A’s official November 2018 report on revenue collections.
October 2018 Revenue Collections
The image below shows Tennessee’s revenue collections so far in FY 2018-2019 relative to the estimates for which the state “budgeted” at the start of the fiscal year.
- Actual collections for October 2018 were just slightly higher than budgeted.
- As of October 31, 2018, Tennessee had collected about 24% of the $14.8 billion in total budgeted revenue for the current fiscal year.
- Collections through October were about $91 million higher (or 3%) than what was budgeted for the time period.
For additional details, read F&A’s official October 2018 report on revenue collections.
September 2018 Revenue Collections
The image below shows Tennessee’s revenue collections so far in FY 2018-2019 relative to the estimates for which the state “budgeted” at the start of the fiscal year.
- Actual collections for September 2018 were about 4% higher than budgeted.
- As of September 30, 2018, Tennessee had collected about 17% of the $14.8 billion in total budgeted revenue for the current fiscal year.
- Collections through September were about $88 million higher (or 34) than what was budgeted for the time period.
For additional details, read F&A’s official September 2018 report on revenue collections.
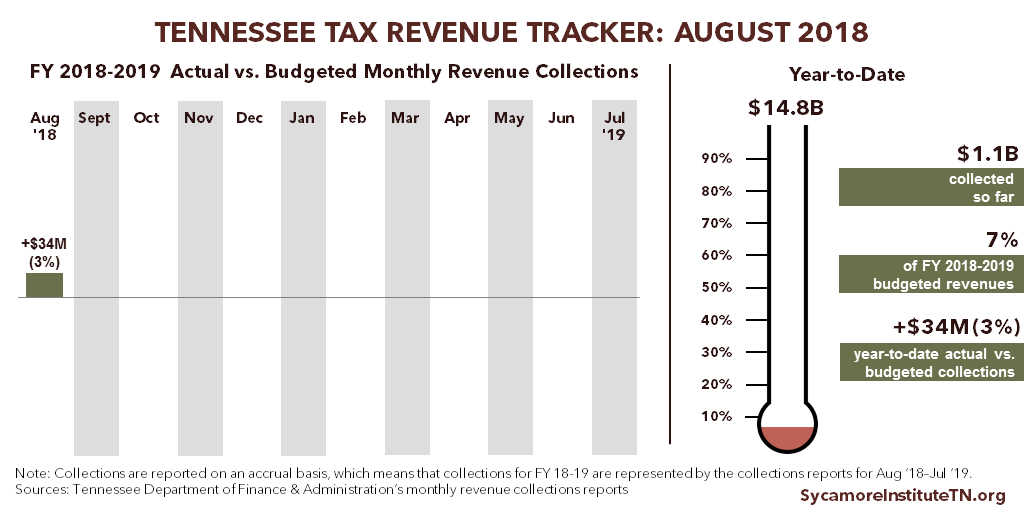
August 2018 Revenue Collections
The image below shows Tennessee’s revenue collections so far in FY 2018-2019 relative to the estimates for which the state “budgeted” at the start of the fiscal year.
- Actual collections for August 2018 were about 3% higher than budgeted.
- As of August 31, 2018, Tennessee had collected about 7% of the $14.8 billion in total budgeted revenue for the current fiscal year.
- Collections through August were about $34 million higher (or 3%) than what was budgeted for the time period.
For additional details, read F&A’s official August 2018 report on revenue collections.